-
Installation
-
With Kamon Telemetry
-
How To Guides
-
Migrations
-
-
Core Concepts
-
Foundations
-
Advanced
-
-
Instrumentation
-
Supported Frameworks
-
Akka
-
Akka HTTP
-
Cassandra Driver
-
Caffeine
-
Elasticsearch
-
Executors
-
Futures
-
JDBC
-
Kafka
-
Logback
-
Play Framework
-
Spring Framework
-
System Metrics
-
-
-
Reporters
-
Kamon APM
-
Using Kamon APM
-
Overview
-
Services
-
Traces
-
Dashboards
-
Alerts
-
Hosts
-
Investigating Issues
-
Settings and Administration
-
-
Spring MVC Instrumentation #
Since 2.1.13
![]()
This is an experimental feature that is currently enabled by default.
You can disable it by adding kanela.modules.spring.enabled = no
to your configuration.
The Spring MVC server instrumentation gives you traces and metrics for incoming requests.
HTTP Server Tracing #
The Spring MVC instrumentation automatically enables Context propagation and distributed tracing for incoming requests processed with Spring MVC, as well as lower level HTTP server metrics. The gist of the features provided by the instrumentation is:
- Context will be automatically propagated using HTTP headers.
- Server HTTP request Spans will be automatically created and propagated.
- Spans are created for view rendering operations.
- Lower level HTTP server metrics will be collected for the HTTP server side.
Here’s an example trace from spring-petclinic:
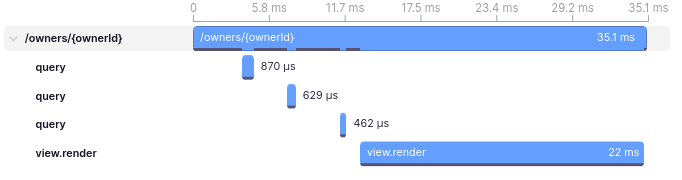
![]()
If You’re using DeferredResult for asynchronous controllers, there’s good news and bad news. The good news is that we measure full execution time of response processing! The bad news is that You’re in control of where the code is run, not Spring, so You’ll need to manually propagate the context, or use an instrumented executor.
HTTP Server Metrics #
As a lower level part of the instrumentation, Kamon will track the performance of the HTTP Server. You can control
whether HTTP Server metrics will be recorded or not by using the enabled setting:
kamon.instrumentation.spring {
  server.metrics {
    enabled = yes
  }
}
This feature is enabled by default and will collect the following metrics:
- component: Name of the HTTP Server Library.
- interface: Name of the interface on which the server is listening.
- port: Port number on which the HTTP server is listening.
- http.status_code: Name of the network interface being measured.
- component: Name of the HTTP Server Library.
- interface: Name of the interface on which the server is listening.
- port: Port number on which the HTTP server is listening.
- component: Name of the HTTP Server Library.
- interface: Name of the interface on which the server is listening.
- port: Port number on which the HTTP server is listening.
Manual Installation #
In case you are not using the Kamon Bundle, add the dependency below to your build.
libraryDependencies += "io.kamon" %% "kamon-spring" % "2.5.9"
    <dependency>
      <groupId>io.kamon</groupId>
      <artifactId>kamon-spring_2.13</artifactId>
      <version>2.5.9</version>
    </dependency>
implementation 'io.kamon:kamon-spring_2.13:2.5.9'
![]()
You must start your application with the instrumentation agent for this module to work properly.