-
Installation
-
With Kamon Telemetry
-
How To Guides
-
Migrations
-
-
Core Concepts
-
Foundations
-
Advanced
-
-
Instrumentation
-
Supported Frameworks
-
Akka
-
Akka HTTP
-
Cassandra Driver
-
Caffeine
-
Elasticsearch
-
Executors
-
Futures
-
JDBC
-
Kafka
-
Logback
-
Play Framework
-
Spring Framework
-
System Metrics
-
-
-
Reporters
-
Kamon APM
-
Using Kamon APM
-
Overview
-
Services
-
Traces
-
Dashboards
-
Alerts
-
Hosts
-
Investigating Issues
-
Settings and Administration
-
-
Trace Search #
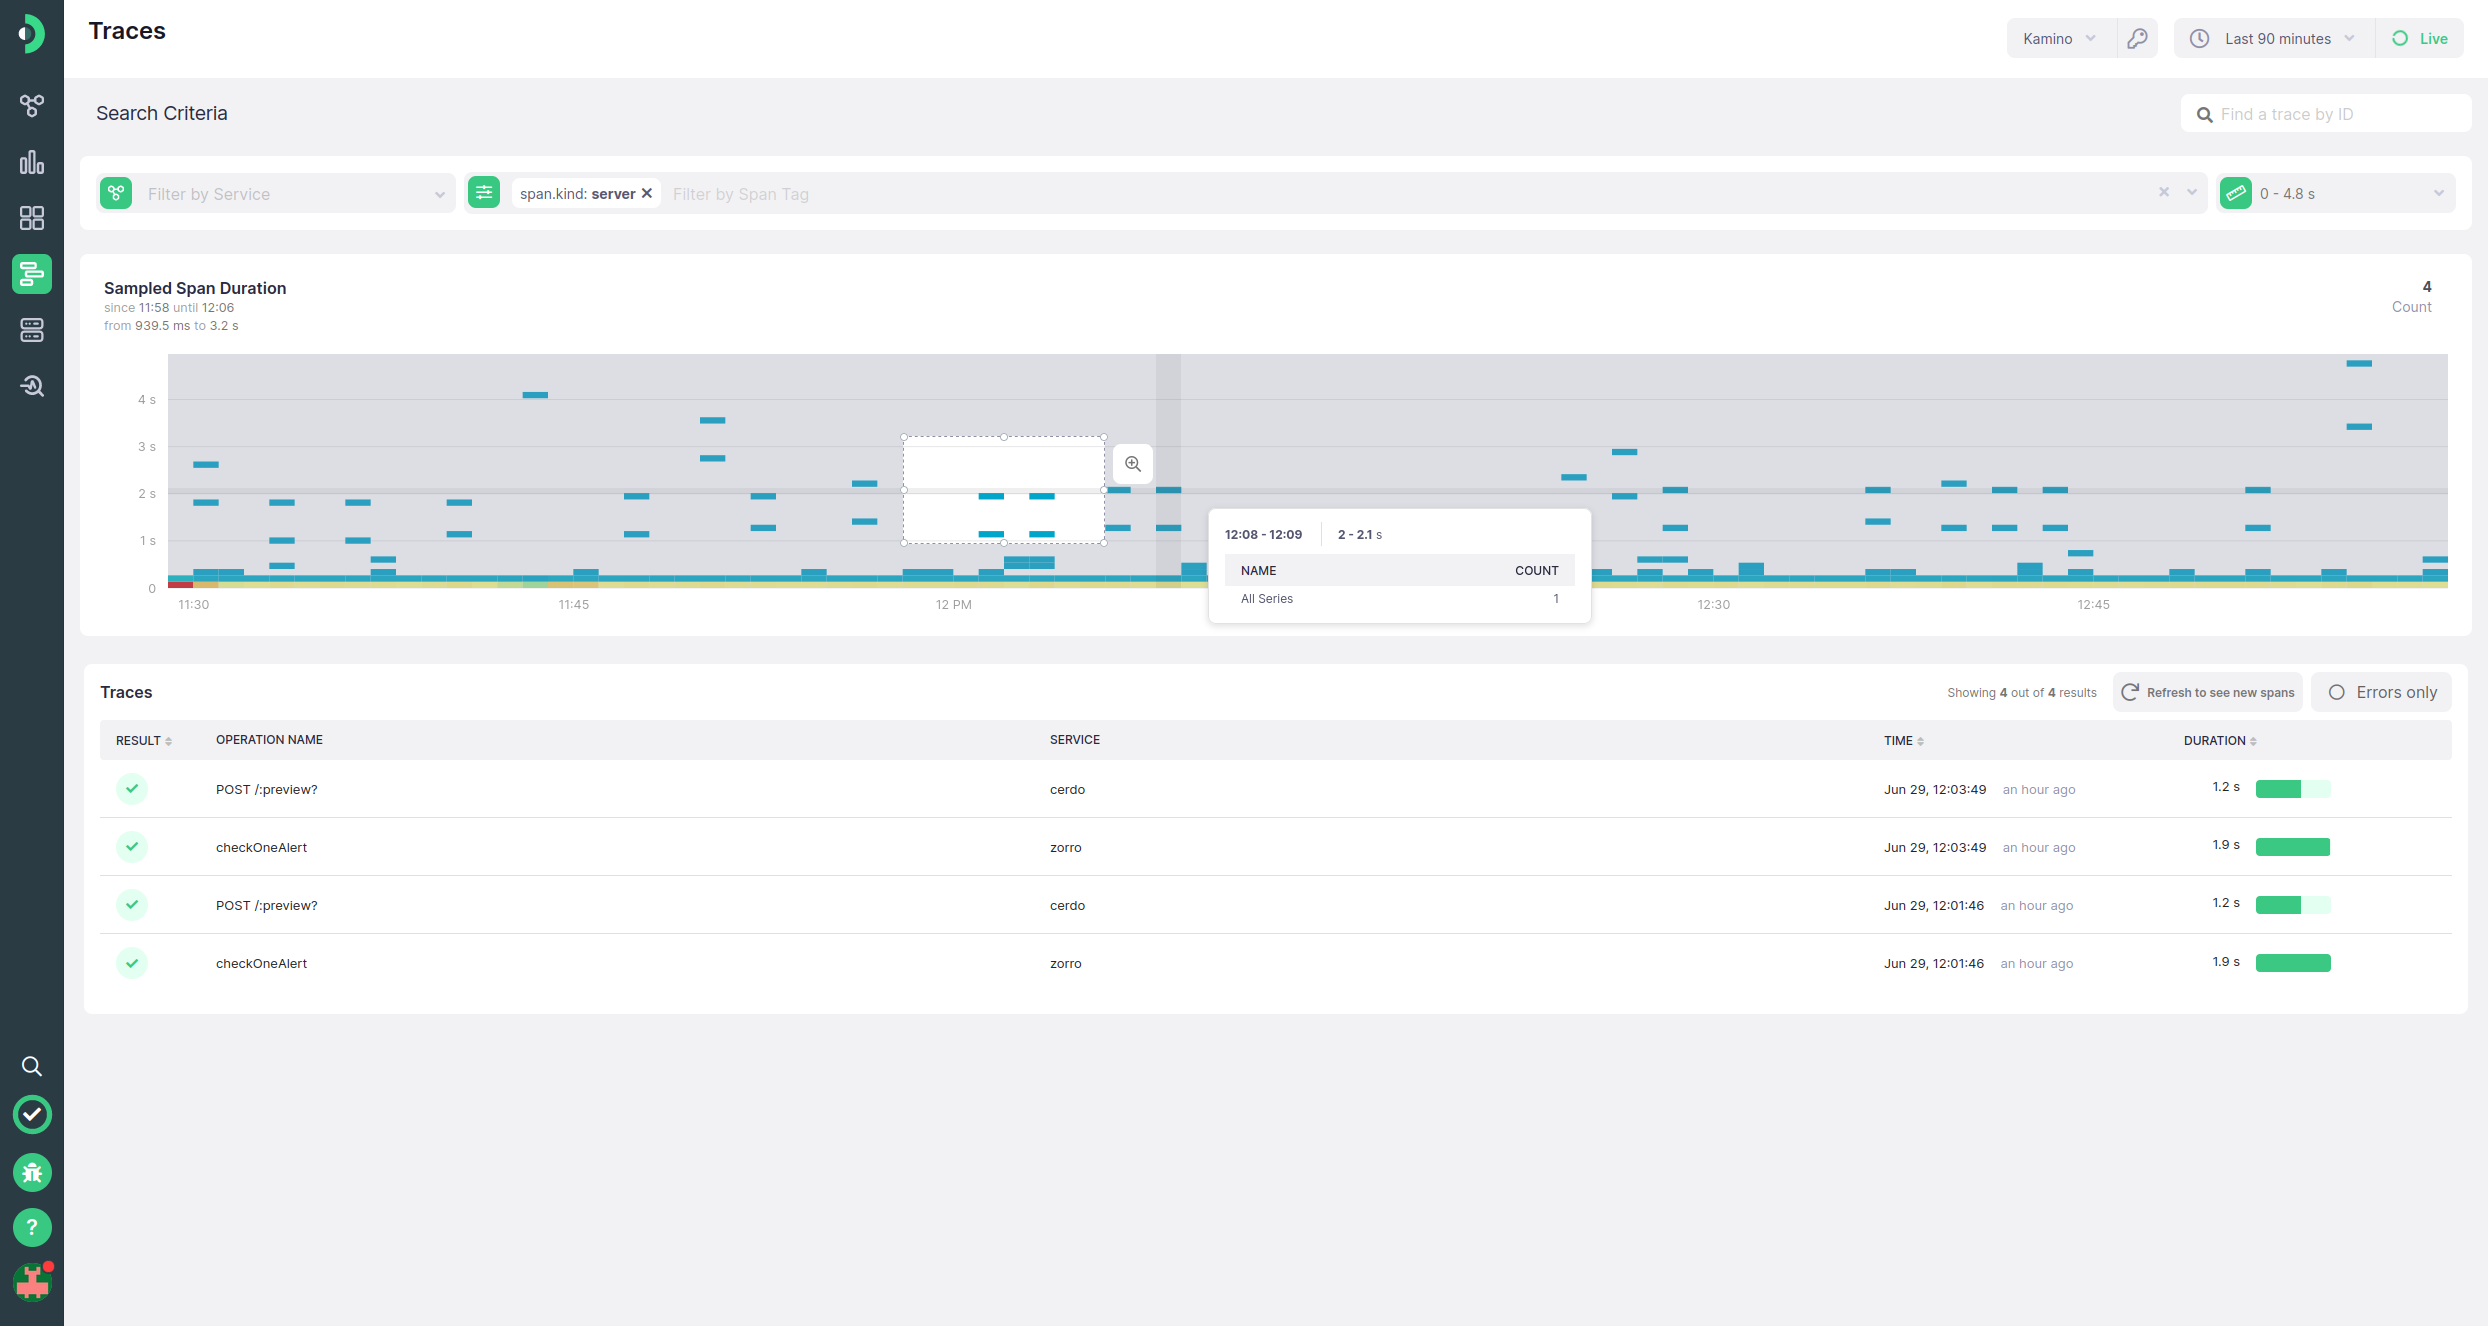
The Trace Search page is built for finding specific ingested (sampled) spans through filtering by service, duration, or arbitrary span tags. It contains the filters, a heatmap showing all sampled spans that match the criteria, and a paginated list of matching spans. One important note about this page is that it will not auto-update every minute if the time picker is set to live mode. This is meant to keep the spans fixed as you’re examining the list, rather than moving them as the data source refreshes. Refreshing needs to be done manually.
Span Filters #
The spans may be filtered using the Service filter, which will constrain it only to spans that have been recorded from inside a certain service - though the service does not need to be the originator (or root) of the trace. If no services are selected, all searches will be done across all spans, no matter the originating service.
The second filter is the tag search, which allows you to filter spans by the span tag values that the span has. For example, these can be the operation, http method, presence of error, or other arbitrary tags added either via automatic instrumentation or manually. The tag search allows for searching across both tag keys and tag values asynchronously by typing into the dropdown search field. If you wish to search exclusively for values within a certain tag, you can do so in one of two ways:
- Type in
groupname:(with a colon), where the group match must be exact. For examplehttp.status_code: - Click on the section, in which case the input will be pre-filled and exclusively values within the section shown
Note that the available tags are constrained by the selected services. They are not, however, constrained by already selected tag. It is therefore possible to select a combination of tags that never occur in the application, or are logically impossible
The third filter is the range duration filter. Upon page load, the minimum and maximum will be set to match the extreme values from your ingested spans. Spans can be filtered out by duration by changing the value in the slider or the input field. Zooming into the chart will also automatically update the values in the range filter.
Time selection in the time picker will also affect the filtered values, and updating the time picker will update the chart and list of spans.
By default, a tag filter of span.kind set to server will be set. Adding or removing any filters will make a “Reset Filters” button appear in the top right of the page, allowing you to return to the initial state.
Sampled Span Chart #
Below the filters bar, a heatmap chart showing durations of all sampled spans that match the filter criteria will be shown. The chart has no legend and cannot be added to dashboards, or be made the source of alerts. Selection can be made on the chart, on both the latency and time axes. Making a selection will update the values displayed in the span list, constraining them to the selection, but will not update any other element on the site. When a selection is made, the chart can be zoomed in on both the latency and time axes, which will update the duration range filter and the time picker accordingly. Doing so will always send the time picker into fixed time mode.
Span List #
A span list component lies underneath the tables, and shows a paginated list of spans that match the given criteria, as well as any selection on the heatmap. The component differs from the basic span list in three ways:
- It does not update with live time ticking. Instead, there is a refresh button that will bring the list (and chart) up to speed with any time that has passed
- There is an error toggle, which, when live, shows only spans with errors. Checking it will update both the list and the chart
- It has an additional column indicating the service name
Clicking on any of the span entries will open the trace details view.
Find by Trace ID #
Additionally, if you already know the trace ID of a trace you are searching for, you can enter it in the trace ID search in the top right corner. If the trace ID is valid, a drawer will be opened with trace details for that trace. Otherwise, an error will be shown with possible explanations as to why no trace was matched. Note that you can only find and view spans that are included in your retention period.