-
Installation
-
With Kamon Telemetry
-
How To Guides
-
Migrations
-
-
Core Concepts
-
Foundations
-
Advanced
-
-
Instrumentation
-
Supported Frameworks
-
Akka
-
Akka HTTP
-
Cassandra Driver
-
Caffeine
-
Elasticsearch
-
Executors
-
Futures
-
JDBC
-
Kafka
-
Logback
-
Play Framework
-
Spring Framework
-
System Metrics
-
-
-
Reporters
-
Kamon APM
-
Using Kamon APM
-
Overview
-
Services
-
Traces
-
Dashboards
-
Alerts
-
Hosts
-
Investigating Issues
-
Settings and Administration
-
-
Host Details #
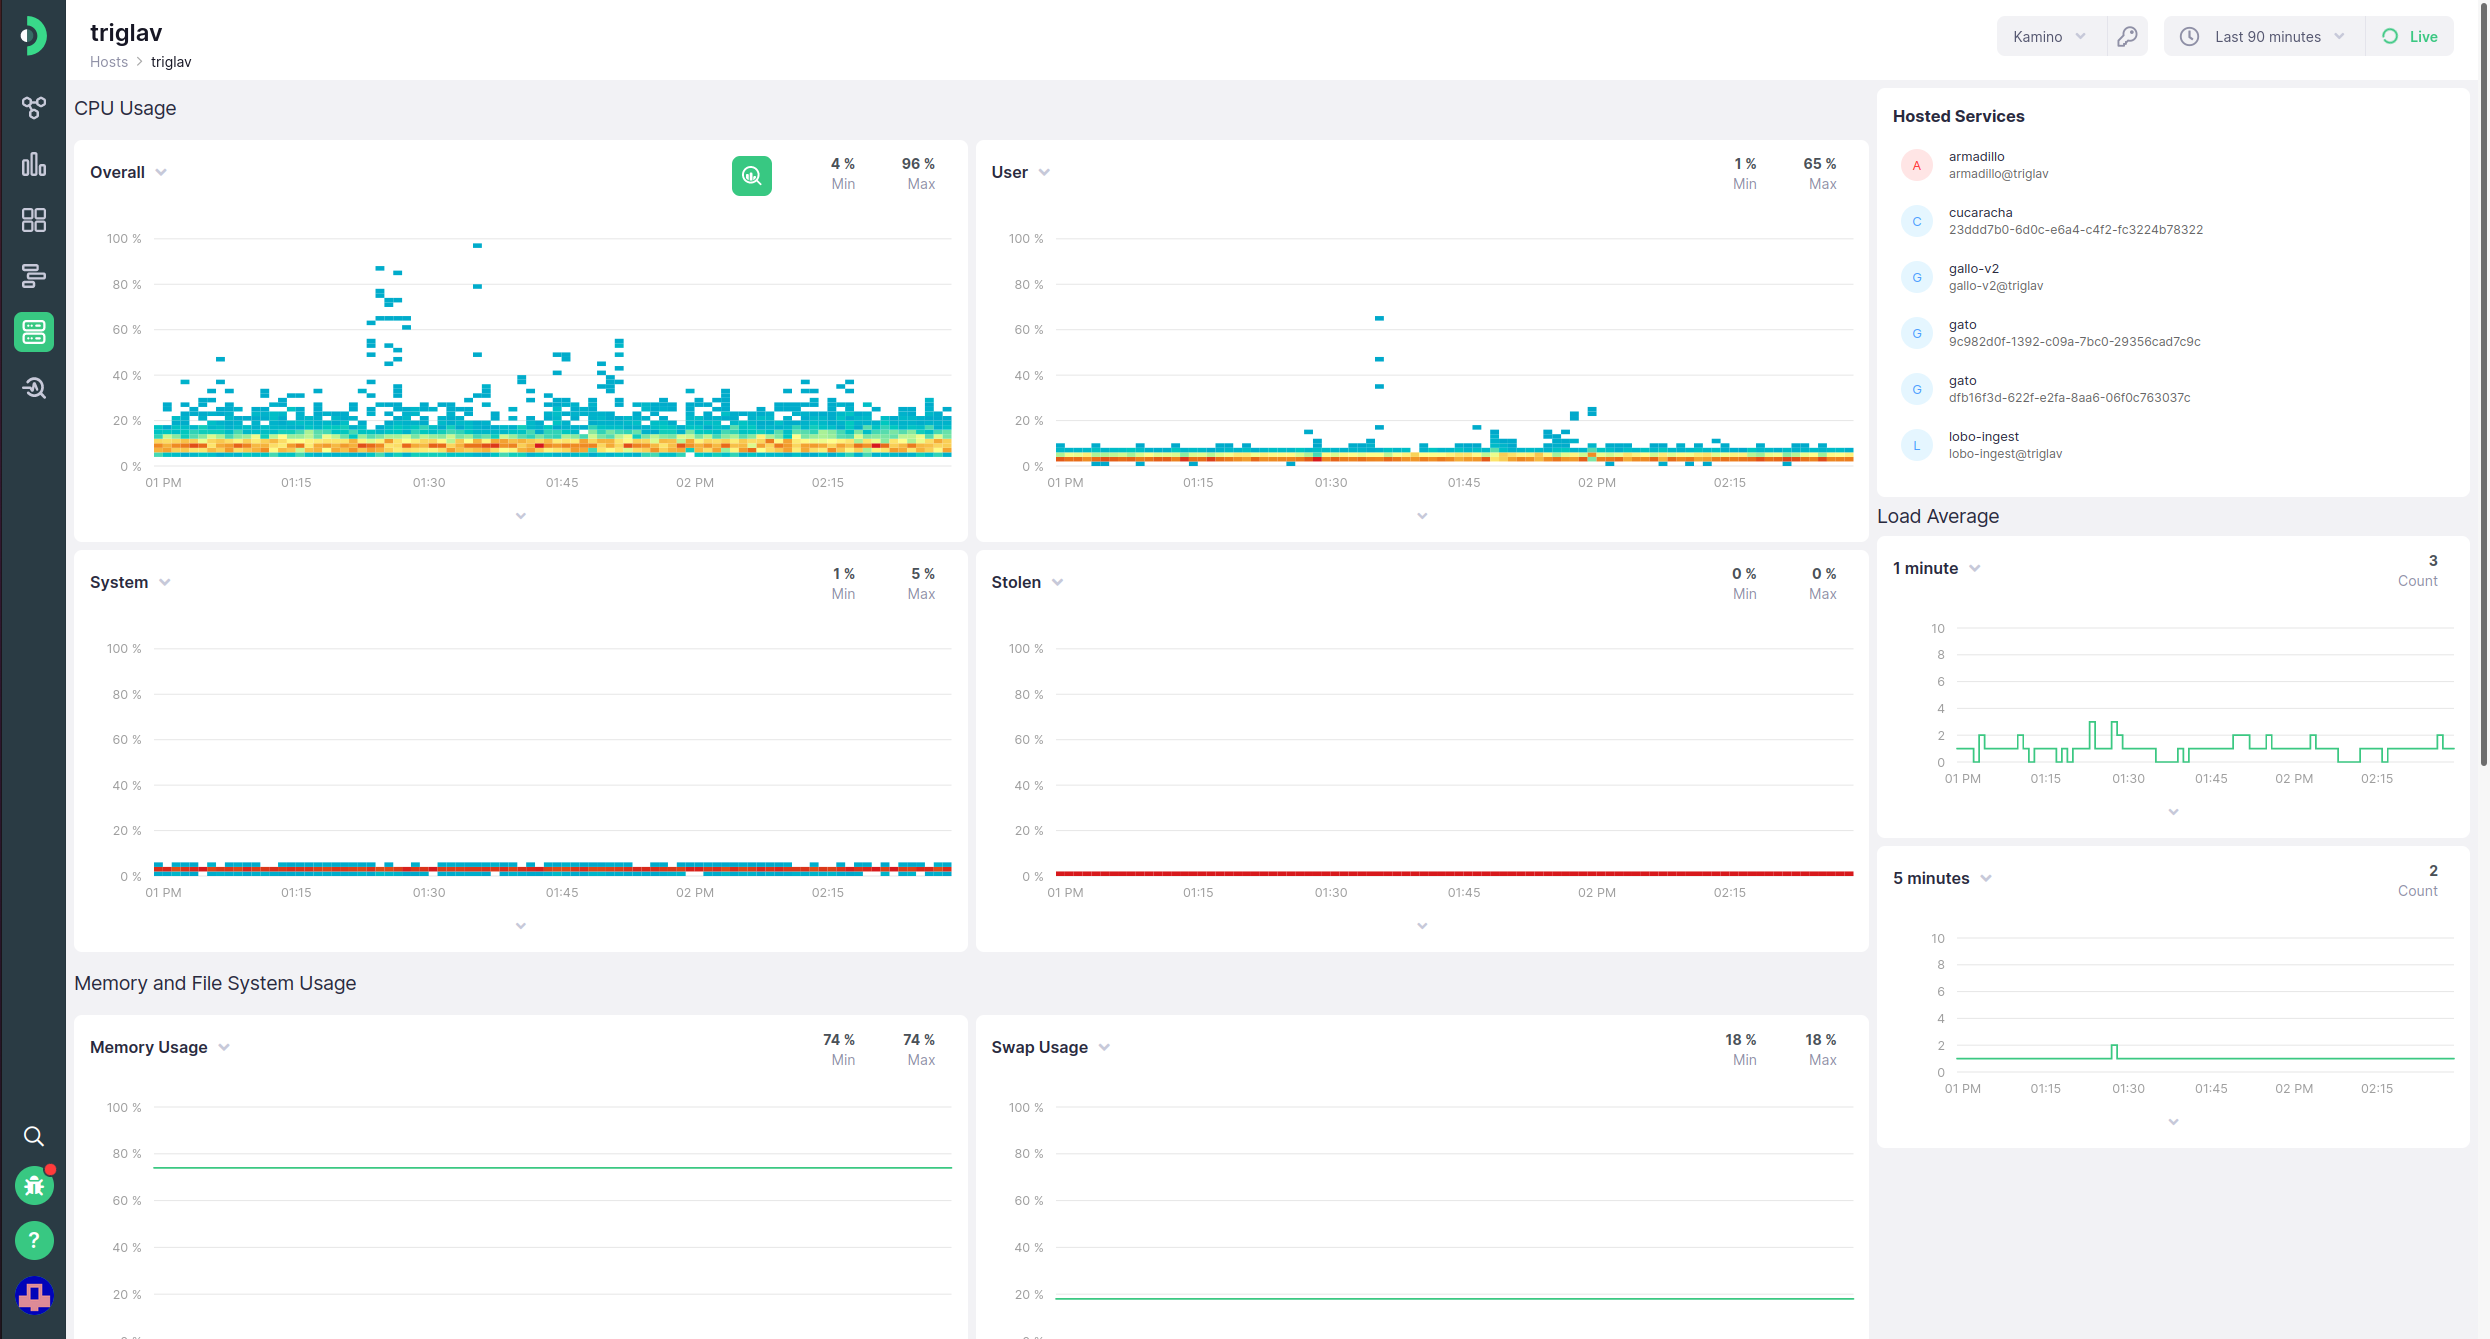
The host details page provides you with a deeper dive into information gathered about the host machine - CPU metrics, memory metrics, network metrics, load averages, and service instances running on that host.
The first section of the page describes the distribution of CPU usage, as percentages. The pre-made charts visualize overall CPU usage, as well as a breakdown into user, system, and stolen CPU usage. The second section lists memory and swap usage, as percentages of the available memory and swap, as well as the amount of bytes that were written to and read from the file system. You can expand the chart legend to see which line represents which value. Finally, the third section lists network usage, showing both numbers of packets written or read, as well as the amount of information, in bytes, for reads and writes.
In the sidebar, you can view a list of services, for each instance of the service running on that host. Note that services can freely run difference instances on one or more host machines, and a service might appear multiple times in this list (once for each host-local instance). Finally, underneath them, maximum load averages for 1 minute and 5 minute timespans are visualized as line charts.
Clicking on any of the services will take you to the service overview for that instance of the service. This means that you will not be viewing the complete information for the service, but merely for that particular instance.