-
Installation
-
With Kamon Telemetry
-
How To Guides
-
Migrations
-
-
Core Concepts
-
Foundations
-
Advanced
-
-
Instrumentation
-
Supported Frameworks
-
Akka
-
Akka HTTP
-
Cassandra Driver
-
Caffeine
-
Elasticsearch
-
Executors
-
Futures
-
JDBC
-
Kafka
-
Logback
-
Play Framework
-
Spring Framework
-
System Metrics
-
-
-
Reporters
-
Kamon APM
-
Using Kamon APM
-
Overview
-
Services
-
Traces
-
Dashboards
-
Alerts
-
Hosts
-
Investigating Issues
-
Settings and Administration
-
-
Exposing Metrics for Prometheus #
Prometheus is an open source monitoring and alerting toolkit. It has a dimensional data model, a really powerful and flexible query language and one very important difference in comparison with all other Kamon reporters: data has to be pulled out of your application instead of pushed to external servers.
This module exposes a scraping endpoint with all Kamon metrics in the Prometheus text format, all you will have to do after starting this module is add the target to your Prometheus server and start enjoying the awesomeness.
Installation #
libraryDependencies += "io.kamon" %% "kamon-prometheus" % "2.5.9"
    <dependency>
      <groupId>io.kamon</groupId>
      <artifactId>kamon-prometheus_2.13</artifactId>
      <version>2.5.9</version>
    </dependency>
implementation 'io.kamon:kamon-prometheus_2.13:2.5.9'
Once the reporter is on your classpath it will be automatically picked up by Kamon. When your application starts, you can go to http://localhost:9095/metrics to see your exposed metrics.
Configuration #
The default configuration is enough to get you started exporting metrics, but you are very likely to need tweaking the default bucketing configuration. Long story short, this module has to take the high definition data captured by Kamon and aggregate it into a reasonable number of buckets before exposing it to Prometheus, and the better you choose your buckets the more useful the data you can get out of Prometheus.
It is very important that you iterate on your buckets configuration to find the right tradeoff between granularity and number a reasonable number of exposed time series per metric (each bucket ends up being a separate time serie in Prometheus). The quality of the percentiles you get is greatly influenced by your bucketing configuration, take some time to think it through!
kamon.prometheus.buckets {
    default-buckets = [
      10,
      30,
      100,
      300,
      1000,
      3000,
      10000,
      30000,
      100000
    ]

    time-buckets = [
      0.005,
      0.01,
      0.025,
      0.05,
      0.075,
      0.1,
      0.25,
      0.5,
      0.75,
      1,
      2.5,
      5,
      7.5,
      10
    ]

    information-buckets = [
      512,
      1024,
      2048,
      4096,
      16384,
      65536,
      524288,
      1048576
    ]
  }
The measurement unit on each metric will dictate which bucketing configuration applies:
-
time-bucketsfor metrics with a unit in the time dimension. Everything is scaled to seconds. -
information-bucketsfor all units in the information dimension. Everything is scaled to bytes. -
default-bucketsare used when there is no measurement unit information in a metric.
Sending environment tags to Prometheus #
It is possible to provide custom tags in application.conf by providing kamon.environment.tags
with the value you wish to set.
kamon.environment.tags {
  custom1 = "test1"
  env = staging
}
To enable the Prometheus reporter to use these values within your application metrics, you have to enable
the include-environment-tags in your kamon.prometheus configuration:
kamon.prometheus {
  include-environment-tags = true
  embedded-server {
    hostname = 0.0.0.0
    port = 9095
  }
}
Teasers #
These are extracted from our Elementary Akka Setup guide.
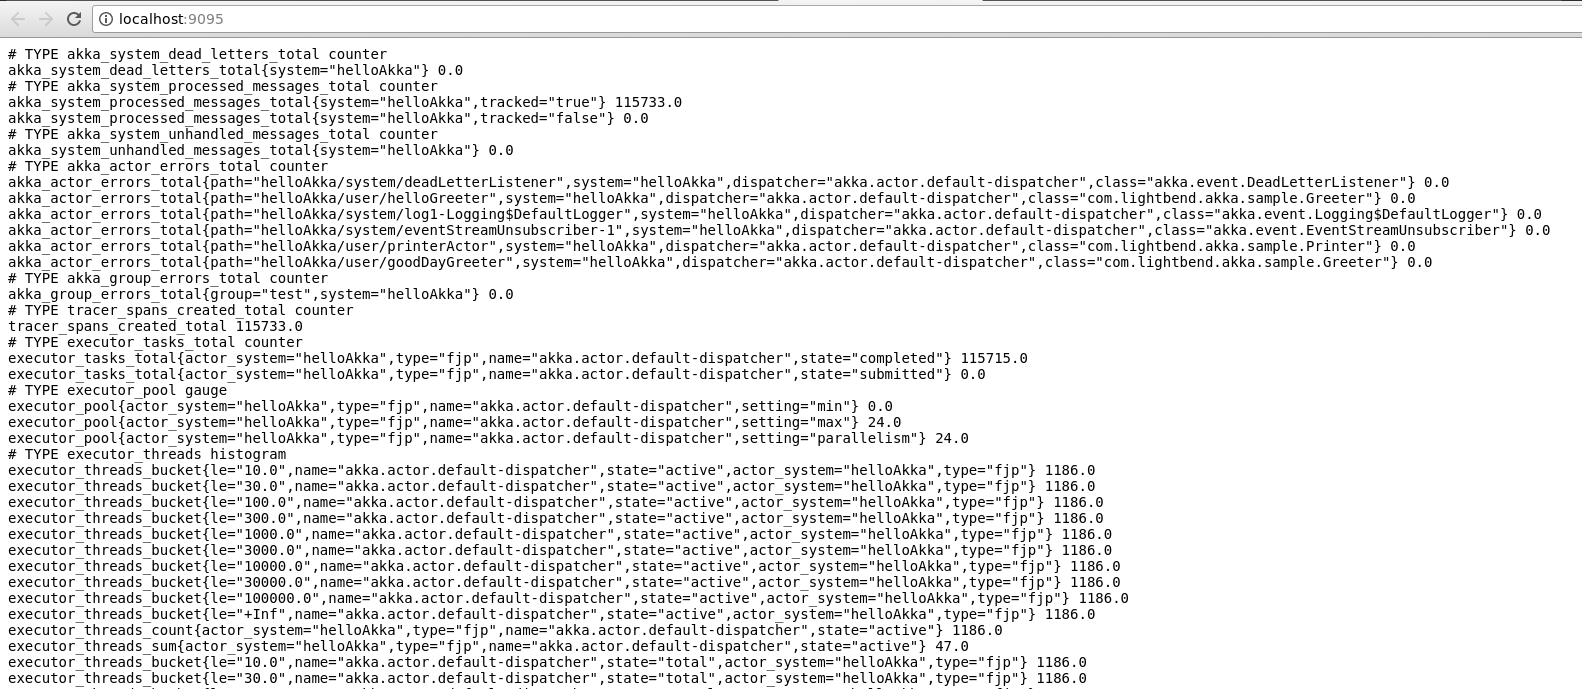
Scraping endpoint exposed by Kamon:
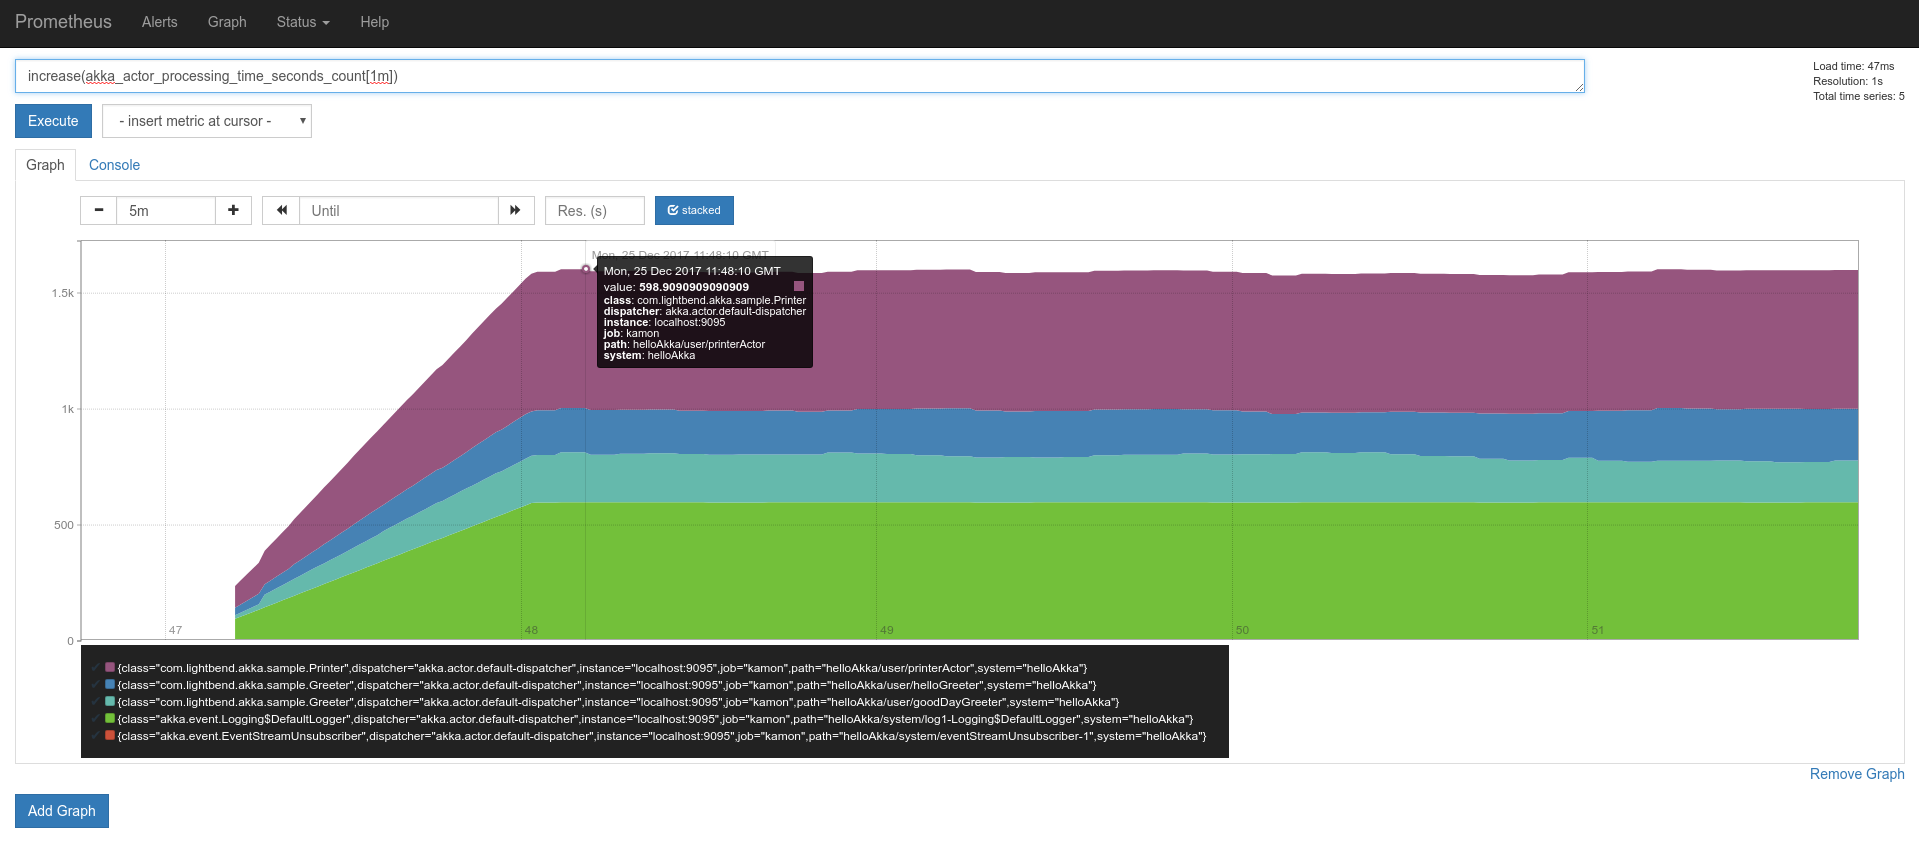
A simple query with actor’s processing time in Prometheus’ UI: