-
Installation
-
With Kamon Telemetry
-
How To Guides
-
Migrations
-
-
Core Concepts
-
Foundations
-
Advanced
-
-
Instrumentation
-
Supported Frameworks
-
Akka
-
Akka HTTP
-
Cassandra Driver
-
Caffeine
-
Elasticsearch
-
Executors
-
Futures
-
JDBC
-
Kafka
-
Logback
-
Play Framework
-
Spring Framework
-
System Metrics
-
-
-
Reporters
-
Kamon APM
-
Using Kamon APM
-
Overview
-
Services
-
Traces
-
Dashboards
-
Alerts
-
Hosts
-
Investigating Issues
-
Settings and Administration
-
-
Trace Details #
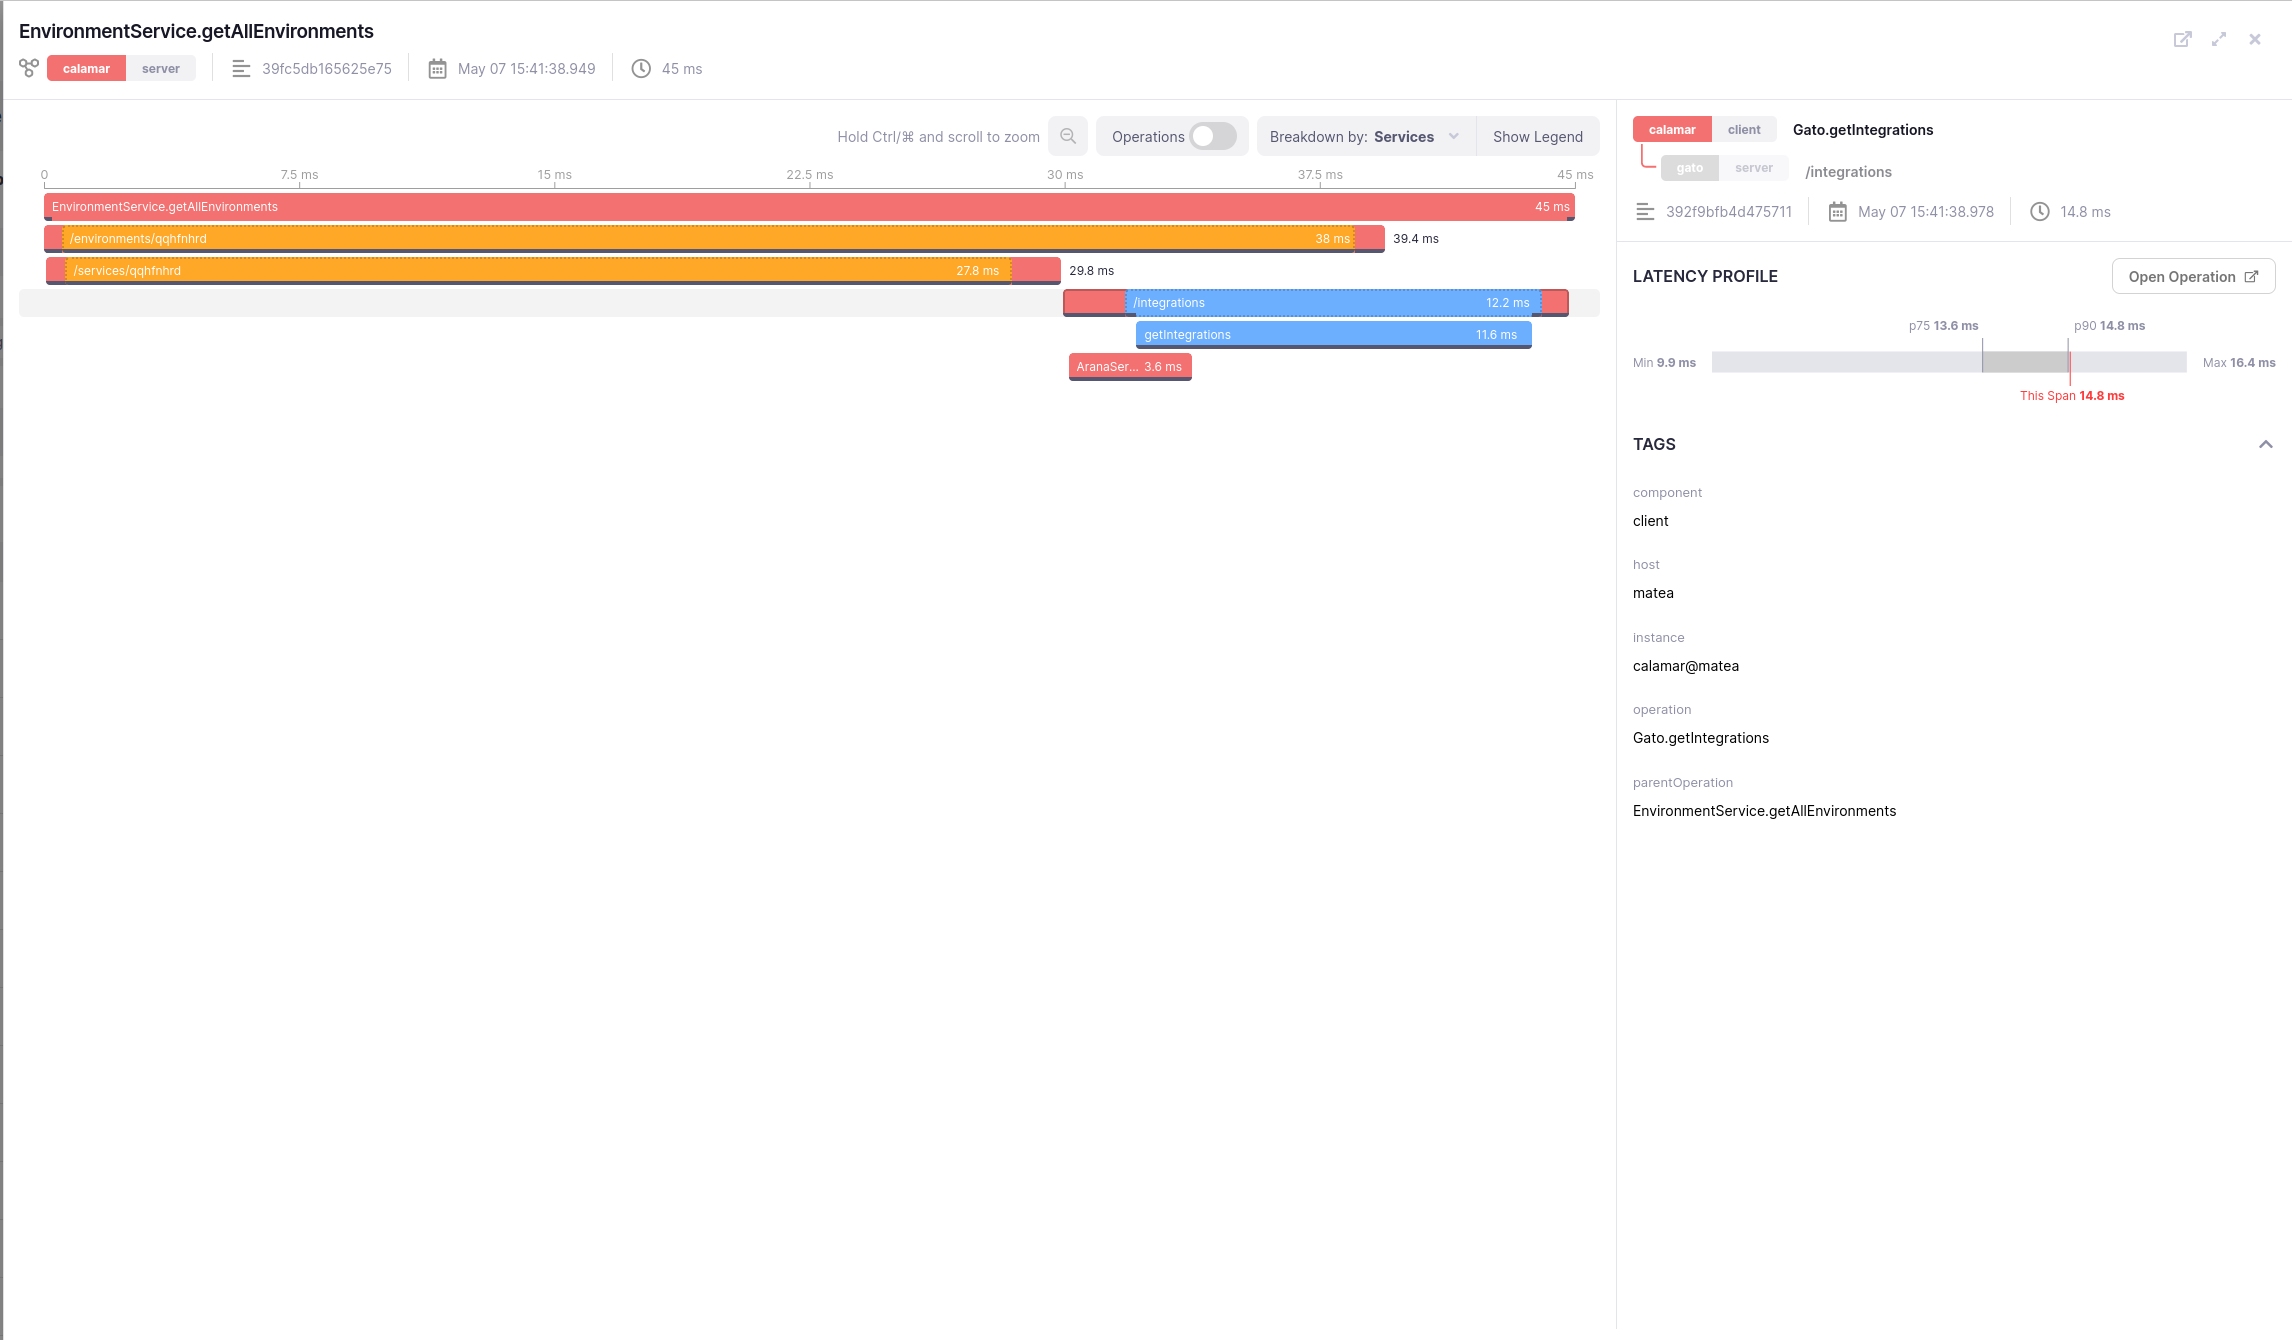
The Trace Details drawer is a visualization of your traces, and all spans contained within, with breakdowns, tags, and statistical information. It can be accessed from any span list, by clicking on a certain span. This will open a drawer containing detailed information about this span, and the trace it belongs to.
The drawer header will contain the name of the root span of the trace, as well as quick information about it - the trace ID, name of the service from which the trace started, and more. Each tag can be hovered for more detailed information. On the right of the header, three actions can be performed:
- The drawer can be maximized, for smaller screens
- The trace can be opened in an external page, for bookmarking or sharing
- The drawer can be closed (
Escor the browser back button can also be used to close it)
The rest of the drawer can broadly be split into the trace visualization, with a list of spans in a timeline and ways to toggle additional details, and the span details sidebar, which shows a more detailed breakdown of a particular span. When the drawer is initially opened by clicking on a span, the details drawer will have that span as the focused span.
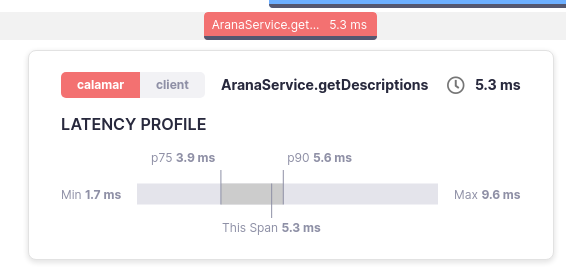
Each span in the trace is shown as a line, its position based on the span’s duration, and with a timeline at the top of it. If there are more spans in the trace than fit inside the current view, the list can be scrolled to reveal more spans. Each span will show the name of the span operation, as well as its duration, assuming there is enough space to display that information. On hover, each span will show a tooltip with a few details about the span - its parent service, the span kind, the duration, and the relative position of the duration compared to the overall distribution of span durations for that particular operation.
Spans might have additional icons to the left of them, if the instrumentation is experiencing clock drift, if the span has no parent span despite being in this trace, or if the span has an error. The icons can be hovered for more detail.
Zooming In #
The entire trace visualization area can be zoomed into, on the time axis, by holding down Ctrl (or ⌘ on OS X) and scrolling the mouse button. The area zoomed into depends on the
position of the mouse cursor in the visualization. For example, if the cursor is on the extreme left, the beginning of the area will be zoomed into. The spans will expand (and leave
the preview area), and the time grid will update to show the zoomed in period. Zooming out can be performed in the same way, but with the opposite direction of the scroll wheel,
or by clicking the zoom out button.
Span Breakdown #
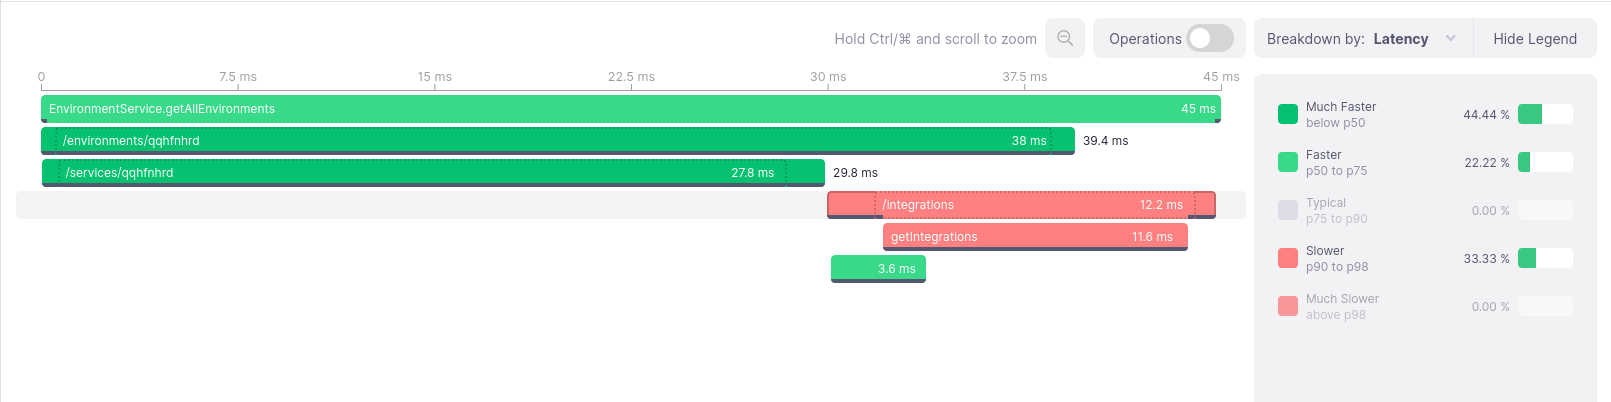
By defaults, spans are colored by the service they originate from. Each unique service will be assigned a color. The legend that explains it can be toggled by clicking the Show/Hide Legend button. Alternatively, spans can be broken down (and coloured) by their relative performance, compared to other spans for that same operation. This mode can be toggled from the Breakdown by dropdown. In that mode, spans will be broken down into five categories:
- Much faster (up to p50) - Deeper red
- Faster (p50 to p75) - Pale red
- Typical (p75 to p90) - Grey
- Slower (p90 to p98) - Pale green
- Much slower (over p98) - Deeper green
Note that these names and colors are not necessarily indicative of problems, merely an estimation of the situation. When this mode is toggled, the legend will be updated to explain the colors and breakdown.
Operations #
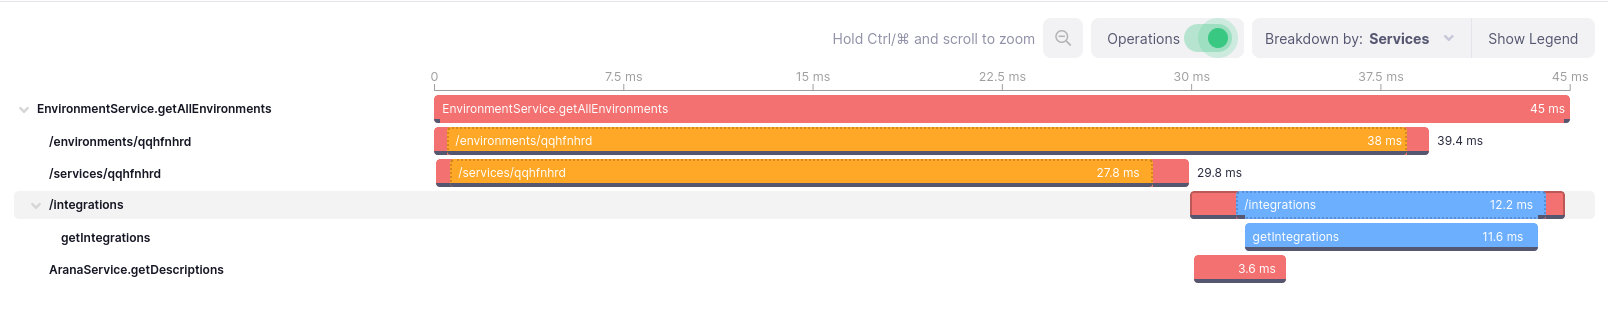
The operation name for each span will only be visible if there is enough space for it. To always preview the operation names, you can enable the option to preview them by flipping the relevant switch. When the switch is turned on, operation names for all spans will appear to the left of them. If the span is a joint span, only the client operation name will be shown to the left.
Additionally, in this mode, every parent span can be collapsed (or expanded again) by clicking on an indicator to the right of the name. Collapsing a span will hide all descendants of that span from the list of spans. You may wish to use this functionality if you are confident that some part of a trace is not interesting to your current investigation.
Span Details #
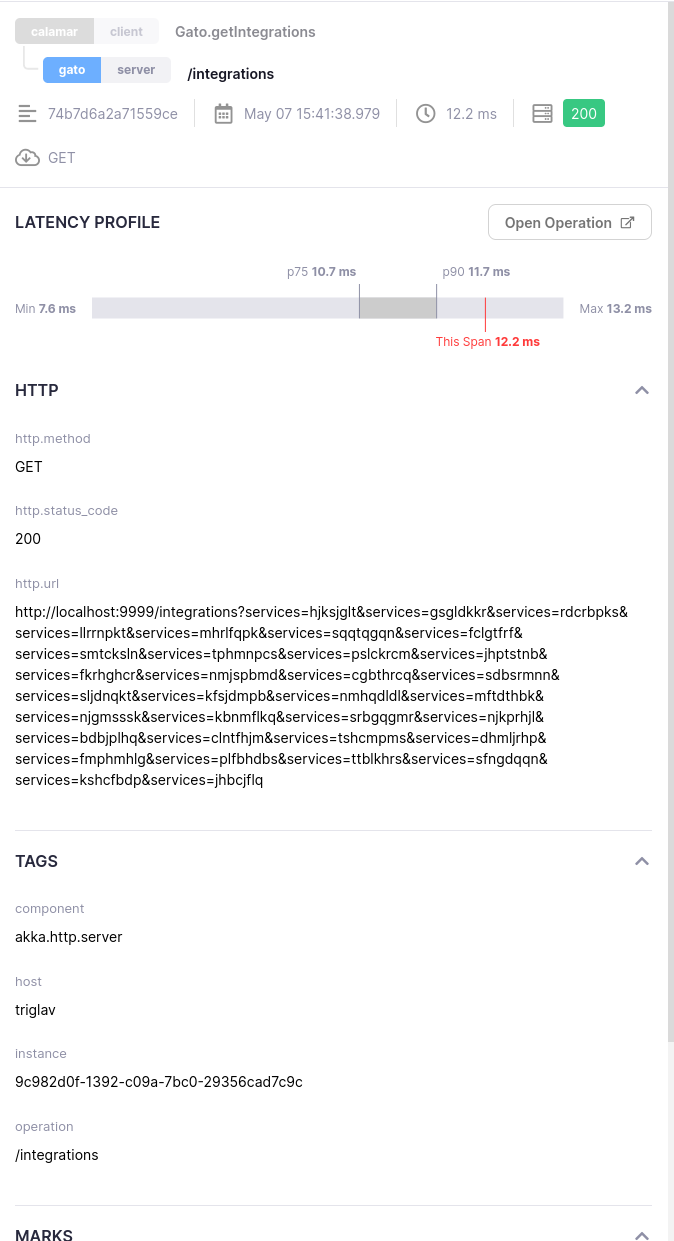
For a deeper dive into a span, you may use the Span Details sidebar, which will always be present to the right of the list of spans. It will show several details about the span:
- Operation name
- Service name and span kind
- Span ID, end time, duration, HTTP method and status, error, and more, depending on span tags
- Latency profile
- Link to operation details
- Tags
- Marks
The span id and other tags will be shown as icons and the value. You can hover them for additional details.
The latency profile will show the distribution of duration for that particular operations, as well as the position of the current span’s duration in that distribution. The minimum, maximum, p75 and p90 will always be shown. Durations less than p75 will be considered fast, and will be displayed in green. Those over p90 will be considered slow and shown in red. If they fall in between the points, they will be considered average and colored grey.
The tags will be grouped into sections, if appropriate. Error, database and HTTP tags will, if present, always get their dedicated sections. Certain tags, which are considered well-known tags, will get special formatting and be formatted as blocks of code that can be copied or expanded in-app into a separate pop-out box. These include the error message, error stacktrace, database query, and more. The tags will always be shown as title-value pairs. All other tags will be placed together in a common section.
Joint Spans #
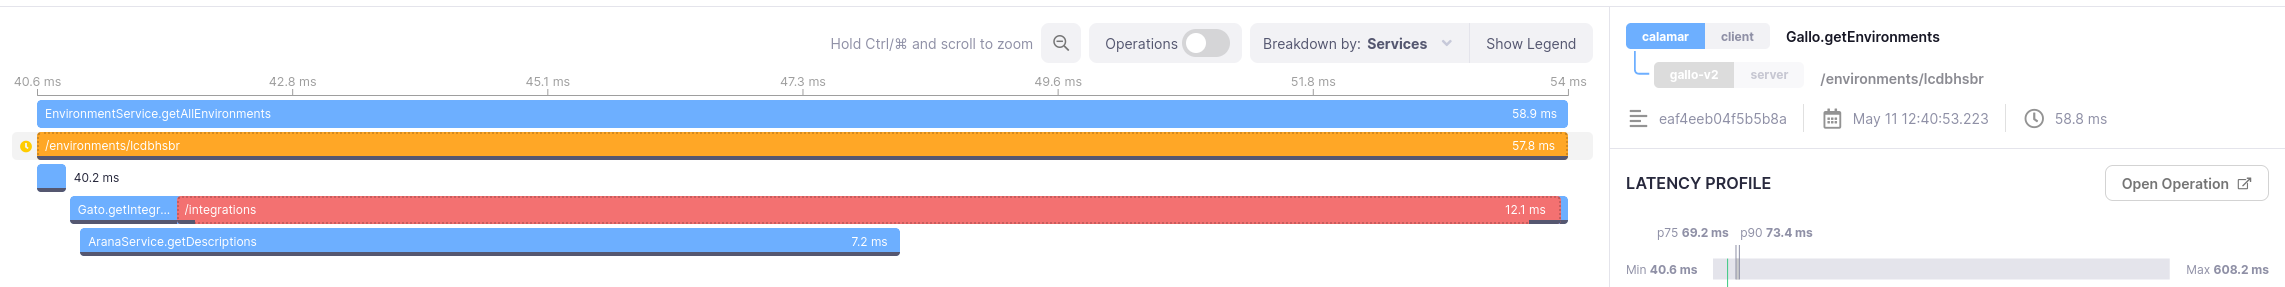
Joint spans are created in Kamon APM when a span from one service continues in a different service and awaits the conclusion of the remote span. They can be considered to be a visualization of single operation distributed across two services. In this case, the server span on the called service will be visualized within the span for the client operation of the caller service. Otherwise, they behave as independent spans. They will appear as two entries in the header of the span details sidebar, and their indicators can be clicked to switch between them and their details.
Marks #
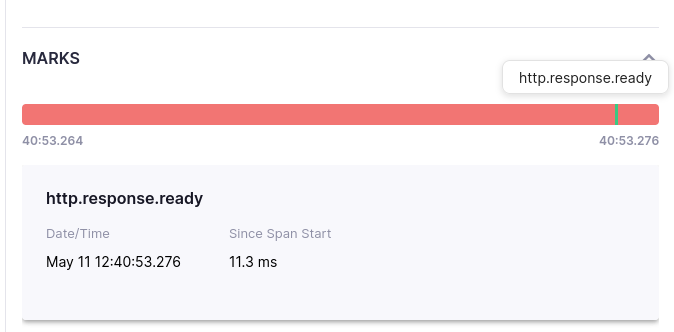
Marks, if any are present on the span, will be visualized at the bottom of the span details sidebar. They will be shown as indicators on a timeline that indicates span duration in red, with marks in black. Hovering over the marks will show the mark text content and will highlight the entry in the list. If marks occur outside of the recorded duration of the span, they will be shown on a grey background instead.
Underneath the visual indicator, marks will be shown as a list, indicating text content, time when they occurred, time since start of span, and for marks after the first, time since the last mark has been recorded