-
Installation
-
With Kamon Telemetry
-
How To Guides
-
Migrations
-
-
Core Concepts
-
Foundations
-
Advanced
-
-
Instrumentation
-
Supported Frameworks
-
Akka
-
Akka HTTP
-
Cassandra Driver
-
Caffeine
-
Elasticsearch
-
Executors
-
Futures
-
JDBC
-
Kafka
-
Logback
-
Play Framework
-
Spring Framework
-
System Metrics
-
-
-
Reporters
-
Kamon APM
-
Using Kamon APM
-
Overview
-
Services
-
Traces
-
Dashboards
-
Alerts
-
Hosts
-
Investigating Issues
-
Settings and Administration
-
-
Dashboards #
Kamon APM comes with charts and breakdowns already prepared with server metrics, JVM information, JDBC and DB pool information, Akka metrics, host metrics, and more. But we can neither predict every monitoring need you may have, nor can we visualize your custom metrics automatically. This is where dashboards come in.
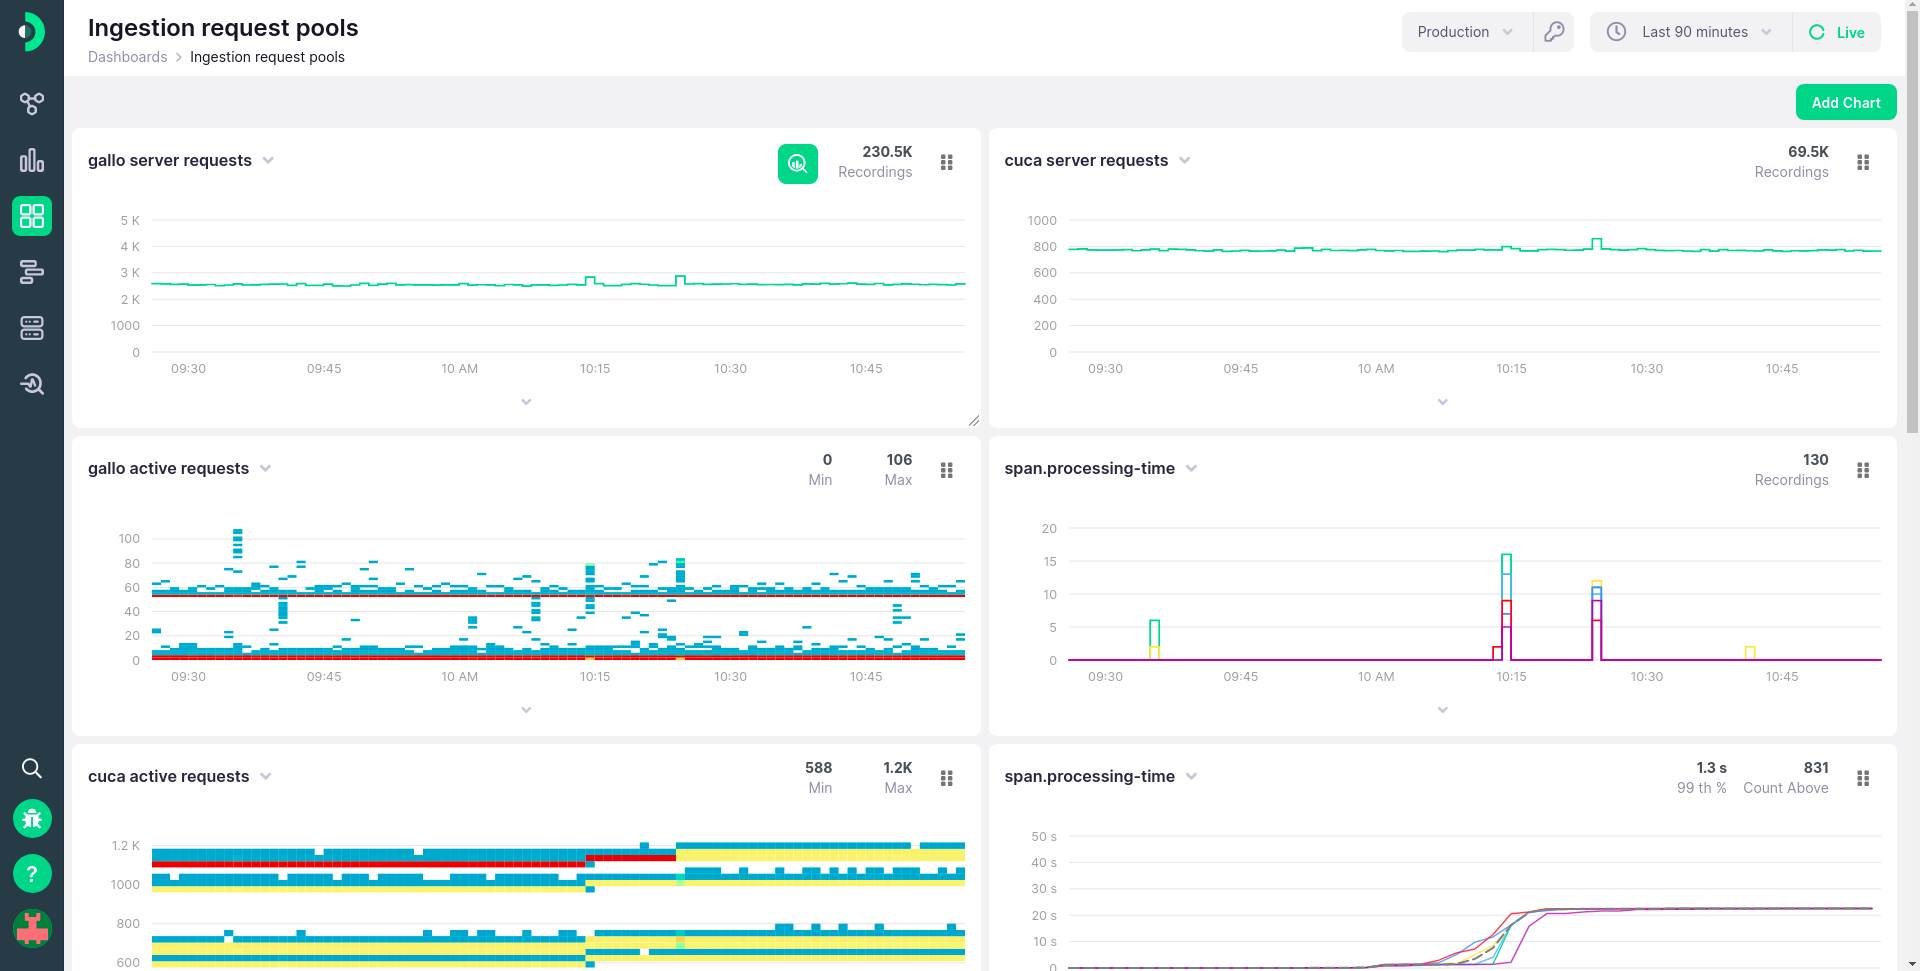
With Kamon APM dashboards, you can create named custom collections of charts for any metric you are reporting to Kamon APM, choose any of the chart types available for those metrics, and customise the layout of your dashboards to suit your own needs. The metrics can come from your services, for your hosts, or even from Kamon APM’s internal statistics. You can have as many dashboards as you like, and each can have an unlimited number of charts inside of it. These custom charts have the same abilities as any other chart in the system, and will respond to time picker, can be hovered and zoomed, and will have summaries and legends of their own.
Charts contained in a dashboard can be arranged to your satisfaction. They can be dragged into a number of pre-determined sizes, as well as re-arranged by dragging and dropping them elsewhere on the dashboard. You can get an experience similar to Grafana or another chart management tool without having to leave Kamon APM.
Charts and Environments #
Dashboards and dashboard charts have one peculiarity - unlike services, hosts, or alerts, they are not limited to a single environment. The same list of dashboards is available independently of which environment you are currently using. The charts inside of those dashboards can work in two different ways: they can be locked to a particular environment, or they can be using the current environment. The first use case is likely obvious, but the second might not be at first glance. This feature is there for uses cases where you’re running the same services in production and in staging or development. This way, you can switch between environments and get the same type of metrics, without having to have separate dashboards for these use cases. You can read about creating dashboard charts to learn more!
![]()
When switching between environments, charts bound to the current evironment will match services by name. Make sure the same services share the same name across environments.