-
Installation
-
With Kamon Telemetry
-
How To Guides
-
Migrations
-
-
Core Concepts
-
Foundations
-
Advanced
-
-
Instrumentation
-
Supported Frameworks
-
Akka
-
Akka HTTP
-
Cassandra Driver
-
Caffeine
-
Elasticsearch
-
Executors
-
Futures
-
JDBC
-
Kafka
-
Logback
-
Play Framework
-
Spring Framework
-
System Metrics
-
-
-
Reporters
-
Kamon APM
-
Using Kamon APM
-
Overview
-
Services
-
Traces
-
Dashboards
-
Alerts
-
Hosts
-
Investigating Issues
-
Settings and Administration
-
-
Configuring Alerts #
Alerts can be created to keep track of any metric being ingested into your system, be it metrics tracked in your service, host metrics, or even usage metrics from Kamon APM itself. You can configure them to bring attention to issues, and even send alerts to outside notification channels, if configured thresholds are crossed for a sufficient period of time.
You can create a new alert in Kamon APM by using the Create Alert button on the Alerts page, using the same button in the service overview sidebar, or by creating it from an existing chart anywhere in the application. Any of these buttons will open a Create Alert modal. When creating an alert from the service overview page, the data source will be prefilled to match that service. When creating it from a chart, all revelant chart information will be copied into the modal.
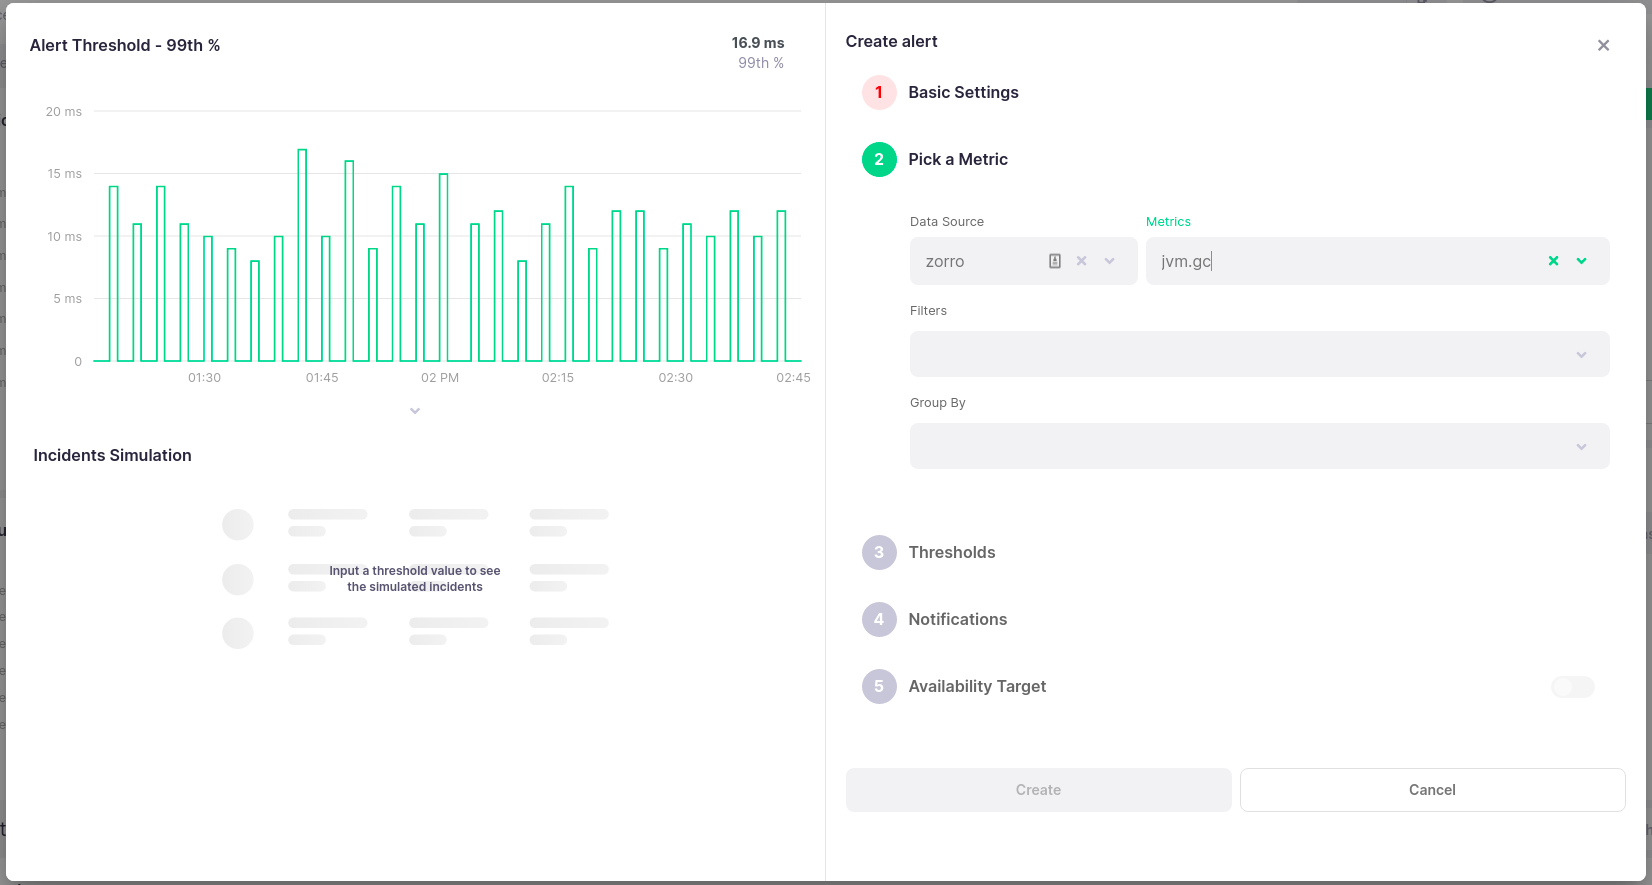
The Create Alert modal is split into two large sections - the preview on the left hand side, and the configuration form on the right hand side.
Alert Preview #
The preview section will show three smaller sub-sections, one under the other. The first will be a chart preview of the alert. It will appear as soon as you configure the data source and metric, and will match the current time period selected in the time picker. As a threshold is defined, it will appear in the preview as a dashed red line, with a semi-transparent red area indicating the “danger zone” in which the alert would be triggered. Any period of time for which the alert would have been triggered will be highlghted with an additional red overlay. The chart otherwise behave as other line charts in the application, with three further constraints:
- The chart will have no chart actions
- The chart cannot be analyzed
- The chart cannot be selected or zoomed into - the time period is locked
Underneath it, a list of Simulated Incidents will be previewed. These incidents are a preview of the incidents that would have happened in the currently selected time period, if the alert had existed at the time. They will match the incidents previewed in the chart above.
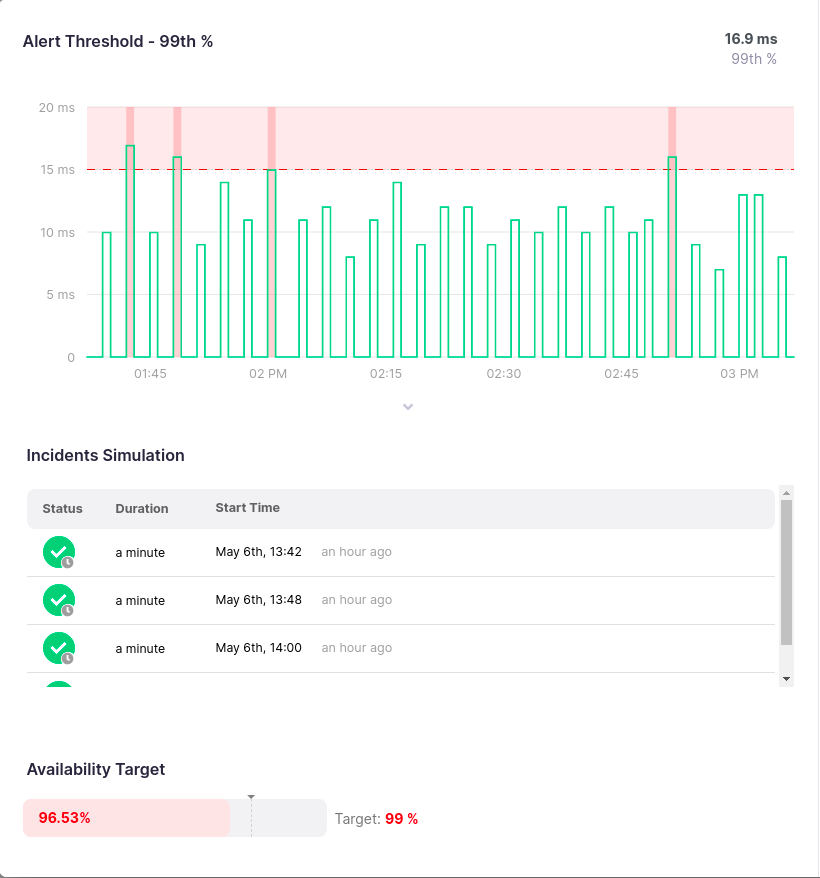
The third section, the availability target simulation, will be shown only if the relevant switch is turned on in the form. It will preview the current status compared to the set availability target, within the set memory scope. You can read more about that in the relevant section.
Alert Configuration Form #
The configuration form is split into several steps, split across topics, in which you can fine-tune the configuration of your alert.
| Step | Required | Default Value | Explanation |
|---|---|---|---|
| Data Source | ✔ | None | Service or usage statistic from which to track a metric |
| Metric | ✔ | None | Which metric to keep track of (e.g., jvm.gc or span.processing-time) |
| Filter By | ❌ | None | Only include records which have a metric tag matching all of the values |
| Group By | ❌ | Everything | Group by, and draw separately, according to value for selected metric tags |
| Aggregation | ✔ | p99 | Which aspect of the data is compared to trigger the alert |
| Percentile | Percentile only | 99 | For percentile aggregation, which percentile to plot |
| Comparison | ✔ | Above | Condition to compare alert threshold and value. If true, alert will trigger |
| Threshold | ✔ | None | The alert threshold, determined when to trigger the alert |
| Unit | ✔ | Latency | Which unit to use to label the y axis |
| Evaluation Period | ✔ | 3 min | How long must the condition be true for the alert to trigger |
Basic Settings #
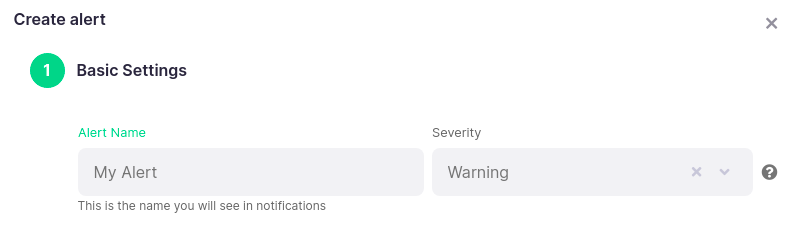
In this section, you will name your alert and choose its severity level. The name is a required field, and will be the main identifier of your alert across the application. It does not need to be unique, but it is suggested that it is, so that you have an easier time finding it. The severity level can be Warning or Critical, and only the latter will trigger external notifications. There is an icon next to it which, upon hover, will note so in a tooltip.
Pick a Metric #
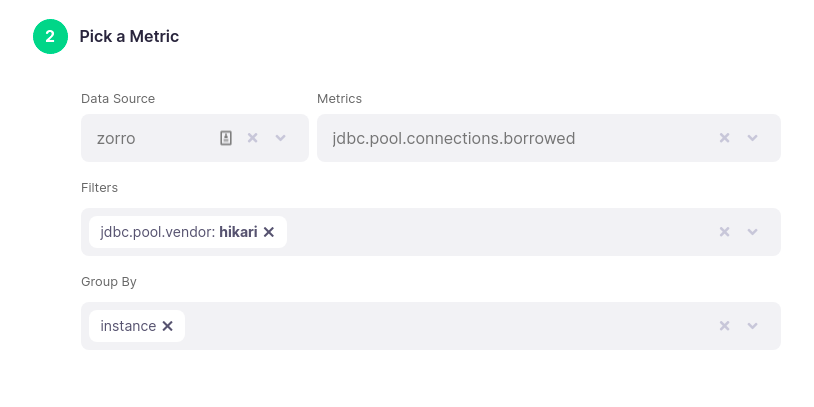
To be able to configure an alert, first you will need to select a Data Source. The Data Source can be one of three things:
- Any Service sending metrics to Kamon APM for the current environment
- Host metrics being sent from your host machines
- Internal Kamon APM usage metrics (currently span ingestion statistics)
Upon selecting a data source, you will be able to select any of the metrics coming from that data source. As soon as a metric is selected, an initial chart visualization of it will appear in the preview area to the left.
![]()
When on the free Developer Plan, you will only be able to use the first 5 services added as the Data Source. You can read about service statuses and plans to learn more.
You will be able to select any of the metrics being sent by the service. These include span metrics, metrics provided by your active instrumentation modules, or any custom metric you are manually keeping track of inside of your application! Depending on the metric selected, you will be able to set up custom filtering (i.e., including only some data points) or grouping into separate values. The possible filters and grouping will correspond to the recorded metric tags.
Thresholds #
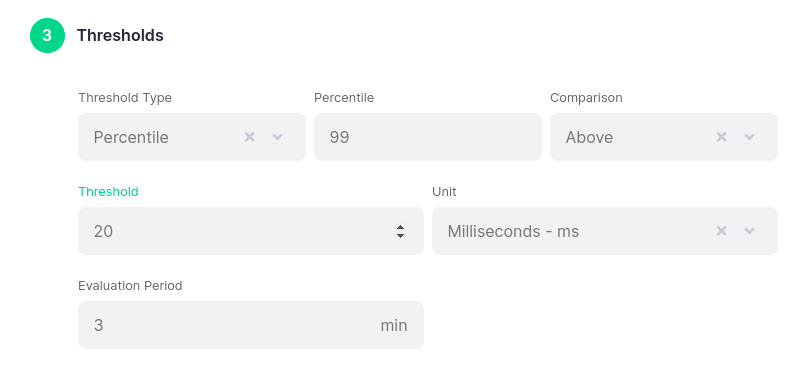
In this step, you will need to pick which aspect of the metric you wish to visualize, and how to compare it to a threshold. The specific aggregation will depend on your metric type, as is detailed
in the table below. The value of this metric will be compared to a fixed threshold given an operator (one of <, >, ==, <= or >=). If a condition evaluates to true for long enough, the
alert is considered triggered. The how long is determined by the Evaluation Period field. The condition will need to be true for at least the given number of minutes for the alert to mark a new
incident. Finally, you will need to select a unit, as Kamon APM is not always aware of the semantics of the metric you’re recording.
| Counter | Gauge | Range Sampler | Timer | Histogram | |
|---|---|---|---|---|---|
| Count | ✔ | ✔ | ✔ | ✔ | ✔ |
| Throughput | ✔ | ✔ | ✔ | ✔ | ✔ |
| Sum | ✔ | ✔ | ✔ | ✔ | ✔ |
| Min | ❌ | ✔ | ✔ | ✔ | ✔ |
| Max | ❌ | ✔ | ✔ | ✔ | ✔ |
| Meadian | ❌ | ✔ | ✔ | ✔ | ✔ |
| Mean | ❌ | ✔ | ✔ | ✔ | ✔ |
| Percentile | ❌ | ✔ | ✔ | ✔ | ✔ |
| Error % | ❌ | ❌ | ❌ | span.processing-time |
❌ |
One special metric, span.processing-time, allows the error rate aggregation, which is the percentage of requests that are error, in overall requests. This aggregation will appear only if this metric is used, and will require you to always group values by the error tag, but never filter by its values. When setting the threshold for this, it can have a precision of up to three decimals.
Notifications #
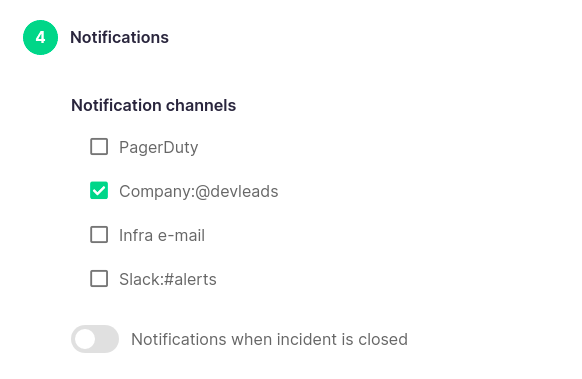
In the Notifications section, you can select one or more channels to notify the alert triggers. You can configure them using the channels list page. By default, a notification will be sent to all of the selected channels when an alert begins. You can also activate an additional notification to the same channels once the incident is closed by turning on the switch beneath these checkboxes.
![]()
Availability Target #
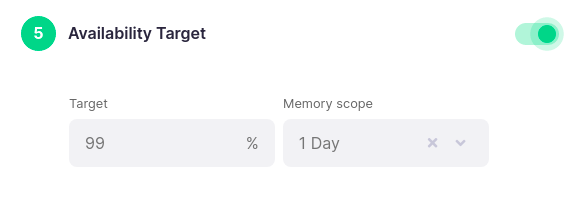
This section is optional, and needs to be toggled on using the switch in the section header to be enabled. When configured, an additional section will appear in the alert preview. The availability target is determined by two numbers:
- The percentage of time for which the alert must not be triggered for the target to be satisfied
- The period for which to evaluate