-
Installation
-
With Kamon Telemetry
-
How To Guides
-
Migrations
-
-
Core Concepts
-
Foundations
-
Advanced
-
-
Instrumentation
-
Supported Frameworks
-
Akka
-
Akka HTTP
-
Cassandra Driver
-
Caffeine
-
Elasticsearch
-
Executors
-
Futures
-
JDBC
-
Kafka
-
Logback
-
Play Framework
-
Spring Framework
-
System Metrics
-
-
-
Reporters
-
Kamon APM
-
Using Kamon APM
-
Overview
-
Services
-
Traces
-
Dashboards
-
Alerts
-
Hosts
-
Investigating Issues
-
Settings and Administration
-
-
Traces and Spans #
With Kamon APM, you can visualize, analyze, and deep-dive into traces, to discover what is happening with your services and APIs, analyze failures, and do so much more. However, before we can get into any of that, we need to explain what traces and spans are, and what Kamon APM utilizes them for.
The basic building block of traces are spans. A span is a record of a single operation, with a name, start and end times, and other information. A span can describe a HTTP request, a database call, or any arbitrary unit of work inside of a service. Spans also have a reference to their parent span, or the span which started the operation. A span which has no parent is called a root span.
When we collect these spans together to describe everything that needed to happen for a process to be executed, we get a trace. A trace is an organized collection of spans that make up the larger process. For example, when an API endpoint is called, the code that is started makes several database calls, crunches some numbers, and returns a response. In this case, the root span is the API endpoint handler, and all other operations will be recorded as separate spans, as children or other descendants of the original operation.
A span does not necessarily need to happen in the same service, and in microservice architectures often does not. Spans that make up a trace can come from multiple different services as they communicate with each others. We call such traces distributed traces.
Span Tags #
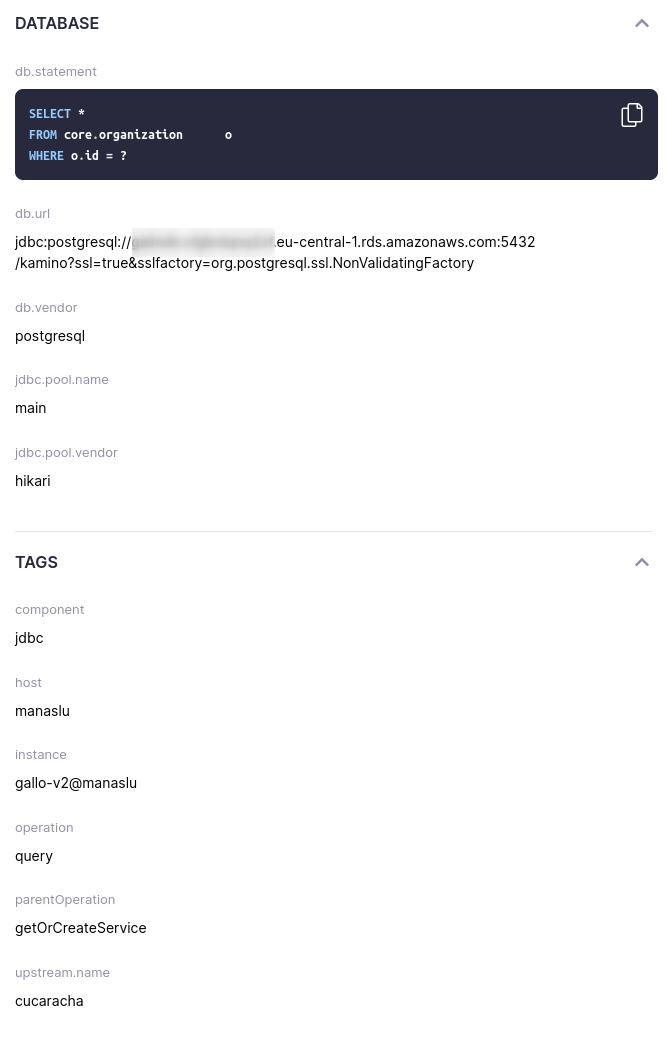
Spans can also carry an arbitrary number of tags, which are free-form string key-value pairs. All spans should have some common tags, such as operation, component
(typically the library used to instrument your code), or error. You can learn more about them in the Kamon Telemetry tags documentation. They can
be freely added using both Kamon Telemetry and OpenTelemetry. You can gain access to these tags in the trace details drawer.
Span Marks #
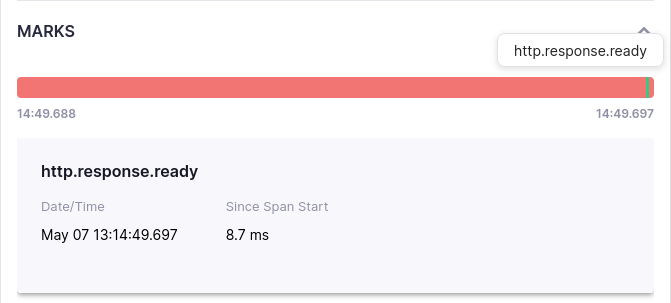
In addition to tags, spans can also have marks. Marks are free-form text labels with a timestamp, and are meant to provide markers for certain key moments or segments of an operation. You can read more about recording marks with Kamon Telemetry here.
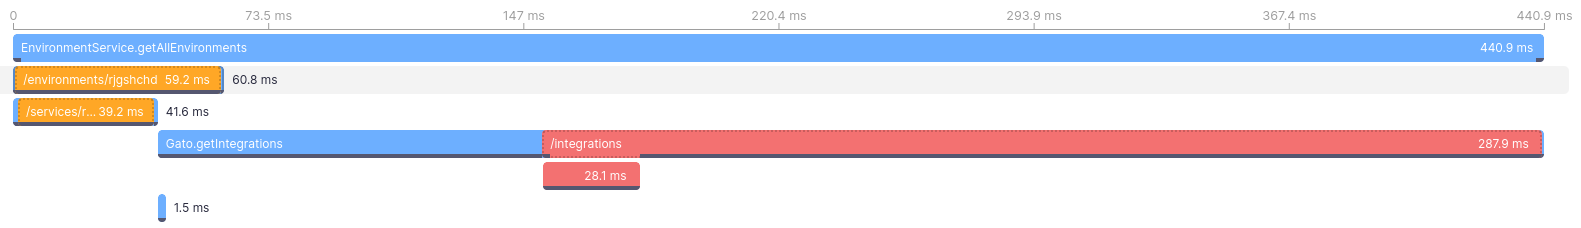
Trace Critical Path #
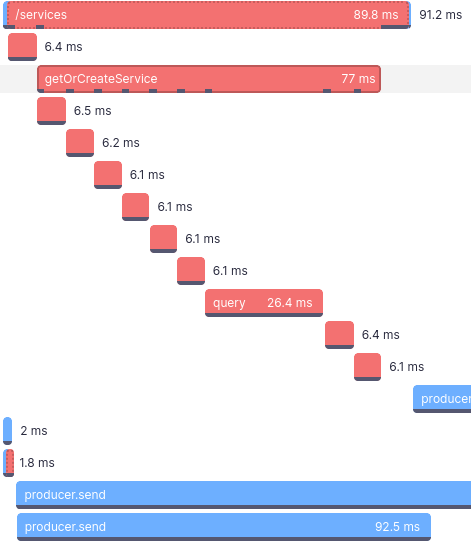
In Kamon APM, we also introduce the concept of a critical path. The critical path are the computations happening in the innermost calls of the call stack. In particular, Kamon APM makes the assumption that when a parent operation calls a child operation, the work is being done inside of the child operation, and the parent is always waiting for the child to complete. In that case, all the critical work is happening in the child operation at this moment. If multiple operations are happening in parallel, and all of them are operations at the very leaves of the call tree, all of them will be in the critical path at the same time.
The critical path in Kamon APM will always be marked by a thick dark line at the bottom of spans.
Span Processing Time #
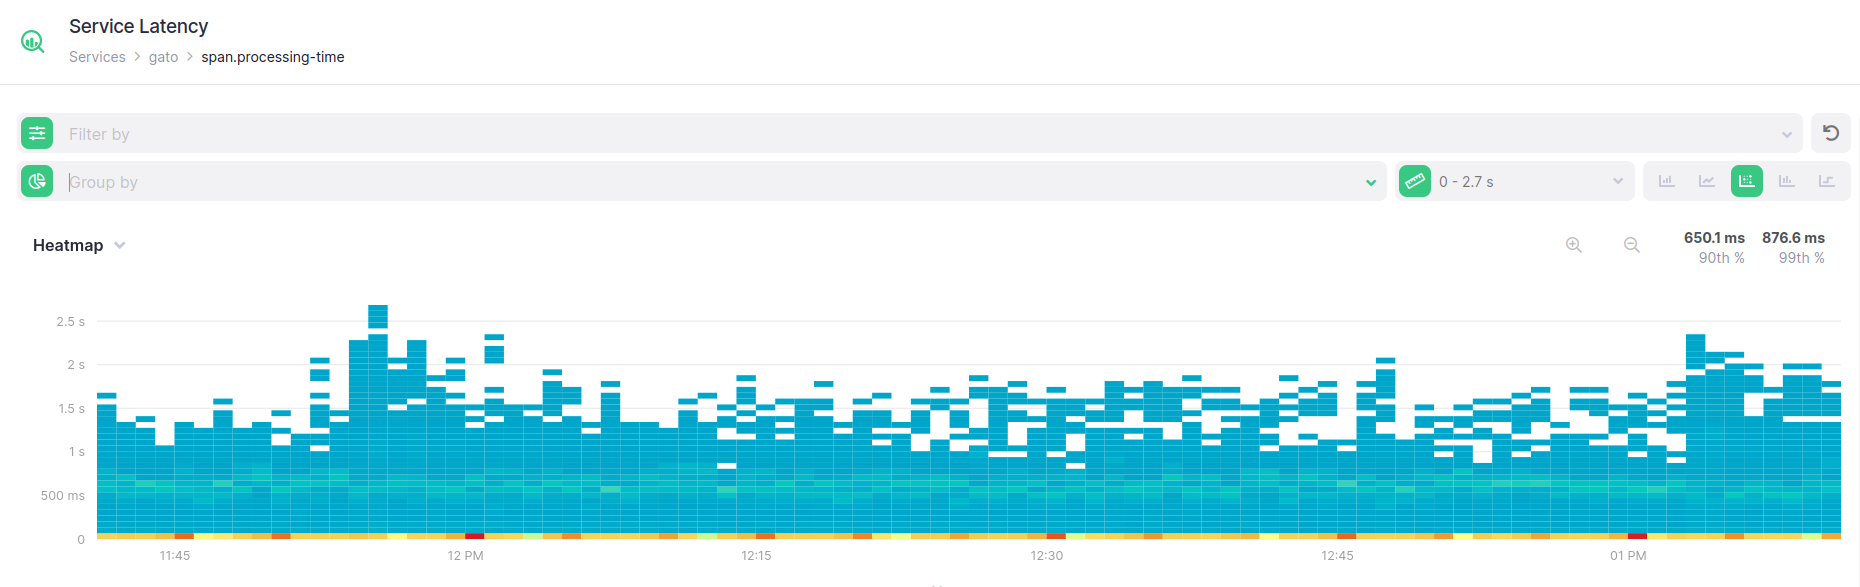
When using Kamon APM with either Kamon Telemetry or OpenTelemetry, Kamon APM will also keep trace of a special metric, called
span.processing-time. This metric represents the distribution of span (operation) durations through time, and can often be a starting point for analyzing
slowdowns and errors. It will be tagged with a number of trace-related metrics, such as the operation, parentOperation, whether an error occurred, and more.
You can read more about deep-diving into analyzing the behavior of this metric and using it to discover issues in the deep dive documentation.
Note that for Kamon Telemetry, span.processing-time values will be recorded and sent even for spans that are not sampled. That means that, depending on
your sampling configuration, you will likely have more processing time metric records in Kamon APM than you will have actual spans.
![]()
If you are using Kamon Telemetry, you will have full control over the metrics tags for span.processing-time. If you are using OpenTelemetry, the metric
is synthetically collected from sampled traces, and might have more limited tags. Additionally, make sure you are sampling all OTEL traces if you want
complete information from Kamon APM.