-
Installation
-
With Kamon Telemetry
-
How To Guides
-
Migrations
-
-
Core Concepts
-
Foundations
-
Advanced
-
-
Instrumentation
-
Supported Frameworks
-
Akka
-
Akka HTTP
-
Cassandra Driver
-
Caffeine
-
Elasticsearch
-
Executors
-
Futures
-
JDBC
-
Kafka
-
Logback
-
Play Framework
-
Spring Framework
-
System Metrics
-
-
-
Reporters
-
Kamon APM
-
Using Kamon APM
-
Overview
-
Services
-
Traces
-
Dashboards
-
Alerts
-
Hosts
-
Investigating Issues
-
Settings and Administration
-
-
New Relic Reporter #
New Relic is a cloud-based platform that gives developers, engineers, operations, and management a clear view of what’s happening in software environments.
Installation #
libraryDependencies += "io.kamon" %% "kamon-newrelic" % "2.5.9"
    <dependency>
      <groupId>io.kamon</groupId>
      <artifactId>kamon-newrelic_2.13</artifactId>
      <version>2.5.9</version>
    </dependency>
implementation 'io.kamon:kamon-newrelic_2.13:2.5.9'
Once the reporter is on your classpath it will be automatically picked up by Kamon, just make sure that you add the New Relic Insert API key for your environment in the configuration:
kamon.newrelic {
    # A New Relic Insights API Insert Key is required to send trace data to New Relic
    # https://docs.newrelic.com/docs/apis/get-started/intro-apis/types-new-relic-api-keys#insert-key-create
    nr-insights-insert-key = ${?INSIGHTS_INSERT_KEY}

    # Change the metric endpoint to the New Relic EU region
    # metric-ingest-uri = https://metric-api.eu.newrelic.com/metric/v1

    # Change the trace endpoint to the New Relic EU region
    # span-ingest-uri = https://trace-api.eu.newrelic.com/trace/v1
}
If you can’t use an environment variable, you can replace the above with the actual key like
nr-insights-insert-key = abc123secretvalue123.
Note: This is less secure and additional precautions must be taken (like considering file permissions and excluding from source control).
Configuration #
The following configuration options are available to add to the kamon.newrelic configuration block.
Override Endpoints #
-
metric-ingest-uri: By default, metrics are sent to the New Relic US region endpoint. You can change the endpoint to send metrics to New Relic’s EU region. See API endpoints for EU region accounts. -
span-ingest-uri: By default, spans are sent to the New Relic US region endpoint. You can change the endpoint to send spans to an Infinite Tracing trace observer endpoint or to New Relic’s EU region. See Infinite Tracing and API endpoints for EU region accounts.
Disable tracing #
To disable tracing, simply comment out span-metrics for the appropriate module.
Teasers #
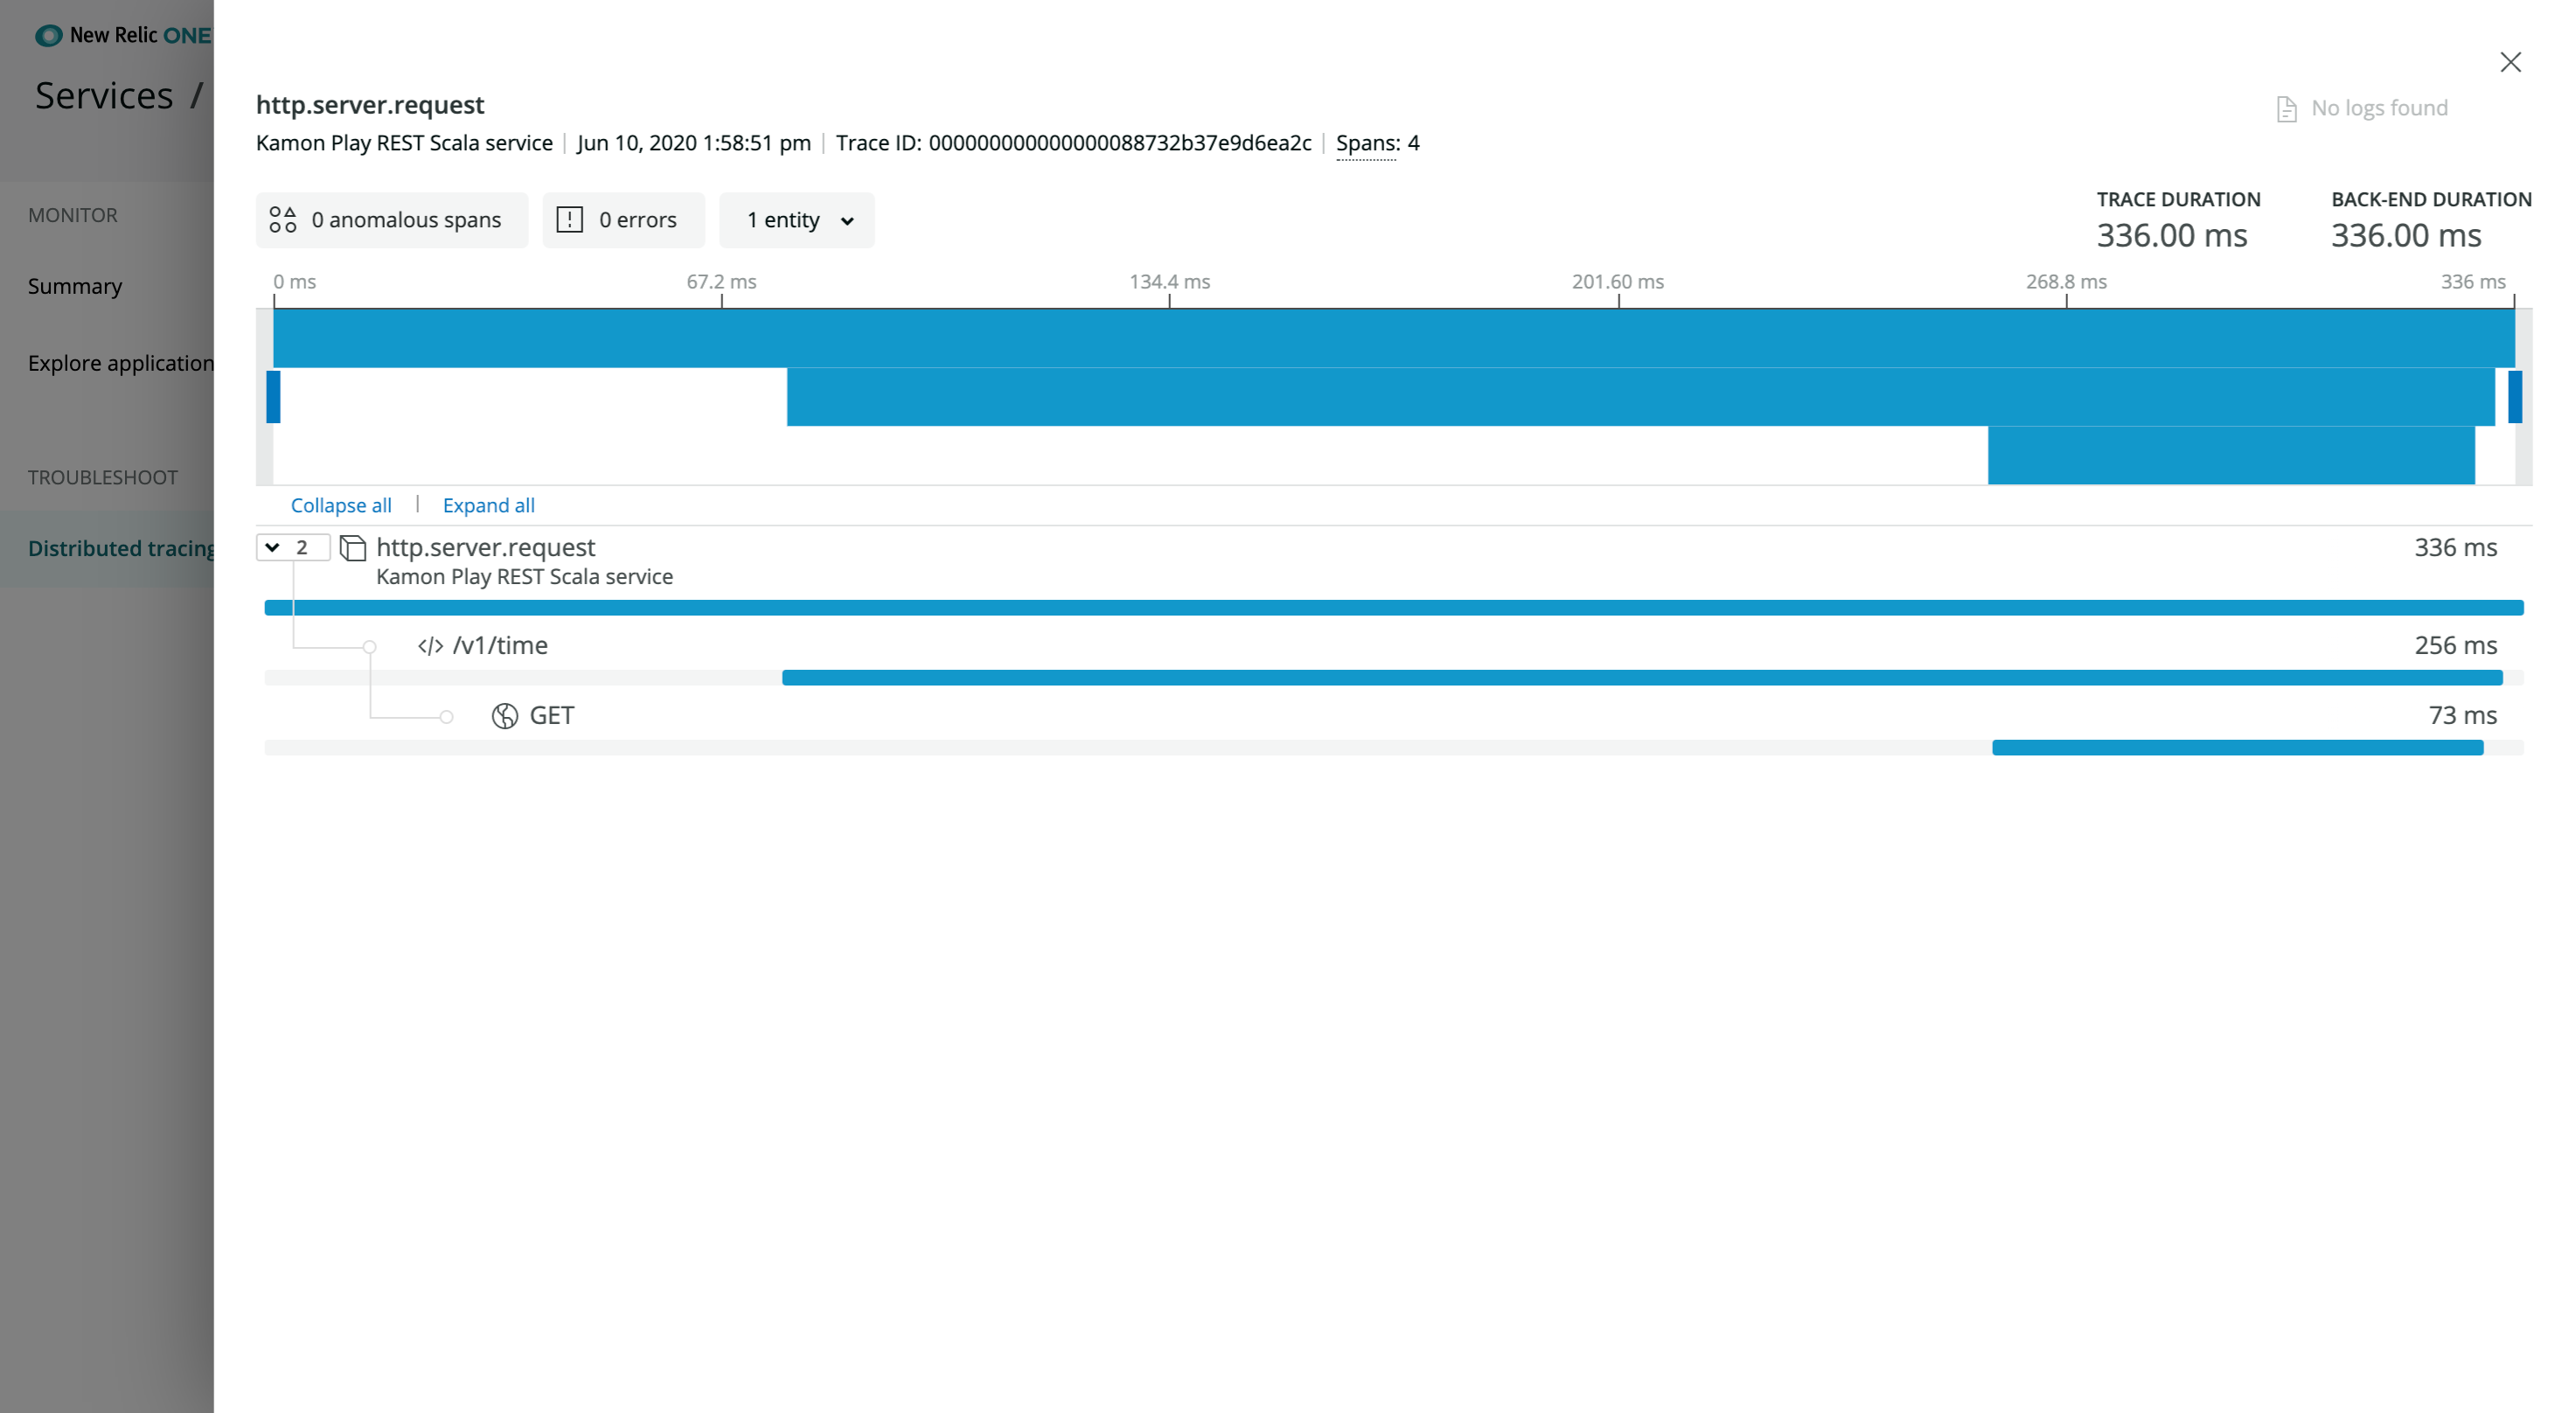
New Relic One distributed tracing provides a tool for visualizing all of your traces so that you can quickly diagnose performance issues:
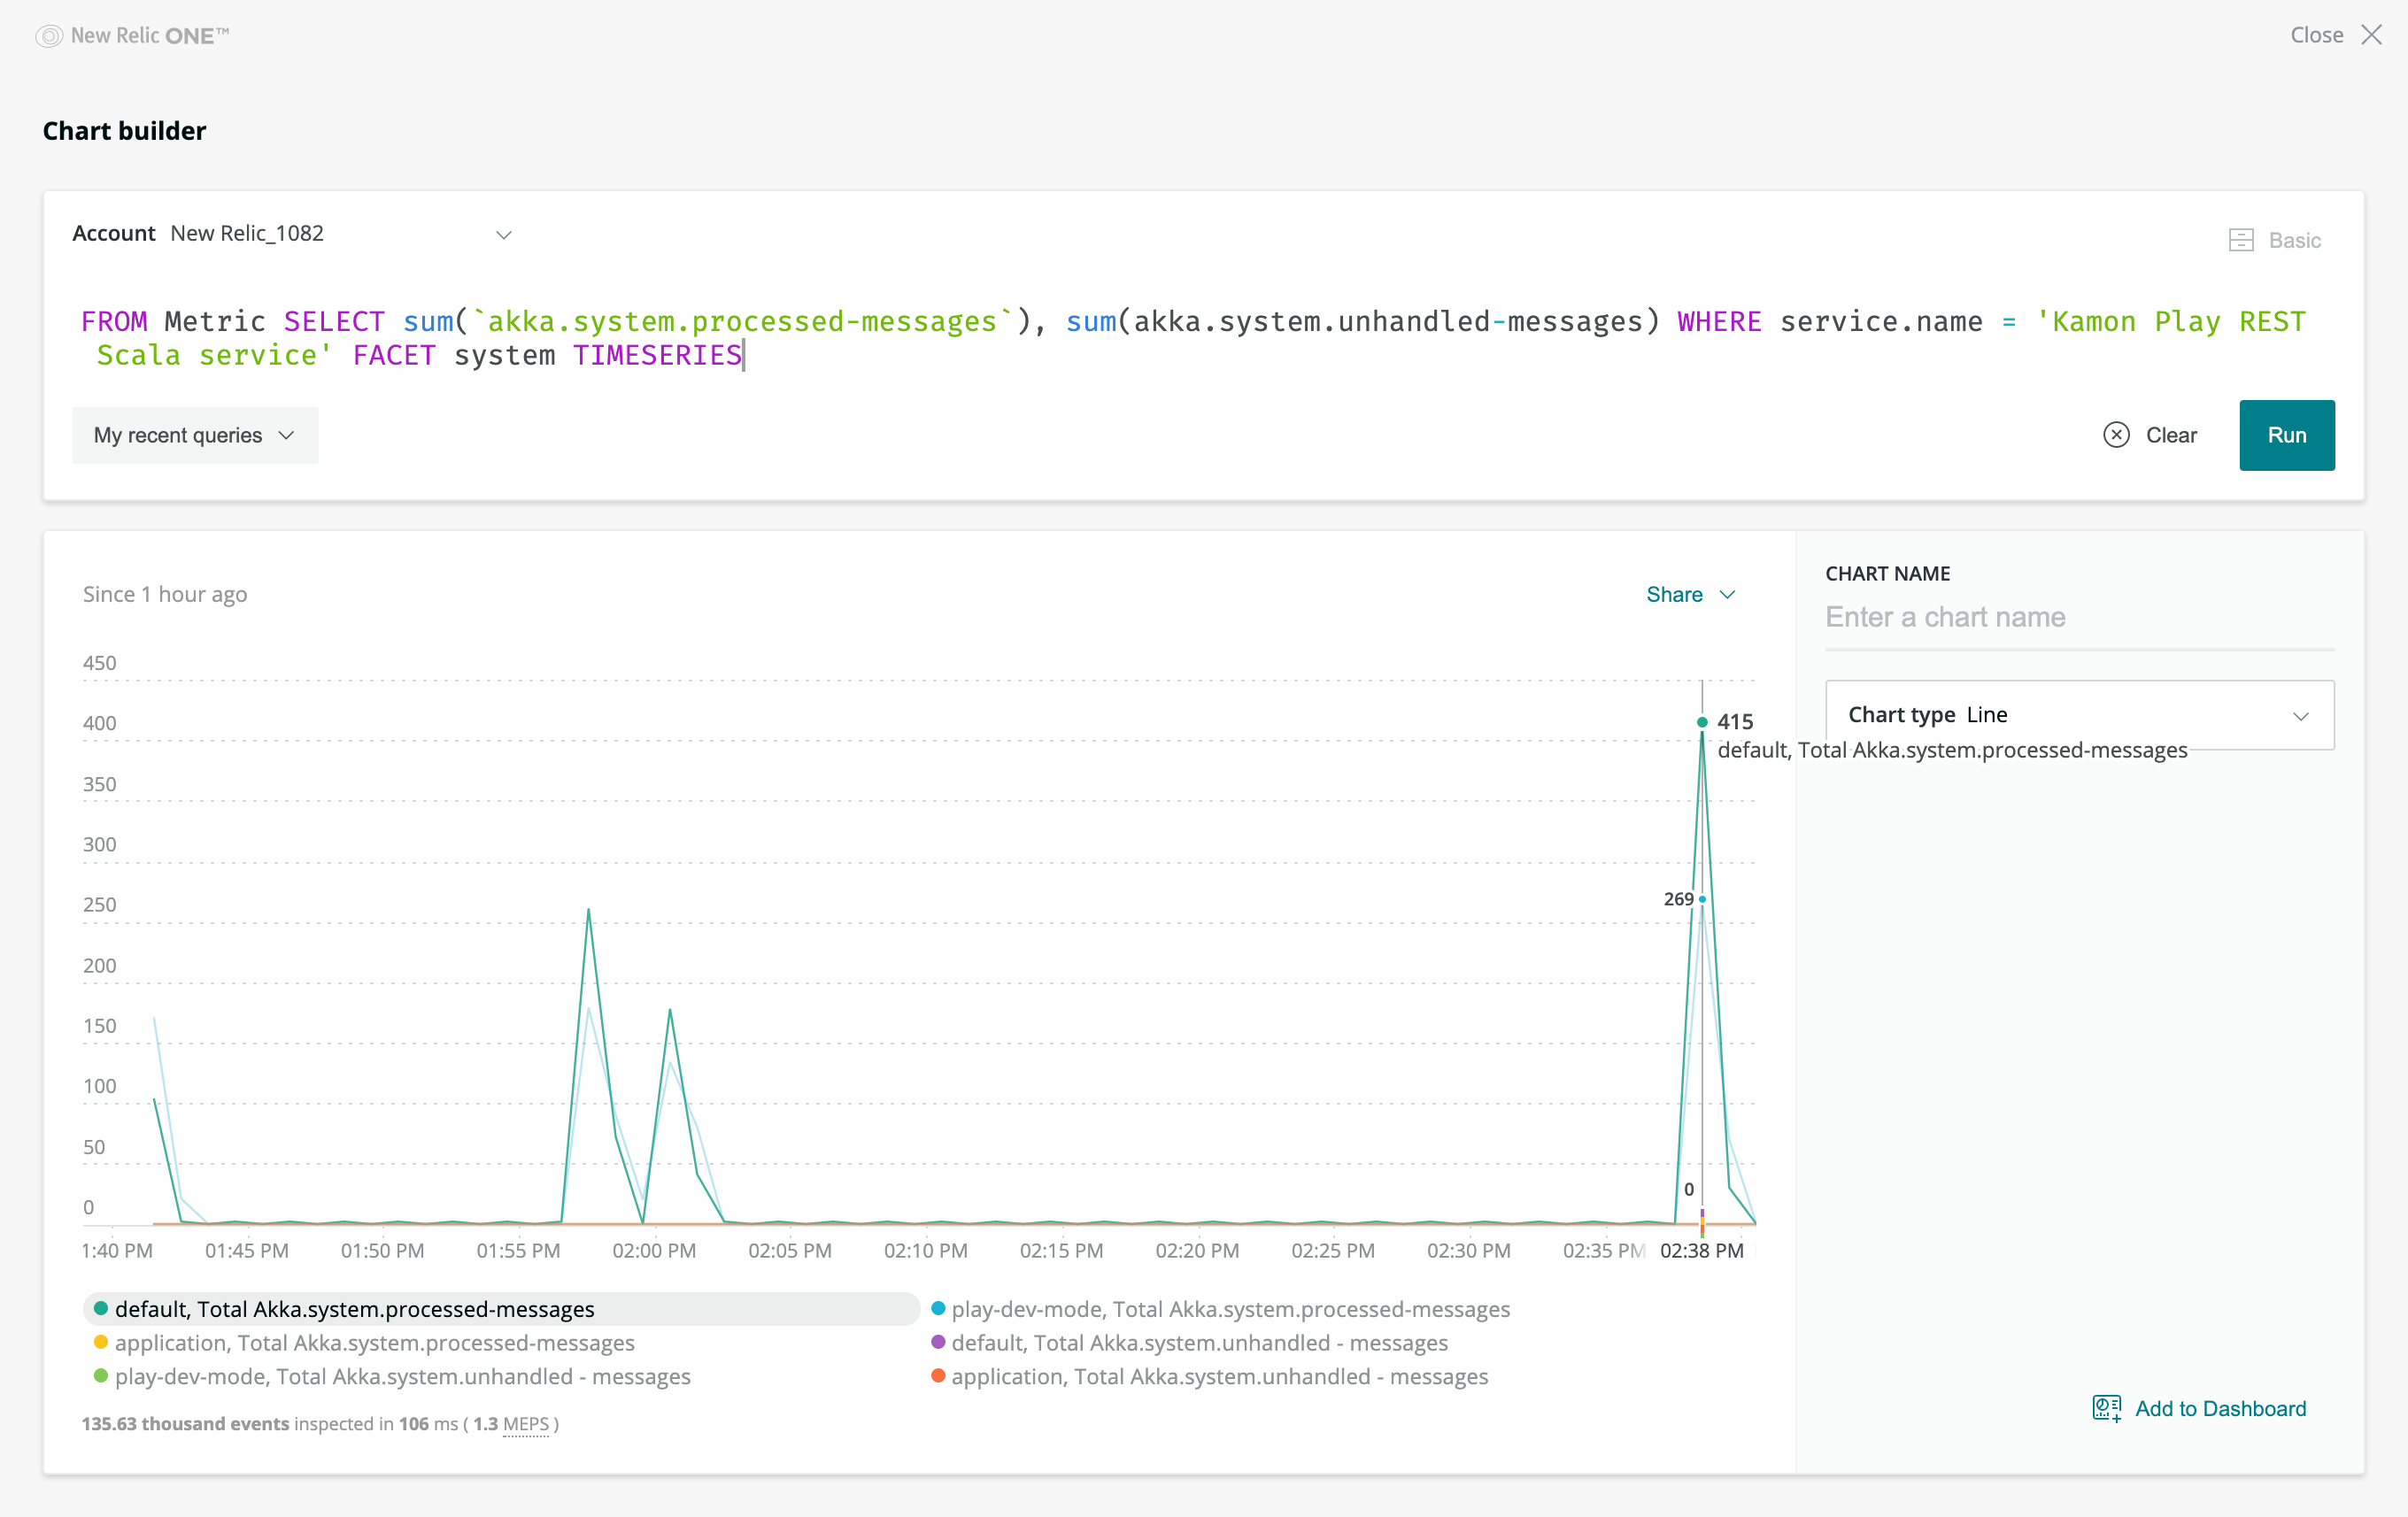
New Relic One dashboards allow you to combine data from anywhere in the New Relic platform, including dimensional metrics and trace data sent by the Kamon New Relic Reporter, to build interactive visualizations. You can explore your data and correlate connected sources with tailored and learn the state of your system and applications for efficient troubleshooting.