-
Installation
-
With Kamon Telemetry
-
How To Guides
-
Migrations
-
-
Core Concepts
-
Foundations
-
Advanced
-
-
Instrumentation
-
Supported Frameworks
-
Akka
-
Akka HTTP
-
Cassandra Driver
-
Caffeine
-
Elasticsearch
-
Executors
-
Futures
-
JDBC
-
Kafka
-
Logback
-
Play Framework
-
Spring Framework
-
System Metrics
-
-
-
Reporters
-
Kamon APM
-
Using Kamon APM
-
Overview
-
Services
-
Traces
-
Dashboards
-
Alerts
-
Hosts
-
Investigating Issues
-
Settings and Administration
-
-
Kamon APM Reporter #
Kamon APM is a hosted monitoring and debugging platform for microservices, designed from the ground up with one goal in mind: accept all the metrics and tracing data exactly as Kamon records it, no averages, no summaries, no downsampling, no data quality loss. Having the entire data that Kamon captures means proper aggregation of data across instances and proper percentiles calculation, which translates into better, accurate and relevant alerts and insight on your application’s behavior.
Installation #
libraryDependencies += "io.kamon" %% "kamon-apm-reporter" % "2.5.9"
    <dependency>
      <groupId>io.kamon</groupId>
      <artifactId>kamon-apm-reporter_2.13</artifactId>
      <version>2.5.9</version>
    </dependency>
implementation 'io.kamon:kamon-apm-reporter_2.13:2.5.9'
Once the reporter is on your classpath it will be automatically picked up by Kamon, just make sure that you add the API key for your environment in the configuration:
kamon {
  environment {
    service = "my-service-name"
  }

  apm {
    api-key = "abcdefghijklmnopqrstuvwxyz"
  }
}
Also, as seen above, you might want to change the default service name to reflect the name that you want to see displayed in Kamon APM.
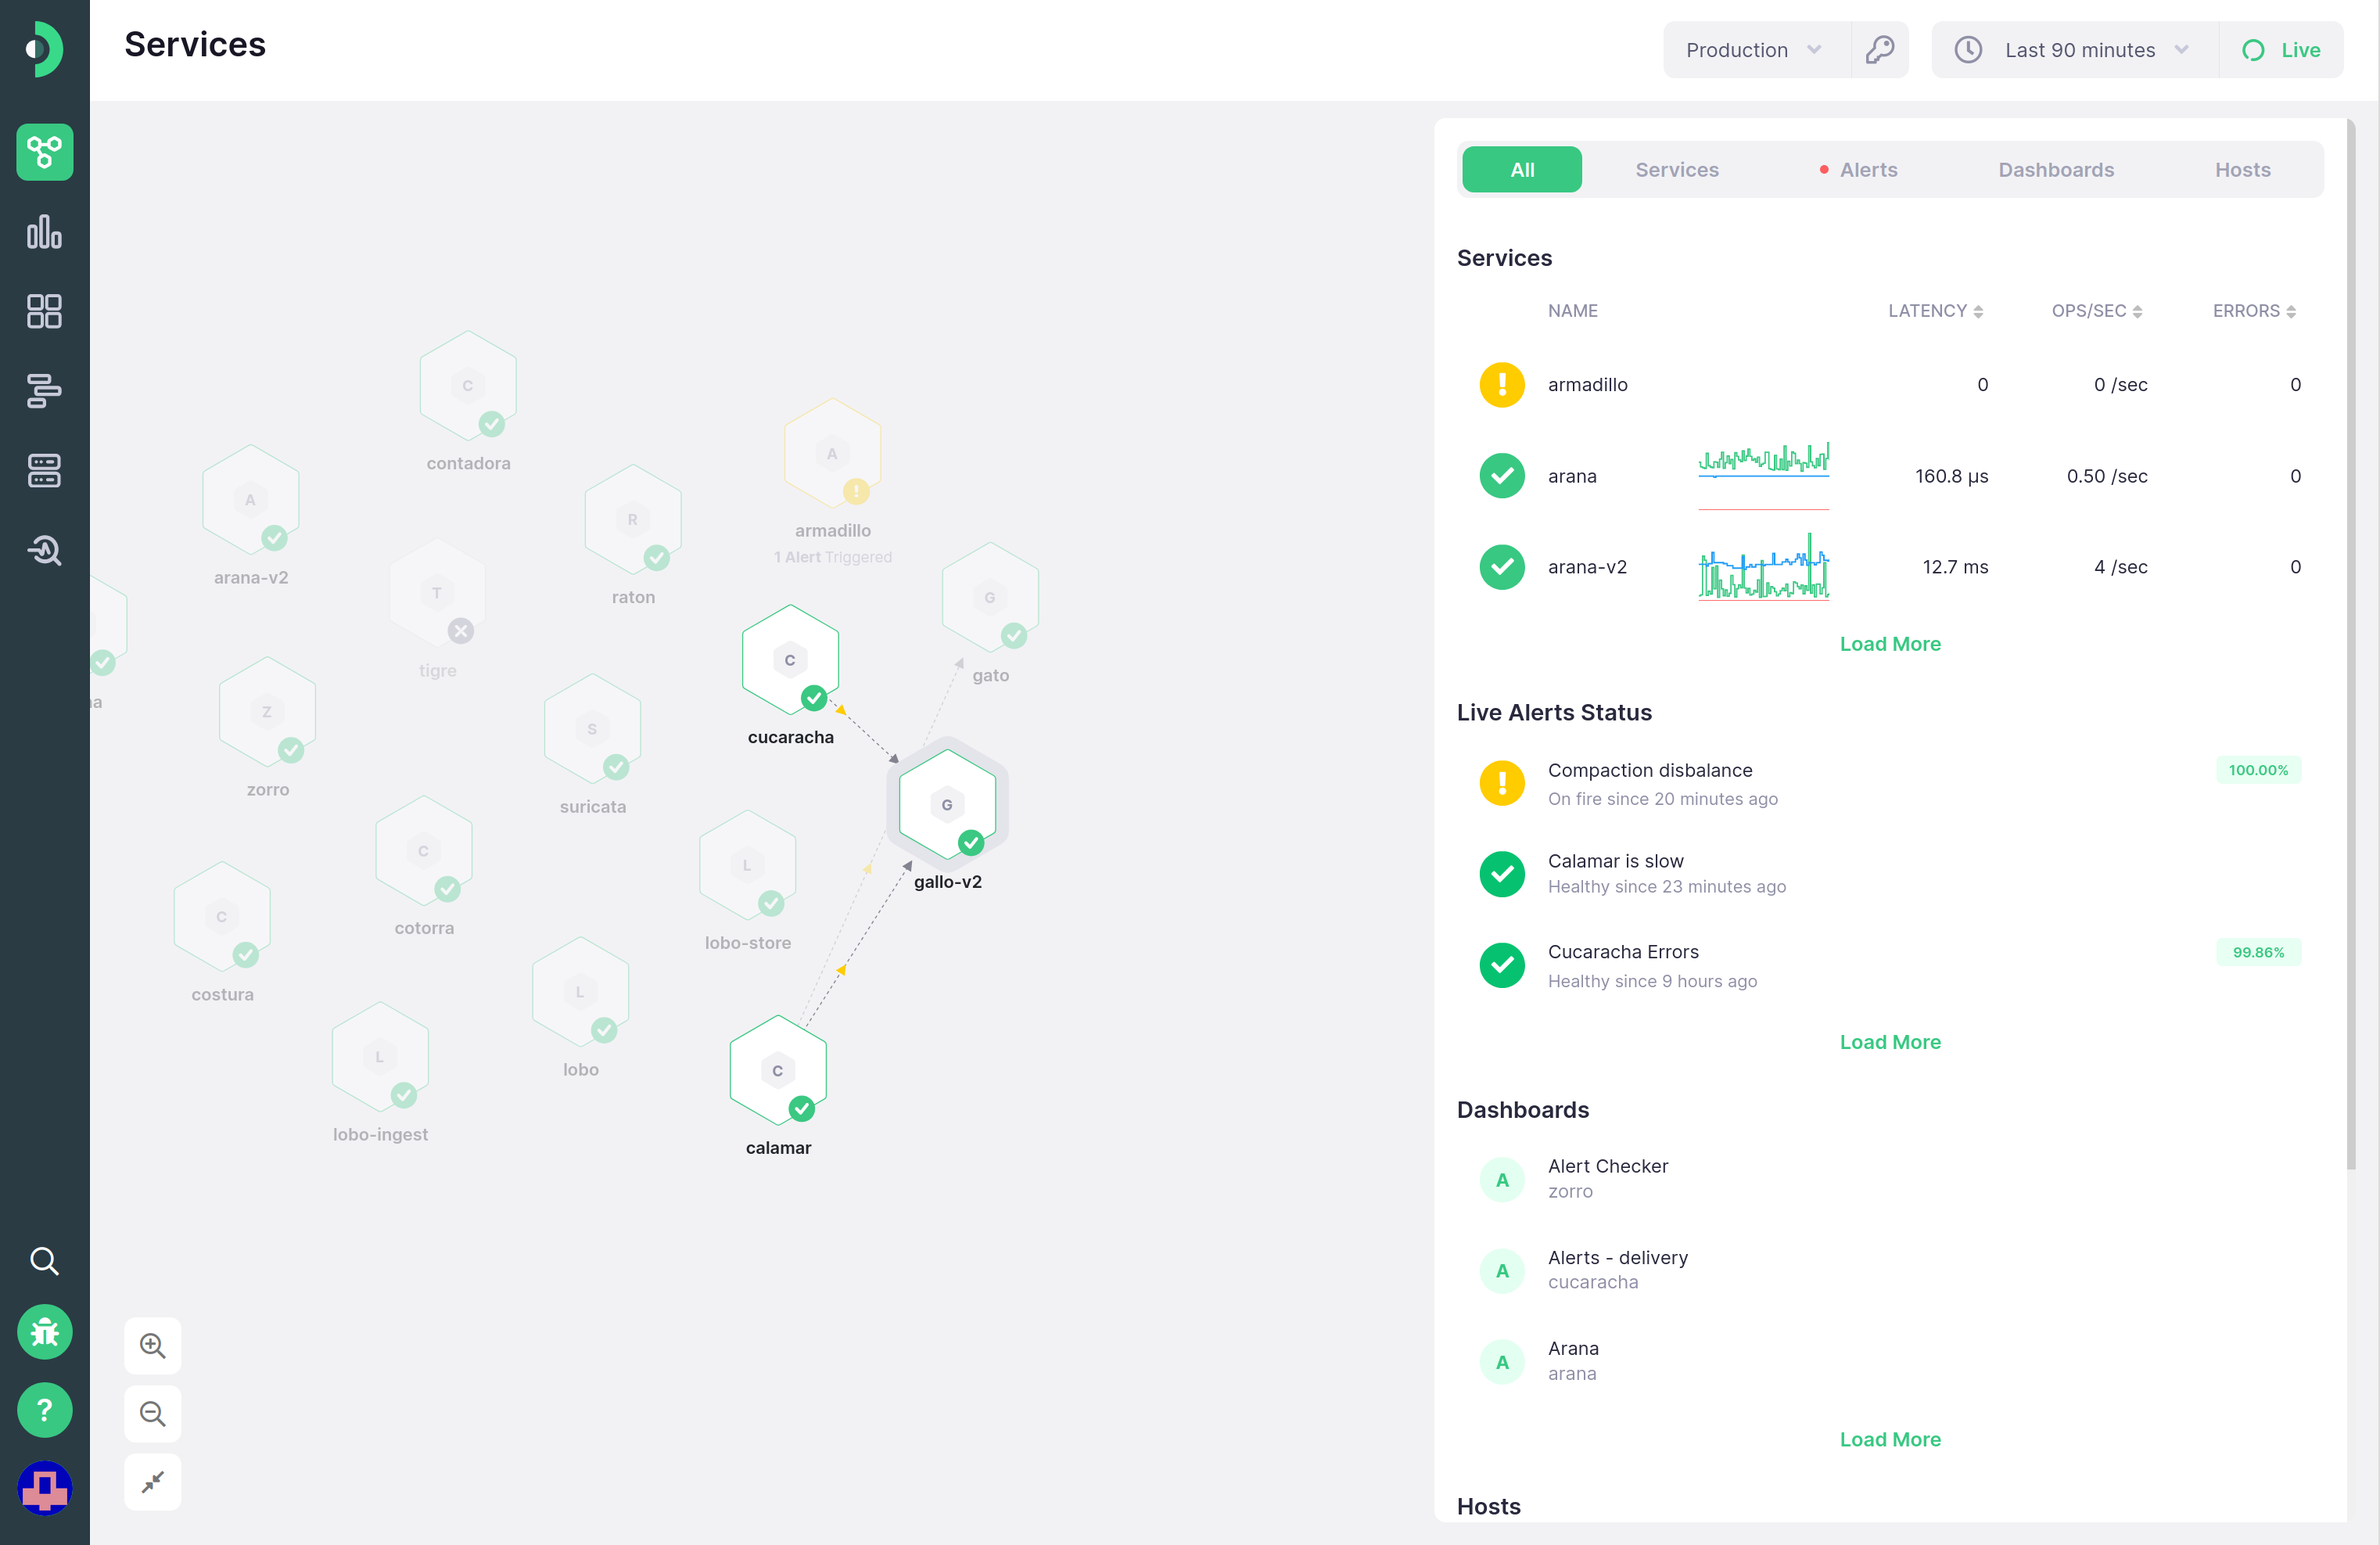
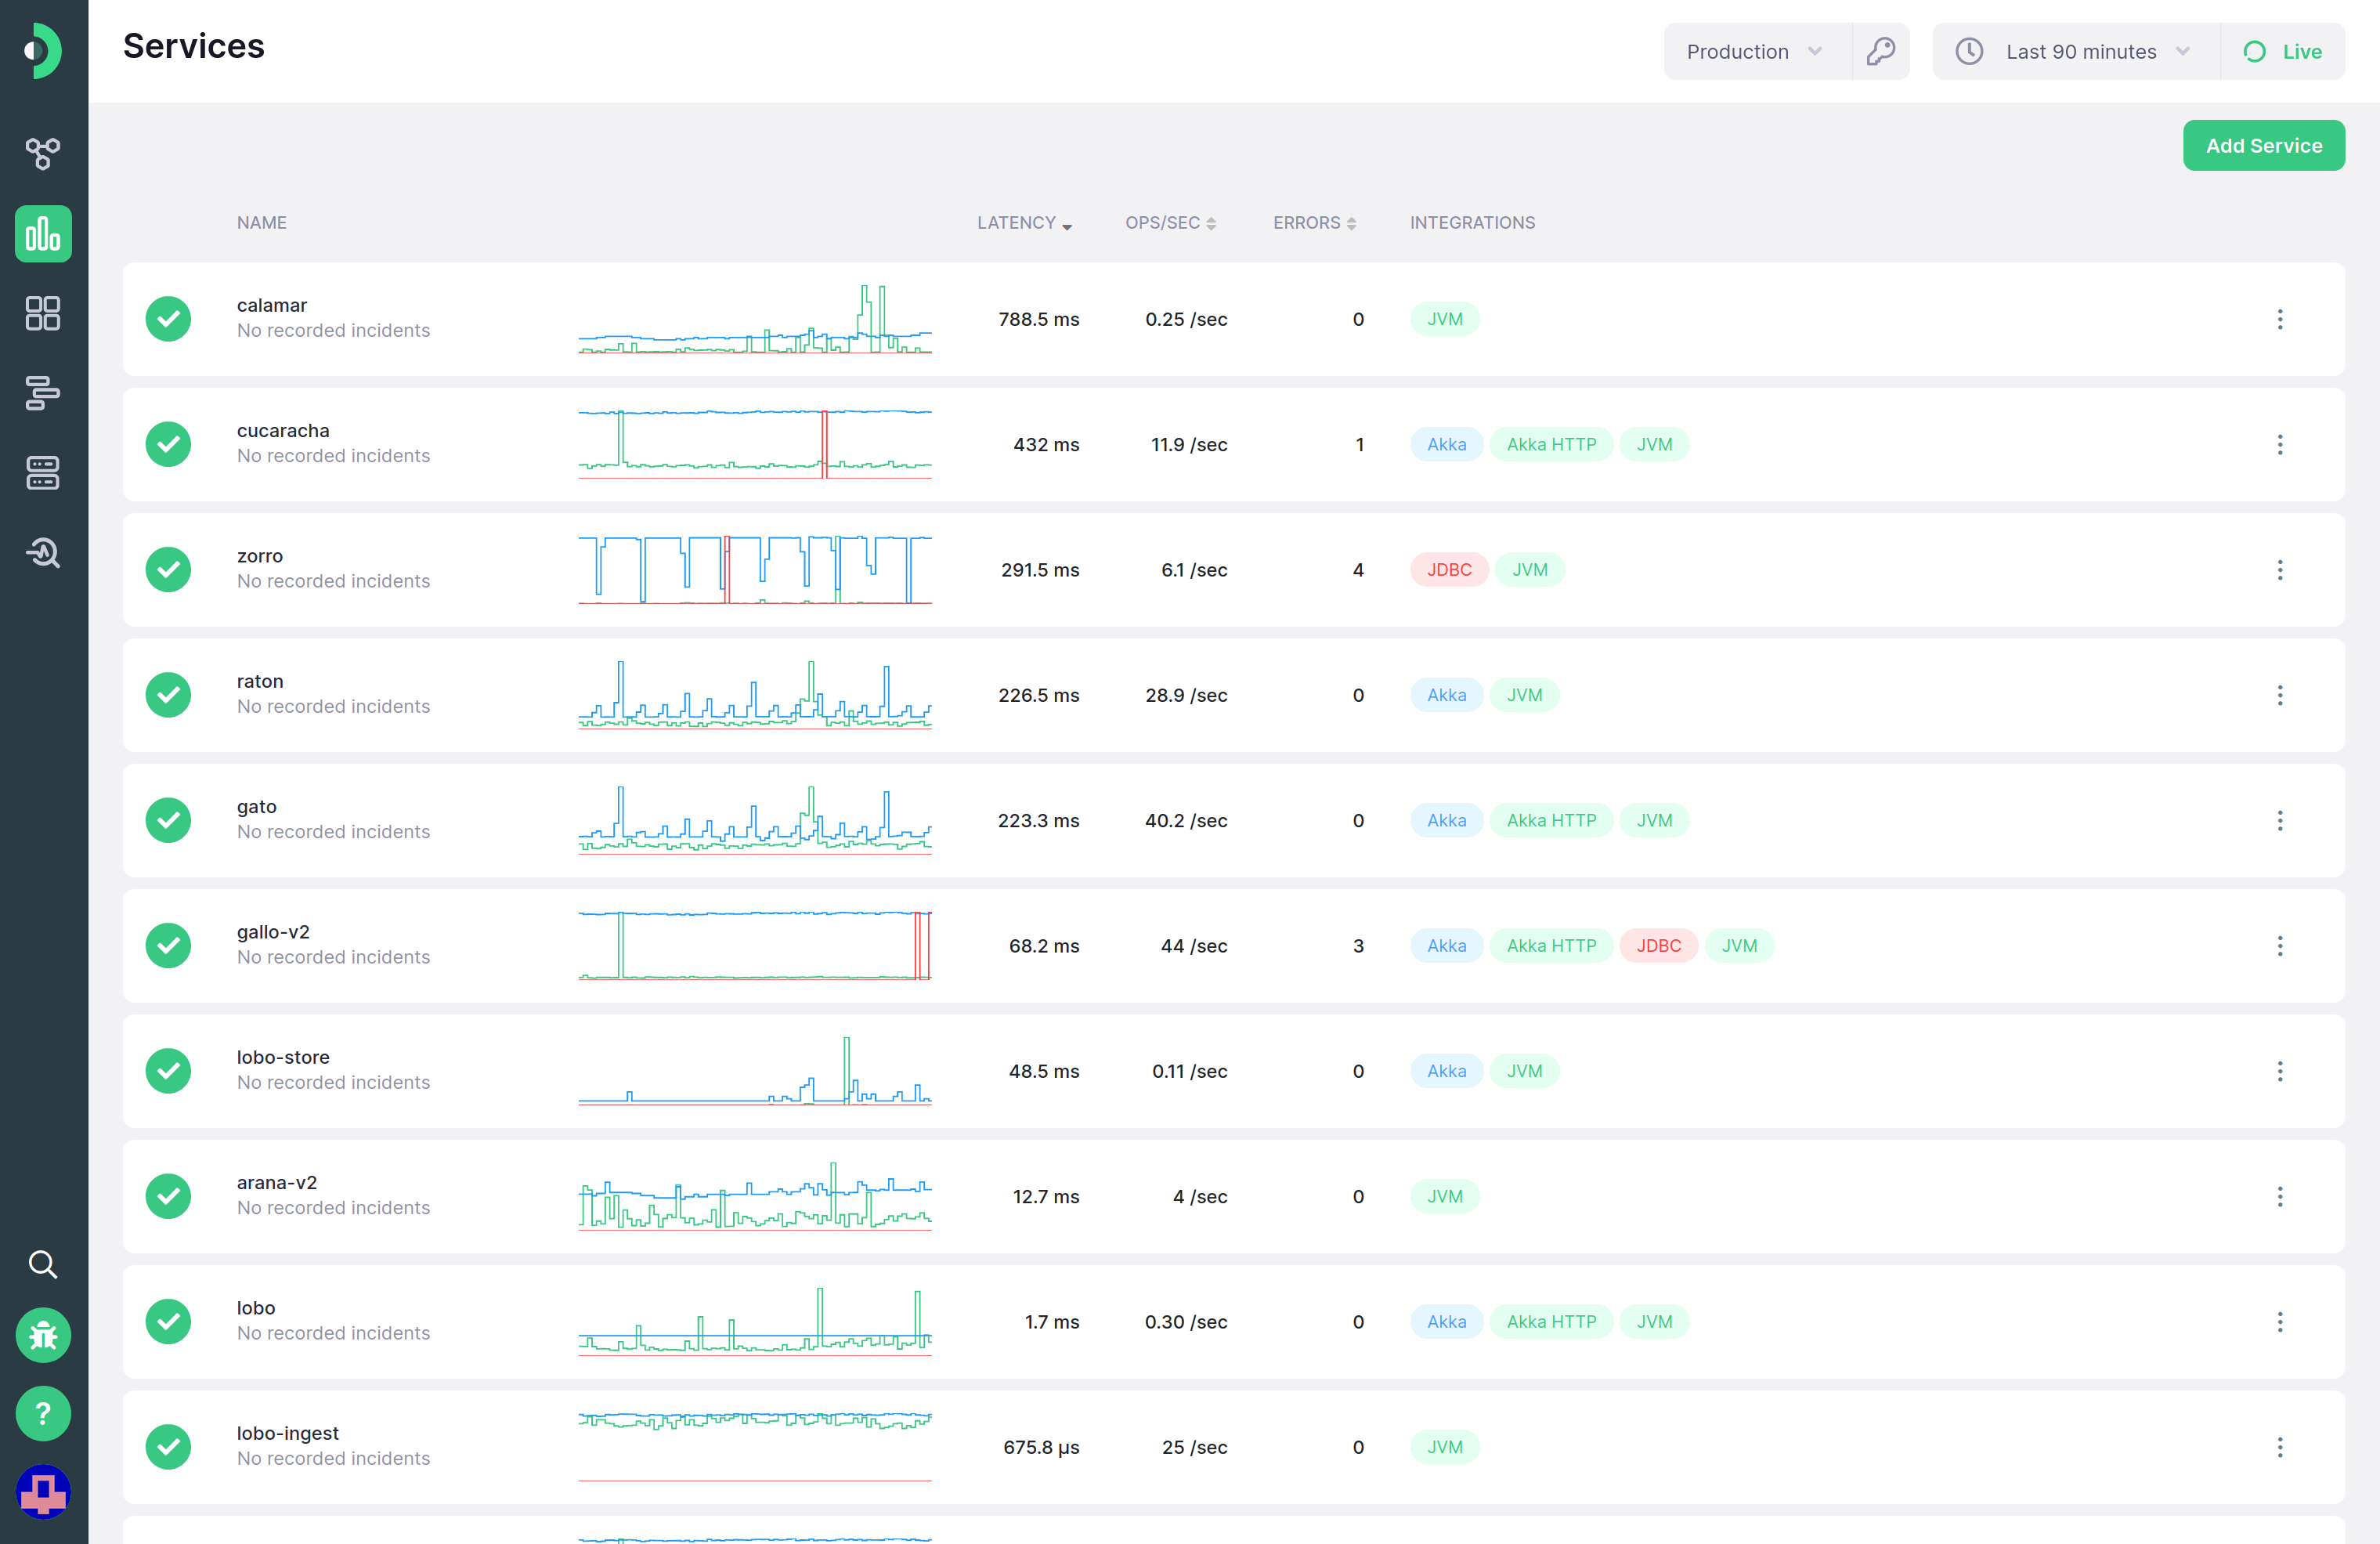
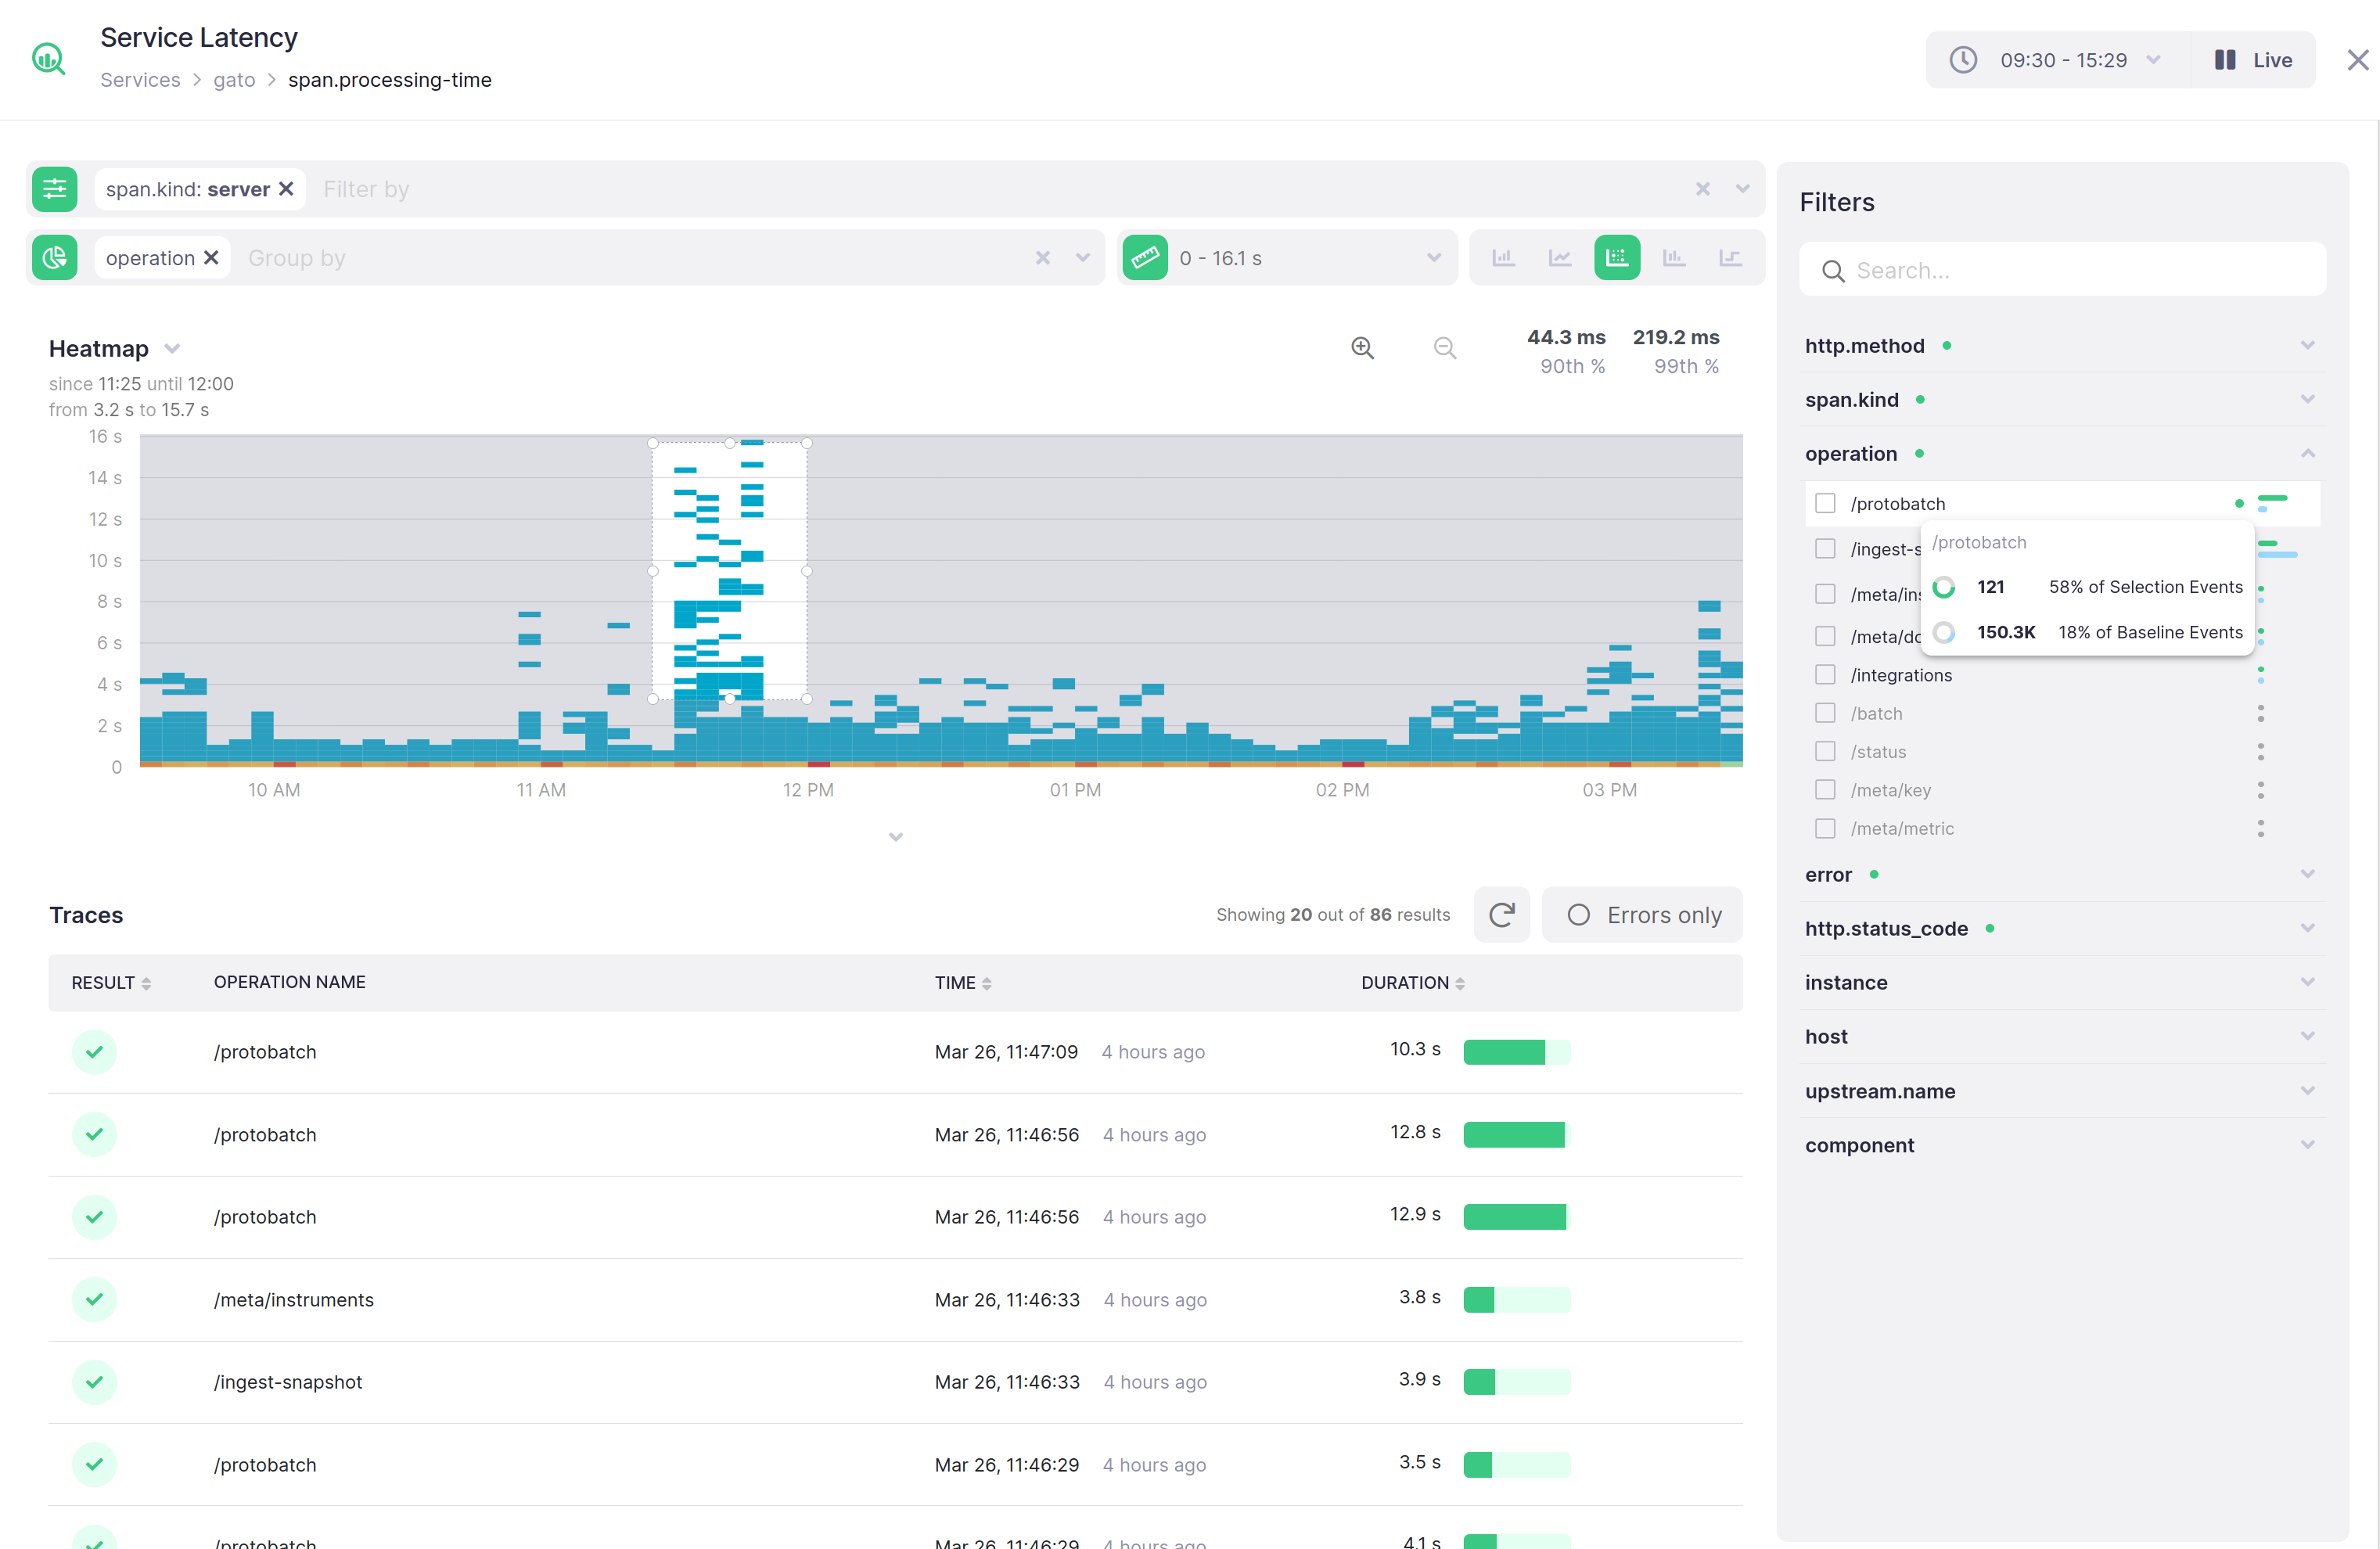
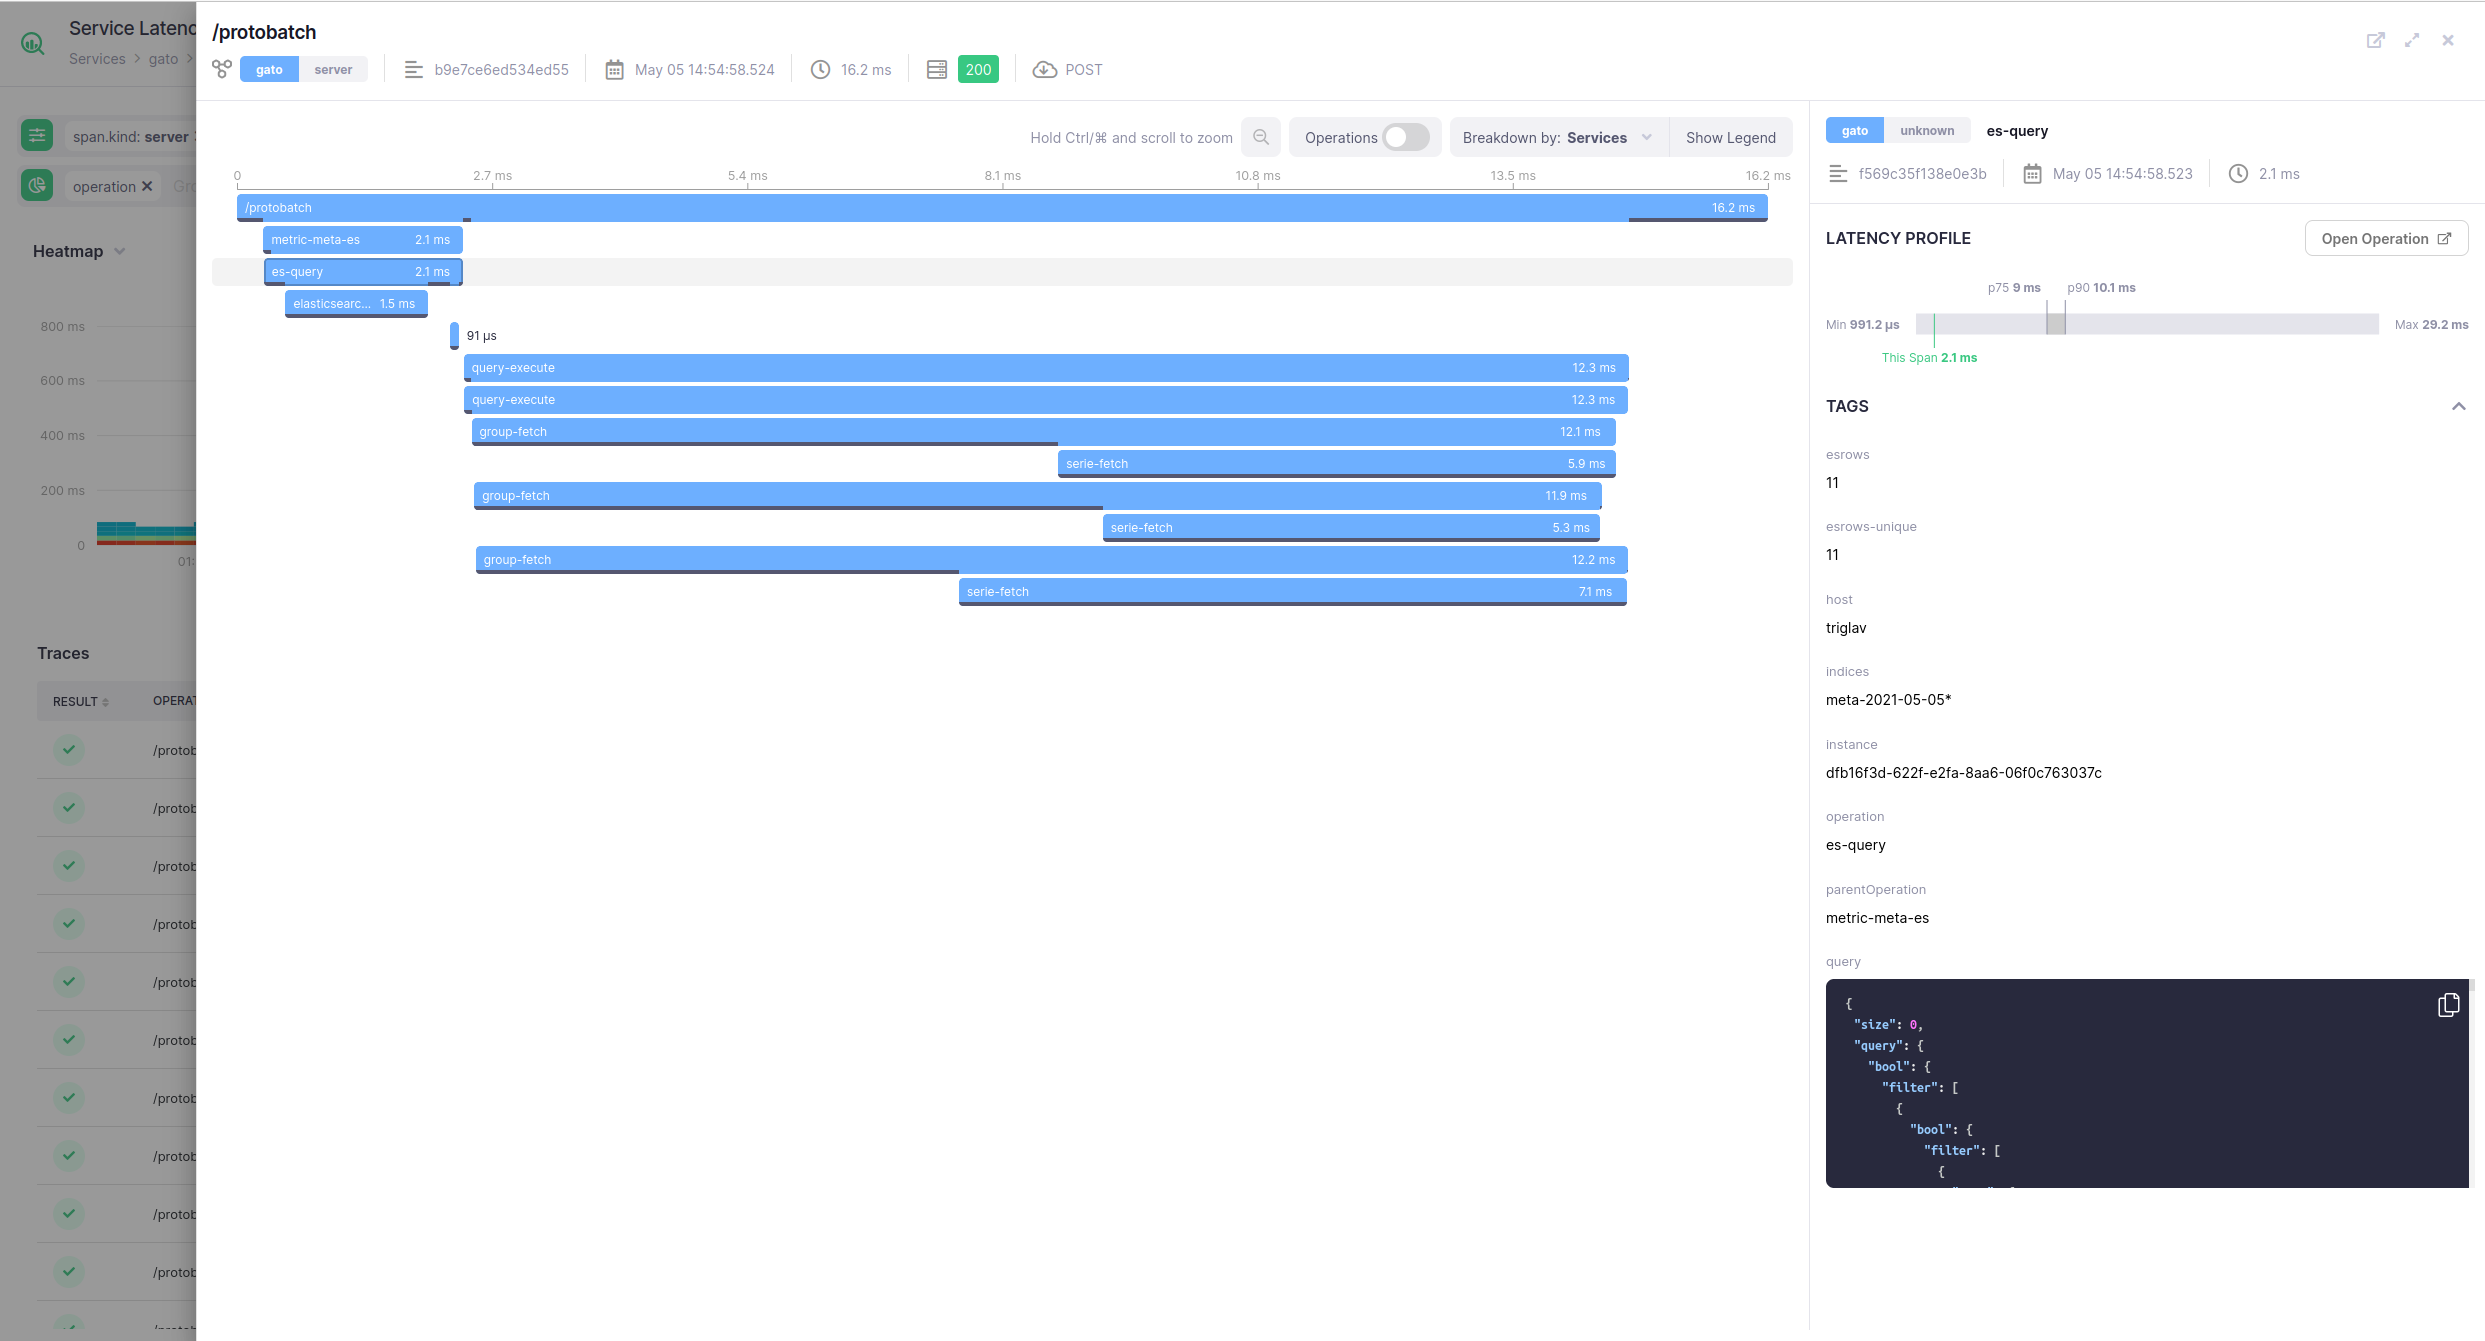
Teasers #
Kamon APM has a deep understanding on all metrics reported by Kamon and provides ready to use dashboards that make it super easy to start looking at service, JVM, Hosts, Akka-related metrics, Traces and more. Here are some examples from a demo application: