-
Installation
-
With Kamon Telemetry
-
How To Guides
-
Migrations
-
-
Core Concepts
-
Foundations
-
Advanced
-
-
Instrumentation
-
Supported Frameworks
-
Akka
-
Akka HTTP
-
Cassandra Driver
-
Caffeine
-
Elasticsearch
-
Executors
-
Futures
-
JDBC
-
Kafka
-
Logback
-
Play Framework
-
Spring Framework
-
System Metrics
-
-
-
Reporters
-
Kamon APM
-
Using Kamon APM
-
Overview
-
Services
-
Traces
-
Dashboards
-
Alerts
-
Hosts
-
Investigating Issues
-
Settings and Administration
-
-
Service Details #
Kamon APM is built with the idea of understanding the metrics sent by Kamon Telemetry and automatically providing some insights for you. If you use it with JVM, JDBC drivers or Akka, various integrations will be available to you out of the box. On top of that, any service that has server spans will have pre-rolled dashboards to track your general service performance and a per-operation breakdown of calls to your server.
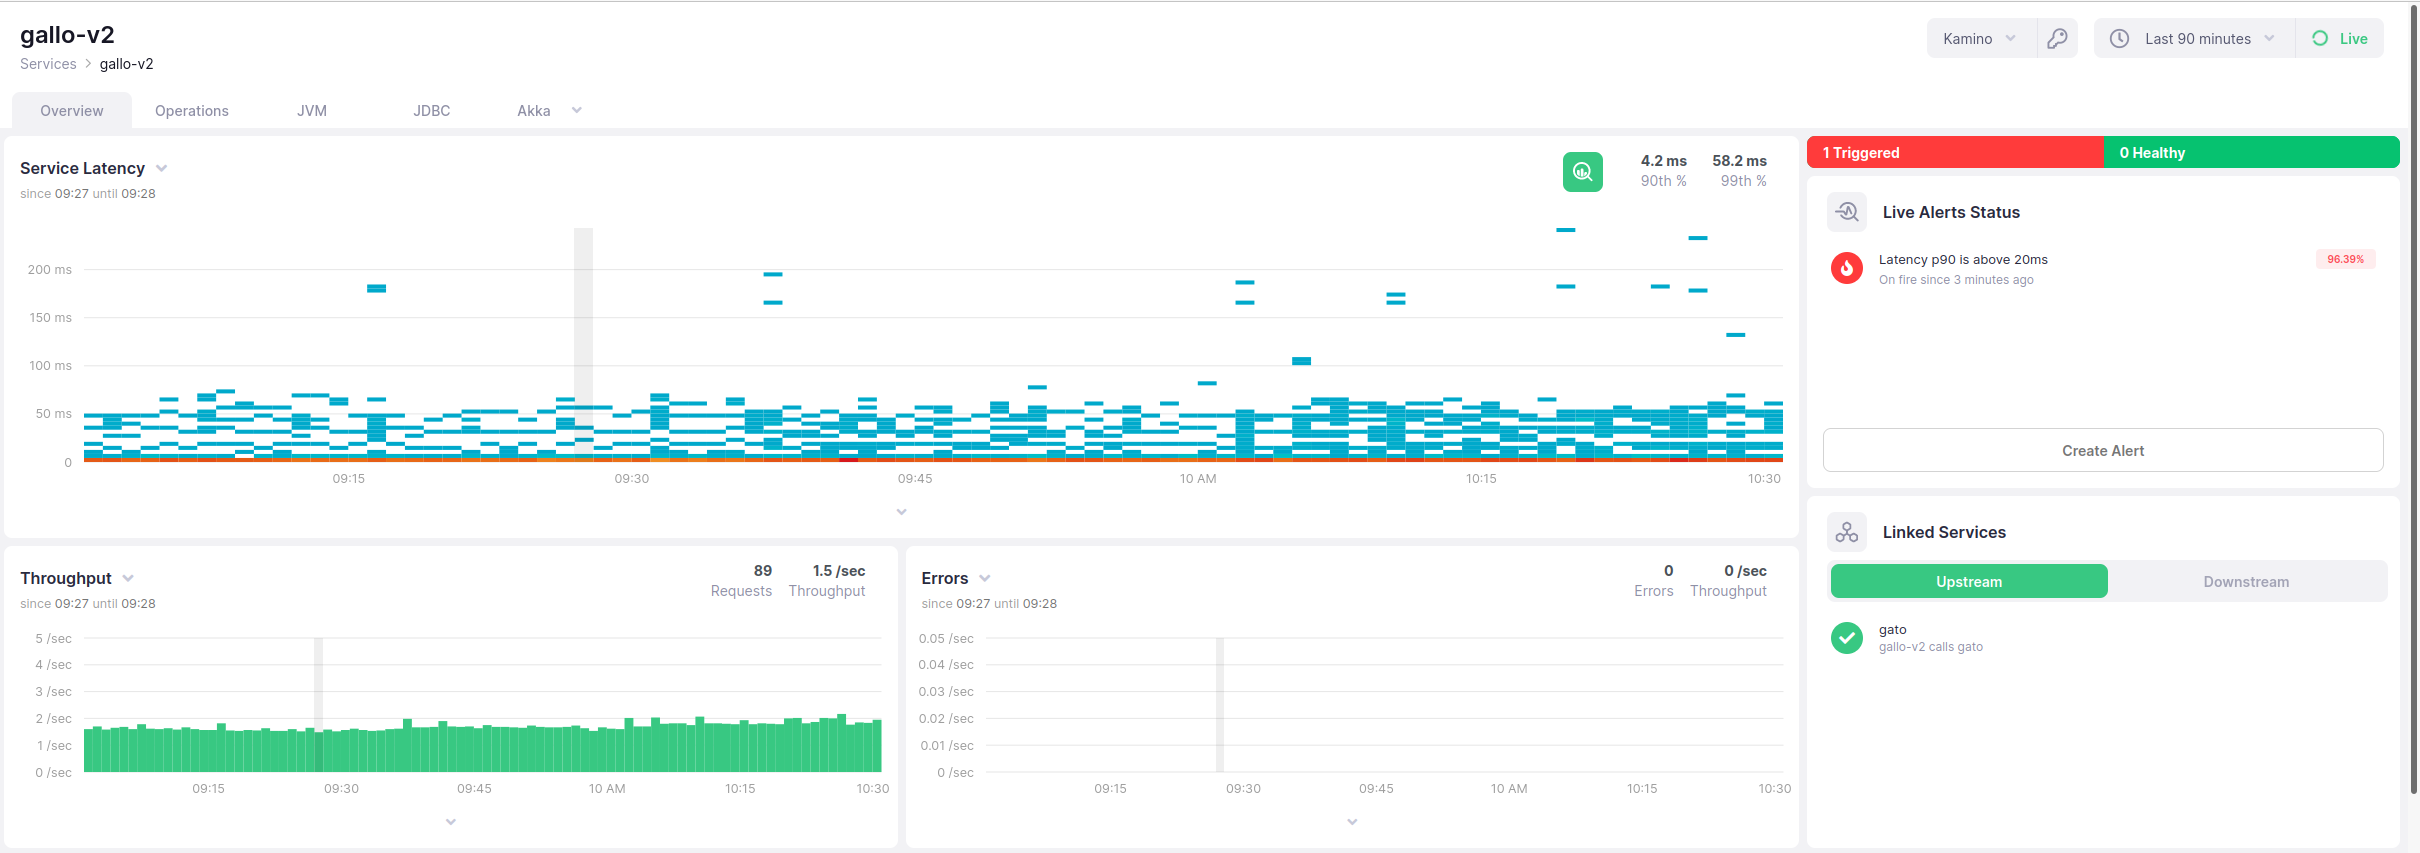
Service Overview #
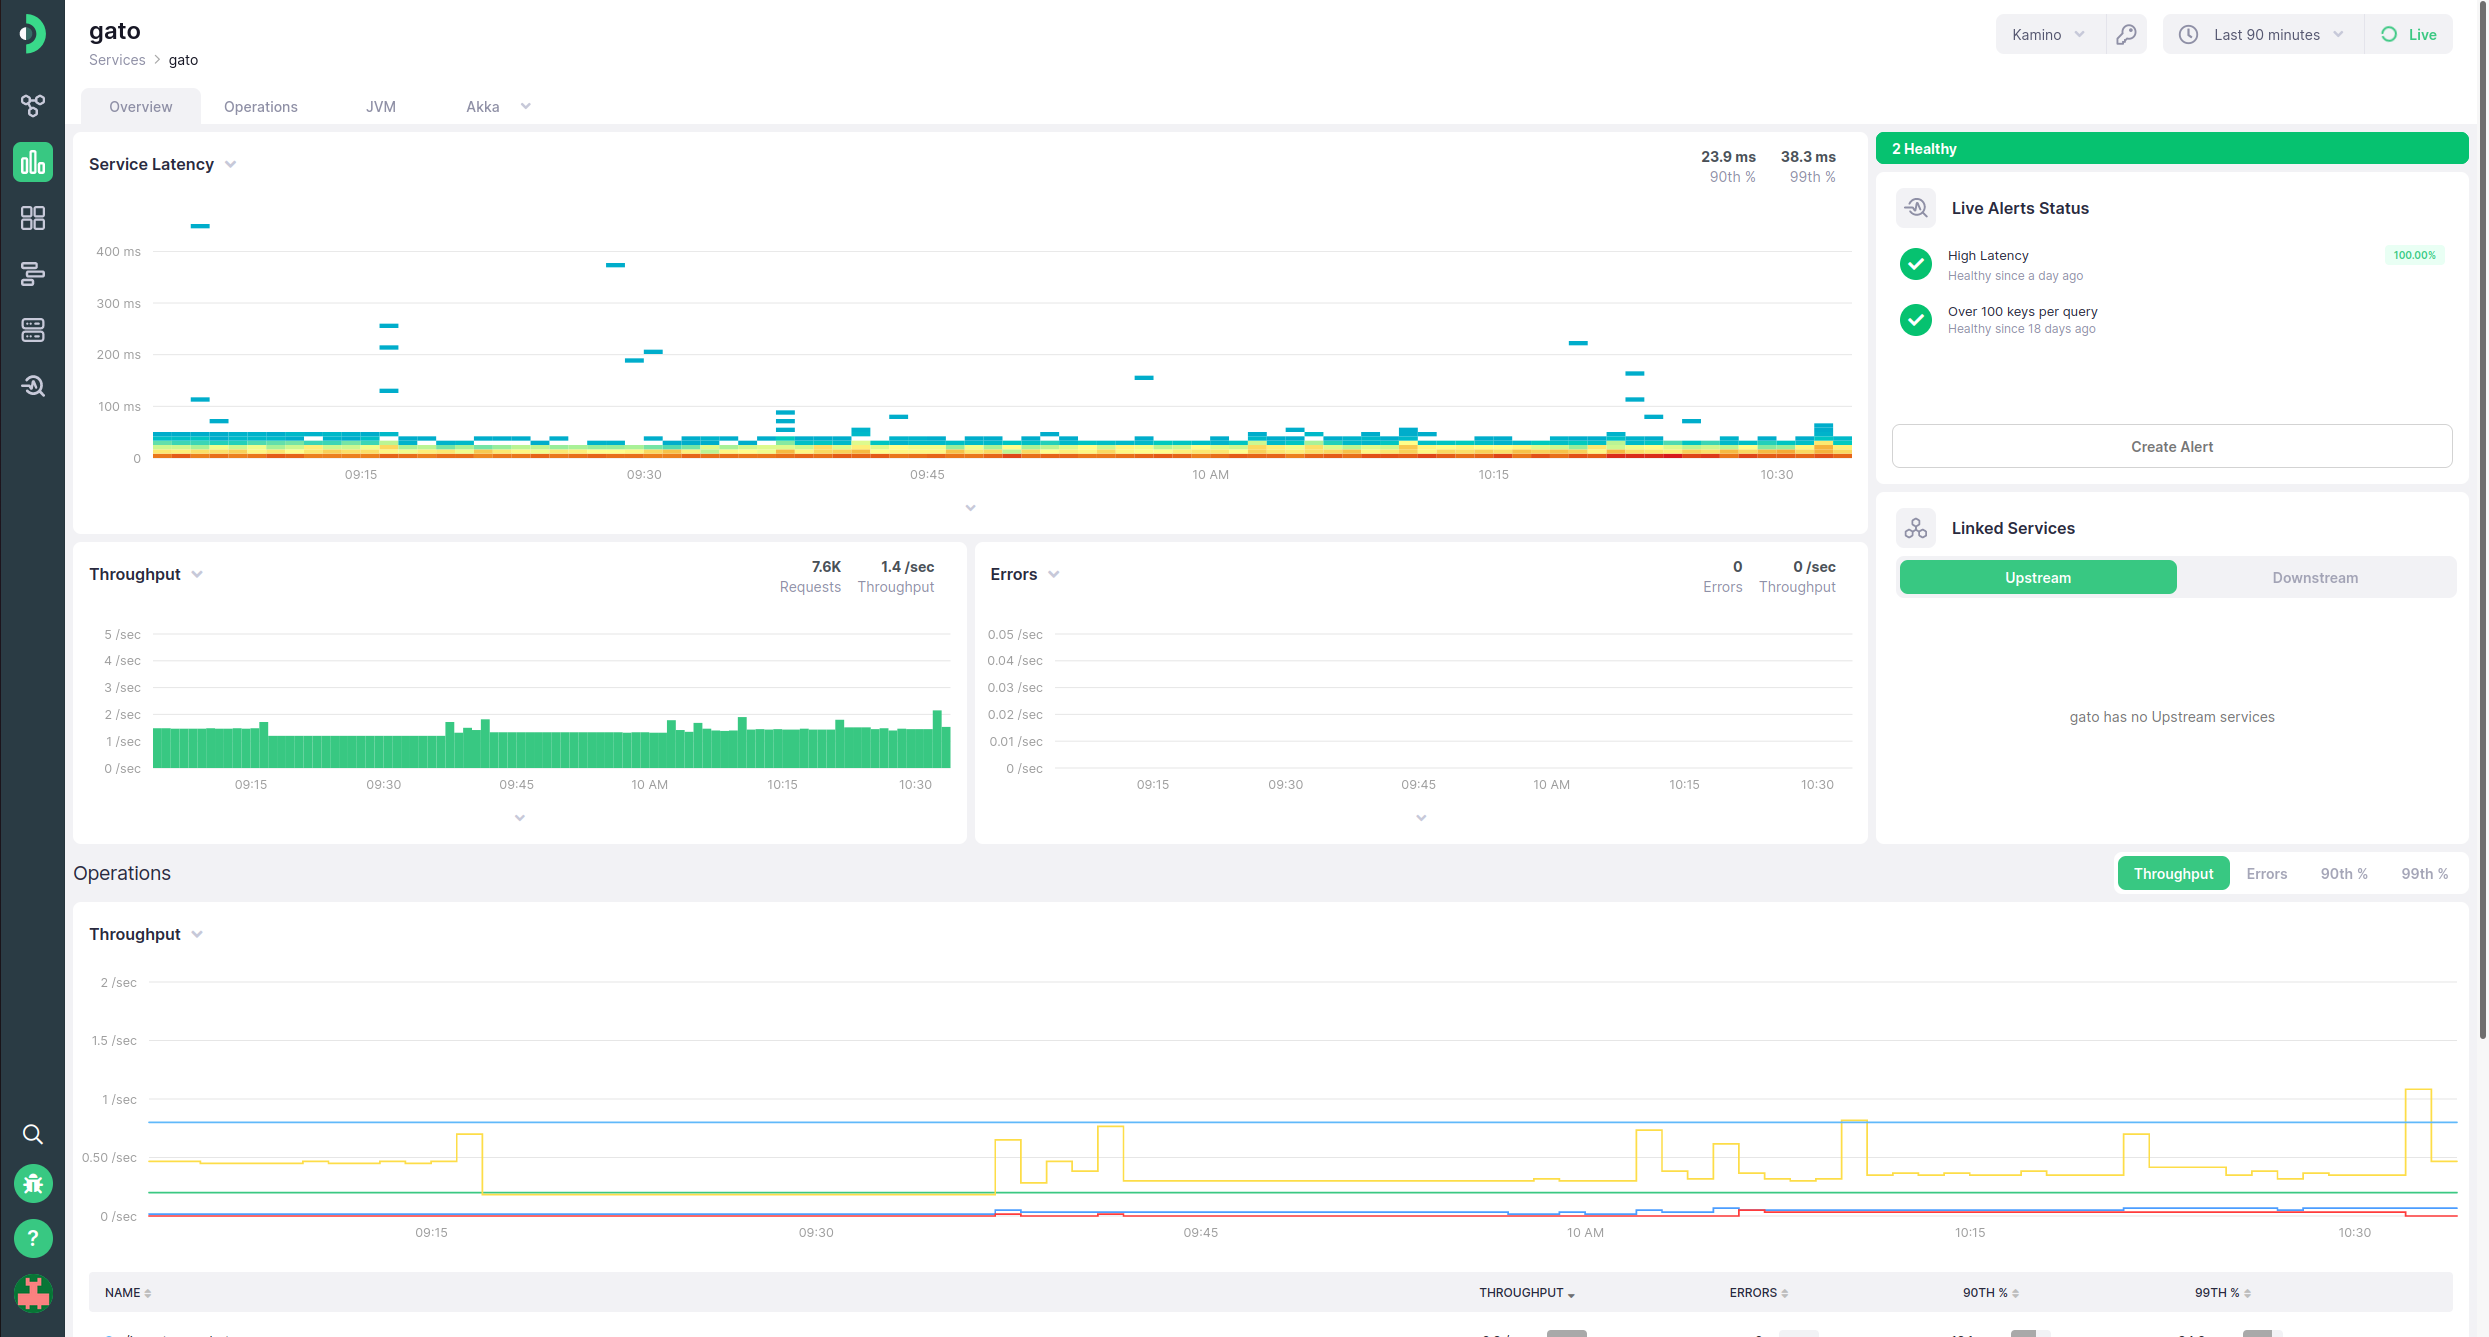
Every service instrumented with either Kamon Telemetry or OpenTelemetry will have a Service Overview page. This page presents you with a quick overview of the state of your service as a server. It can be split up into several main areas: the charts, the server operations table, and the sidebar.
Service Overview Charts #
Each Service Overview page has three charts: a service latency heatmap, the service throughput, and the service error throughput. Using these charts, you can see the general state of your service at a glance, as well as starting a deep dive into issues using the analyze button. Note that these charts are only showing server spans (i.e., where span kind is server), which correspond to processed requests from the outside using some standard protocol (e.g., via HTTP or gRPC).
Server Operations Table #
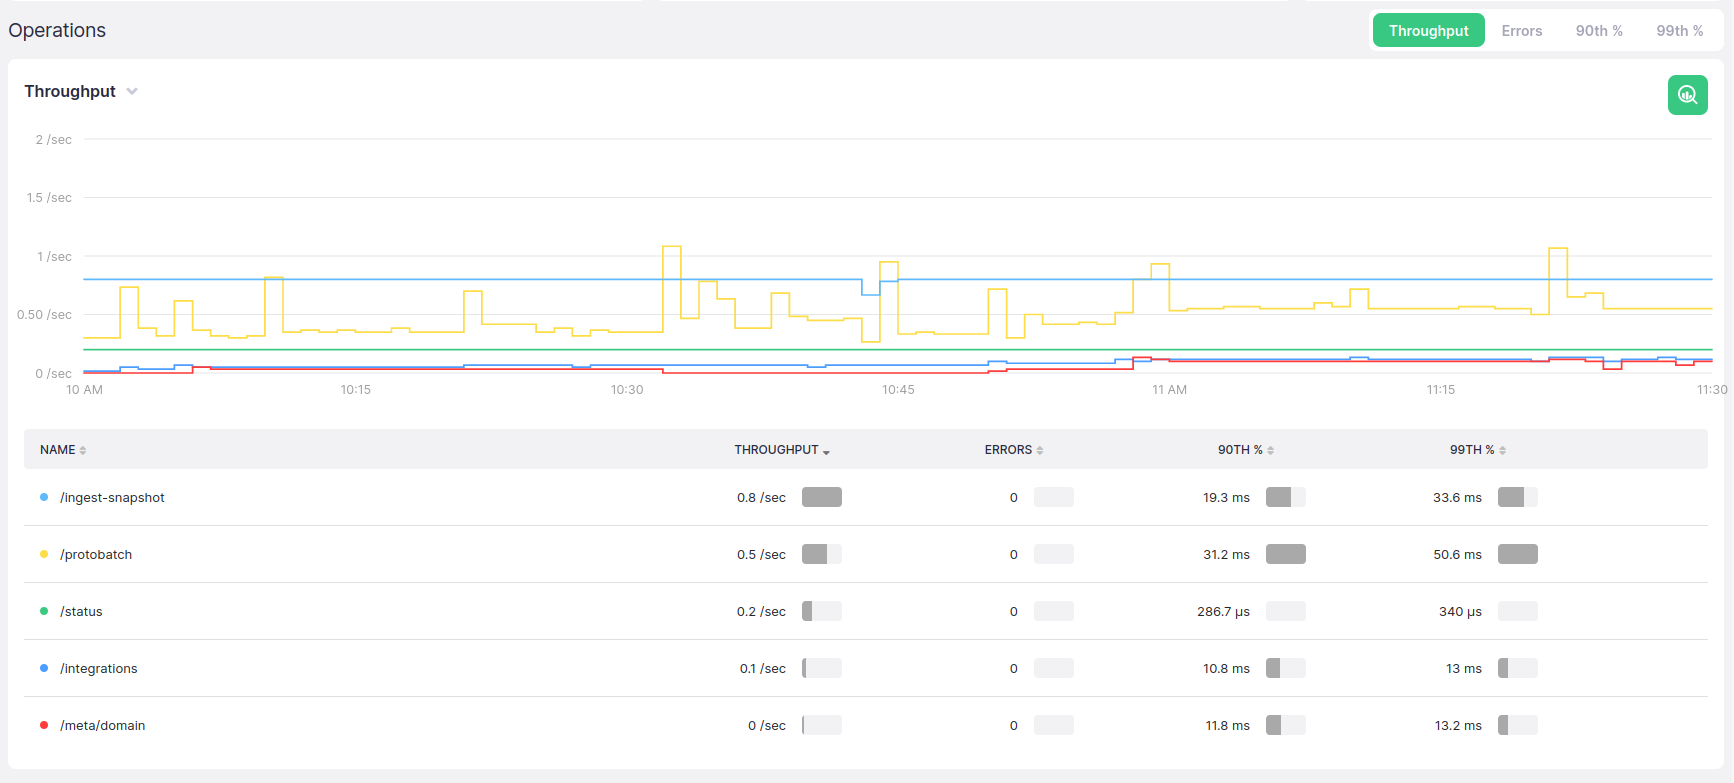
The server operations table is a breakdown of all server operations (i.e., where span kind is server) for this service, in the format of an aggregation summary chart. Two separate visualizations are present - a chart and a tabular breakdown. The table can show four different operations, with the default being throughput, chosen by selecting the appropriate operation in the top right corner: throughput, error count, p90 latency, and p99 latency. The values in the chart will be grouped by operation. Unlike other charts, this chart does not feature a legend. Instead, the table beneath it acts as an extended version of the same. The table features the operation name, and a numeric representation of all four of the values that can be chosen between as chart visualization, as well as a visual indicator that shows where the particular operation’s value is in the overall distribution. Each column can be sorted by, and sorting is toggled by clicking on the appropriate table header. Much like in the regular chart legend, hovering a table row will highlight the appropriate value in the chart above. Clicking on any table row will take you to the operation details page for that particular operation.
Service Operations Sidebar #
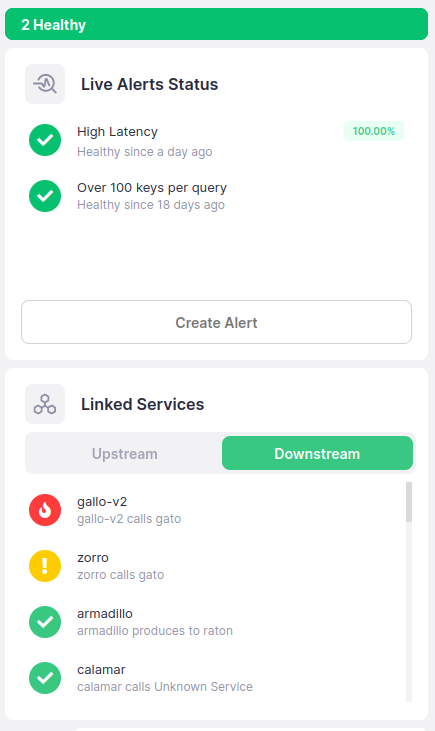
The overview sidebar includes two useful pieces of information - the status of alerts defined for the service, and the discovered links between this service and other services in your architecture.
The alerts portion of the sidebar will list all of the alerts you have defined for the service in question, as well as their overall status, and the time of the last (or current) incident. When an availability target has been defined, an additional indicator shaped like a progress bar will be displayed in the top right corner of each alert, showing the service availability status according to that alert. If it is above the set target, the indicator will be green, and otherwise it will be red. Clicking on an alert representation will open the alert drawer. Additionally, above it a small indicator will be shown that states the overall health of the system, according to all of the defined alerts.
The linked services portion of the sidebar is split into two portions: upstream and downstream services. Upstream services are those that are being called by the current service, while downstream services are those that call the current service. Toggling between them will show a list of services, including their name and a description of the connection type, with that link directionality. These connections map one-on-one to the links visualized in the service map.
Service Operations #

The Service Operations page will be defined for any service sending telemetry data to Kamon APM, including OpenTelemetry-instrumented services. The service is very similar to the overview operations table, with the same chart with four operations (throughput, error count, p90 and p99 of latency), grouping per service, and table legend behavior. However, there are two crucial differences: Firstly, all operations are represented here, not just server span operations. Secondly, in the first column, underneath the service name, two more entries will be present, if applicable. The first is the span kind, and the second is the instrumentation component that is the source of this information, with the two values separated by a slash (/) character. Clicking on any table row will take you to the operation details page for that particular operation.
Operation Details #
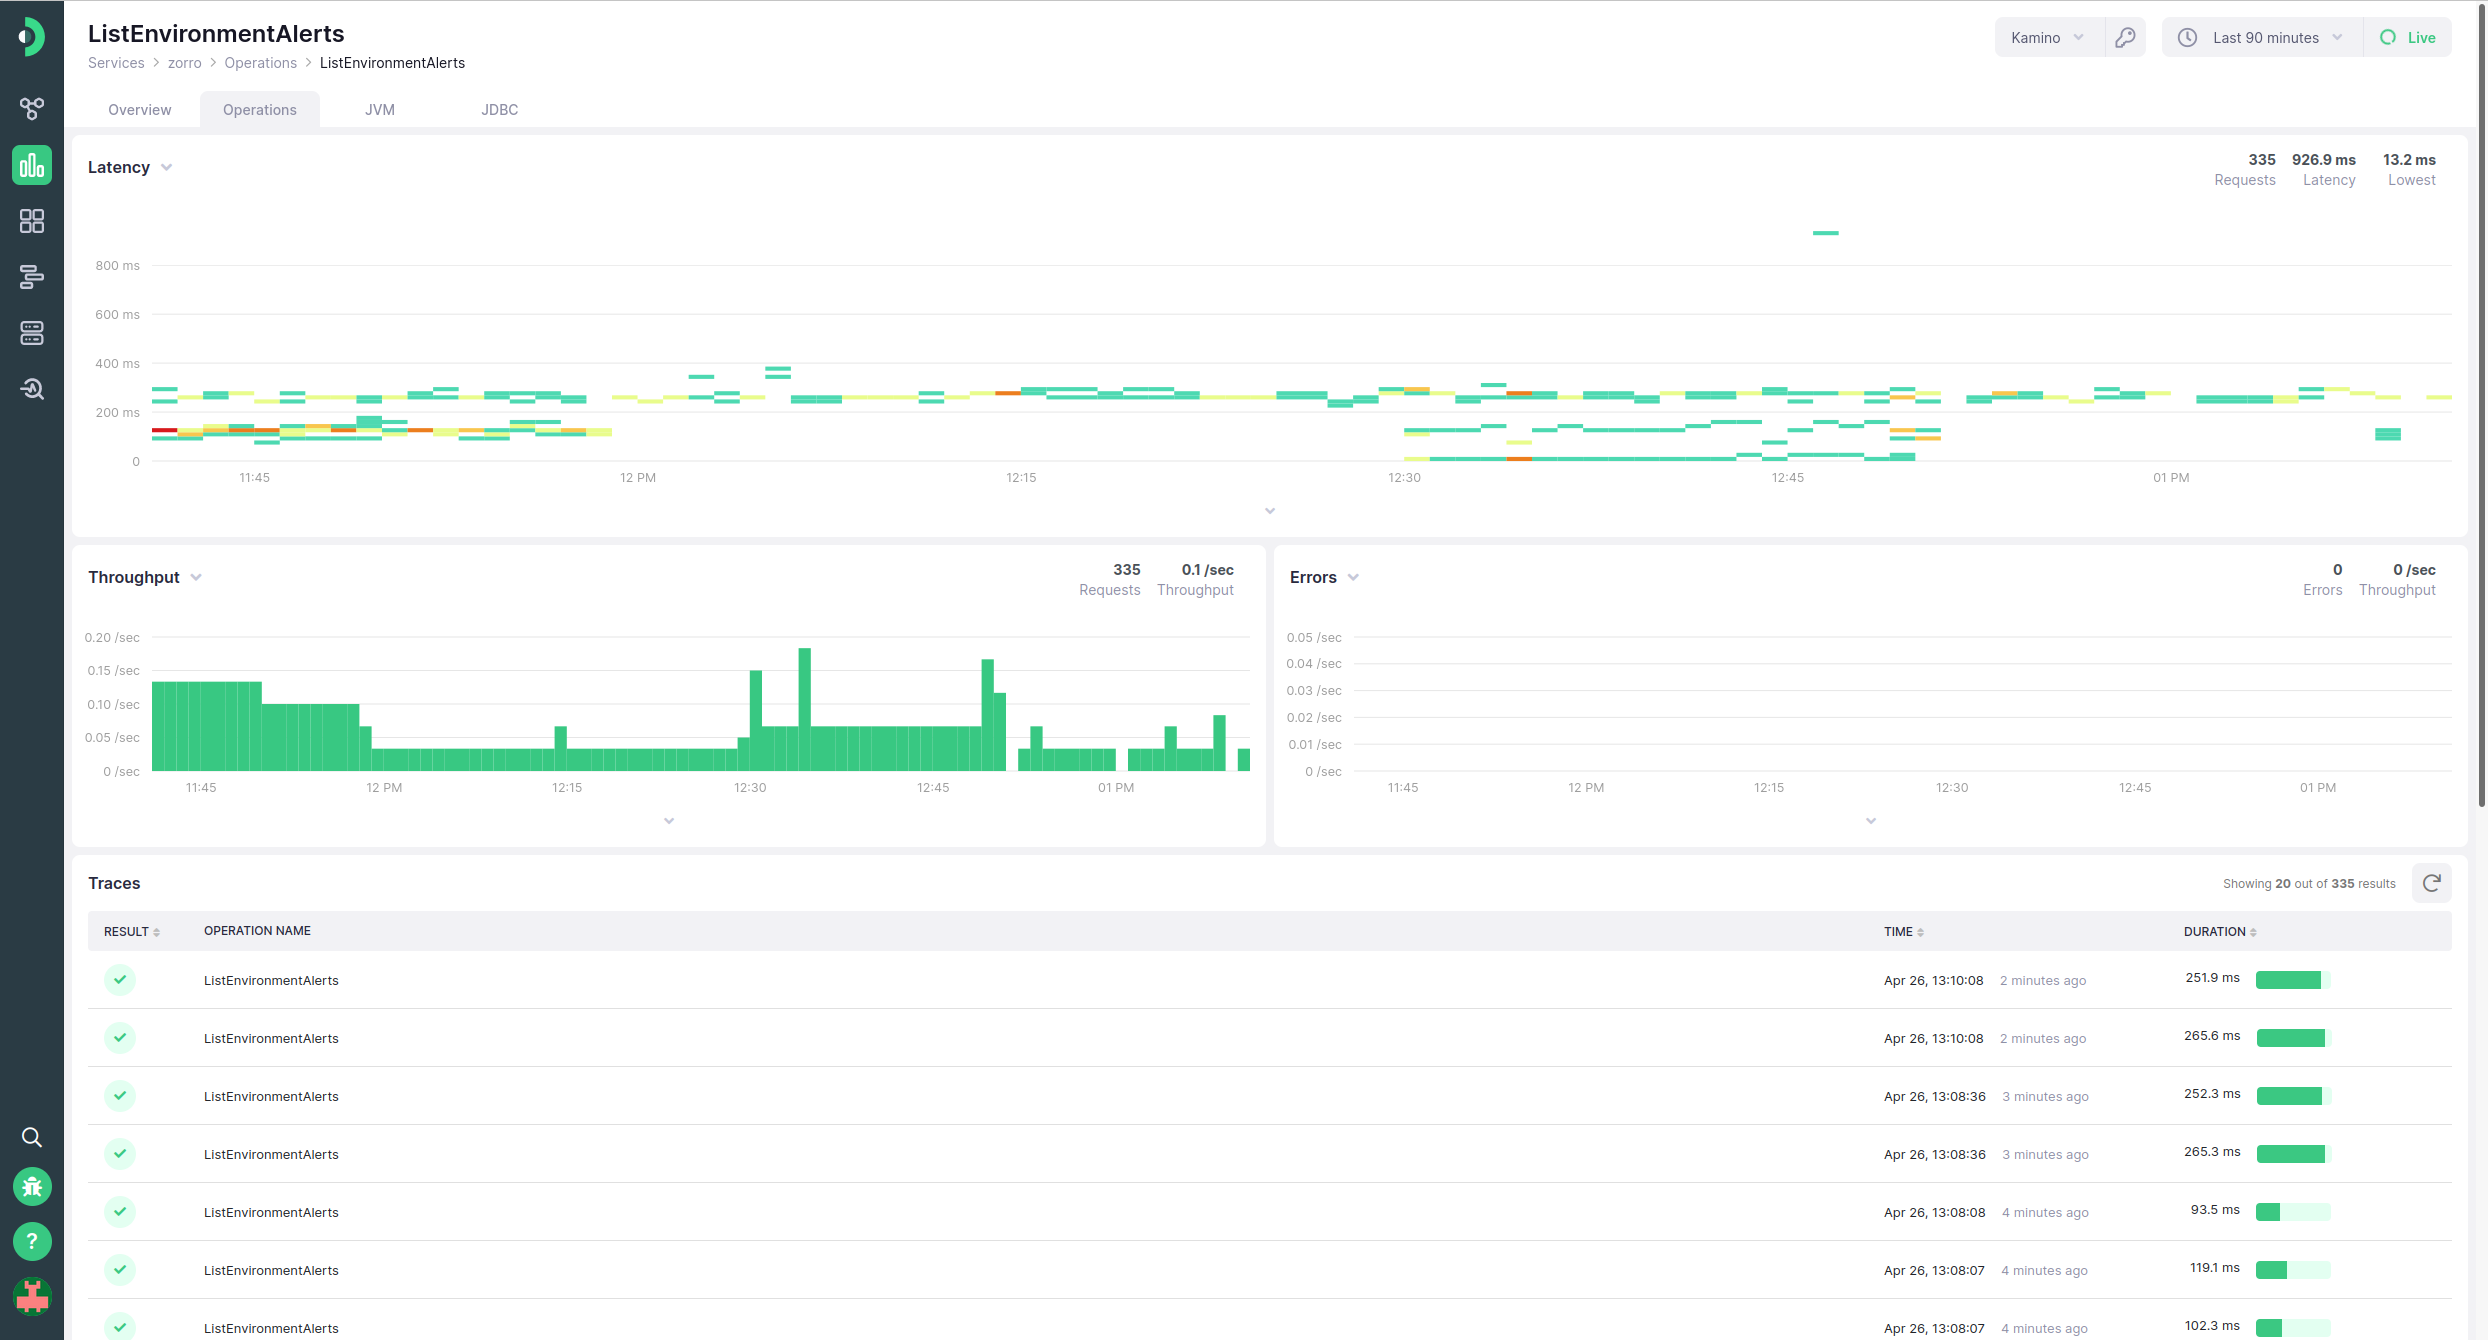
The Service Operation Details page offers a drill-down into information gathered about one particular operation. Like the Overview, it contains the Latency histogram and the throughput and error charts. Unlike the overview page, only trace metric information gathered for this particular operation is included in the charts.
Underneath the charts is located a trace list, with all sampled traces belonging to this operation. It can be used to inspect, sort, and dive into trace details. Read about the trace list for more information.
Integrations #
For service running Kamon Telemetry, additional tabs will be available, allowing you to access pre-made dashboards tailored specifically to allow you to quickly identify and investigate issues within your system. At this time, these dashboards will be created for the JVM, for JDBC operations and connection pools, and for a variety of Akka metrics, if applicable to the microservice you are monitoring.