-
Installation
-
With Kamon Telemetry
-
How To Guides
-
Migrations
-
-
Core Concepts
-
Foundations
-
Advanced
-
-
Instrumentation
-
Supported Frameworks
-
Akka
-
Akka HTTP
-
Cassandra Driver
-
Caffeine
-
Elasticsearch
-
Executors
-
Futures
-
JDBC
-
Kafka
-
Logback
-
Play Framework
-
Spring Framework
-
System Metrics
-
-
-
Reporters
-
Kamon APM
-
Using Kamon APM
-
Overview
-
Services
-
Traces
-
Dashboards
-
Alerts
-
Hosts
-
Investigating Issues
-
Settings and Administration
-
-
Setting up Kamon with Lagom Framework Applications #
This guide walks you through setting up Kamon with a Lagom Framework application and sending your first metrics and traces to Kamon APM. We are using Kamon APM as the observability platform in this example but the same steps will work if you choose any other reporter.
Before we start, make sure you are using Lagom Framework 1.5 or 1.6. This guide might work with Lagom Framework 1.4 but we have not tested it.
![]()
Beware that Kamon will not work with Lagom applications on Development mode. The instructions below will enable the Kamon instrumentation for Production Mode only.
With that out of the way, let’s get to it!
Step 1: Add the Kamon Dependencies #
Add the kamon-bundle and kamon-apm-reporter dependencies to the implementation projects (usually the ones ending with
-impl) in your build.sbt file:
      "io.kamon" %% "kamon-bundle" % "2.5.9",
      "io.kamon" %% "kamon-apm-reporter" % "2.5.9",
The Kamon Bundle dependency contains all the Kamon automatic instrumentation modules in a single jar, so that you don’t need any additional dependencies. The APM reporter dependency is in charge of sending all your metrics and traces to Kamon APM.
Step 2: Setup the SBT Javaagent Plugin #
Add the sbt-javaagent Plugin to your project/build.sbt file:
addSbtPlugin("com.lightbend.sbt" % "sbt-javaagent" % "0.1.6")Then, enable the JavaAgent plugin and include the Kanela agent on your build.sbt file:
- Adding the
JavaAgentplugin to the.enablePluginscall will enable the plugin - Then the
javaAgents += ...settings adds the Kanela agent so it will be included when your application is built for production
lazy val `hello-impl` = (project in file("hello-impl"))
  .enablePlugins(LagomScala, JavaAgent)
  .settings(
    javaAgents += "io.kamon" % "kanela-agent" % "1.0.16",
Step 3: Initialize Kamon #
Add the calls to Kamon.initWithoutAttaching and Kamon.stop to the load method in your application loader:
  override def load(context: LagomApplicationContext): LagomApplication = {
    Kamon.initWithoutAttaching(context.playContext.initialConfiguration.underlying)

    context.playContext.lifecycle.addStopHook(() => {
      Kamon.stop()
    })

    new HelloStreamApplication(context) {
      override def serviceLocator: NoServiceLocator.type = NoServiceLocator
    }
  }
These two calls ensures that all reporters and internal Kamon components are initialized and stopped along with your application.
Step 4: Configure the Kamon APM Reporter #
Add your service name and API key to the application.conf file:
kamon {
  environment.service = "Lagom Application"
  apm.api-key = "Your API Key"
}
You can copy your API key directly from Kamon APM. If you are using other reporters please take a look at their documentation for additional settings.
Step 5: Verify the Installation #
Next time your application starts on production, Kamon should be up and running as well! Open http://localhost:5266/ in your browser and you’ll find the Kamon Status Page. It should look like this:
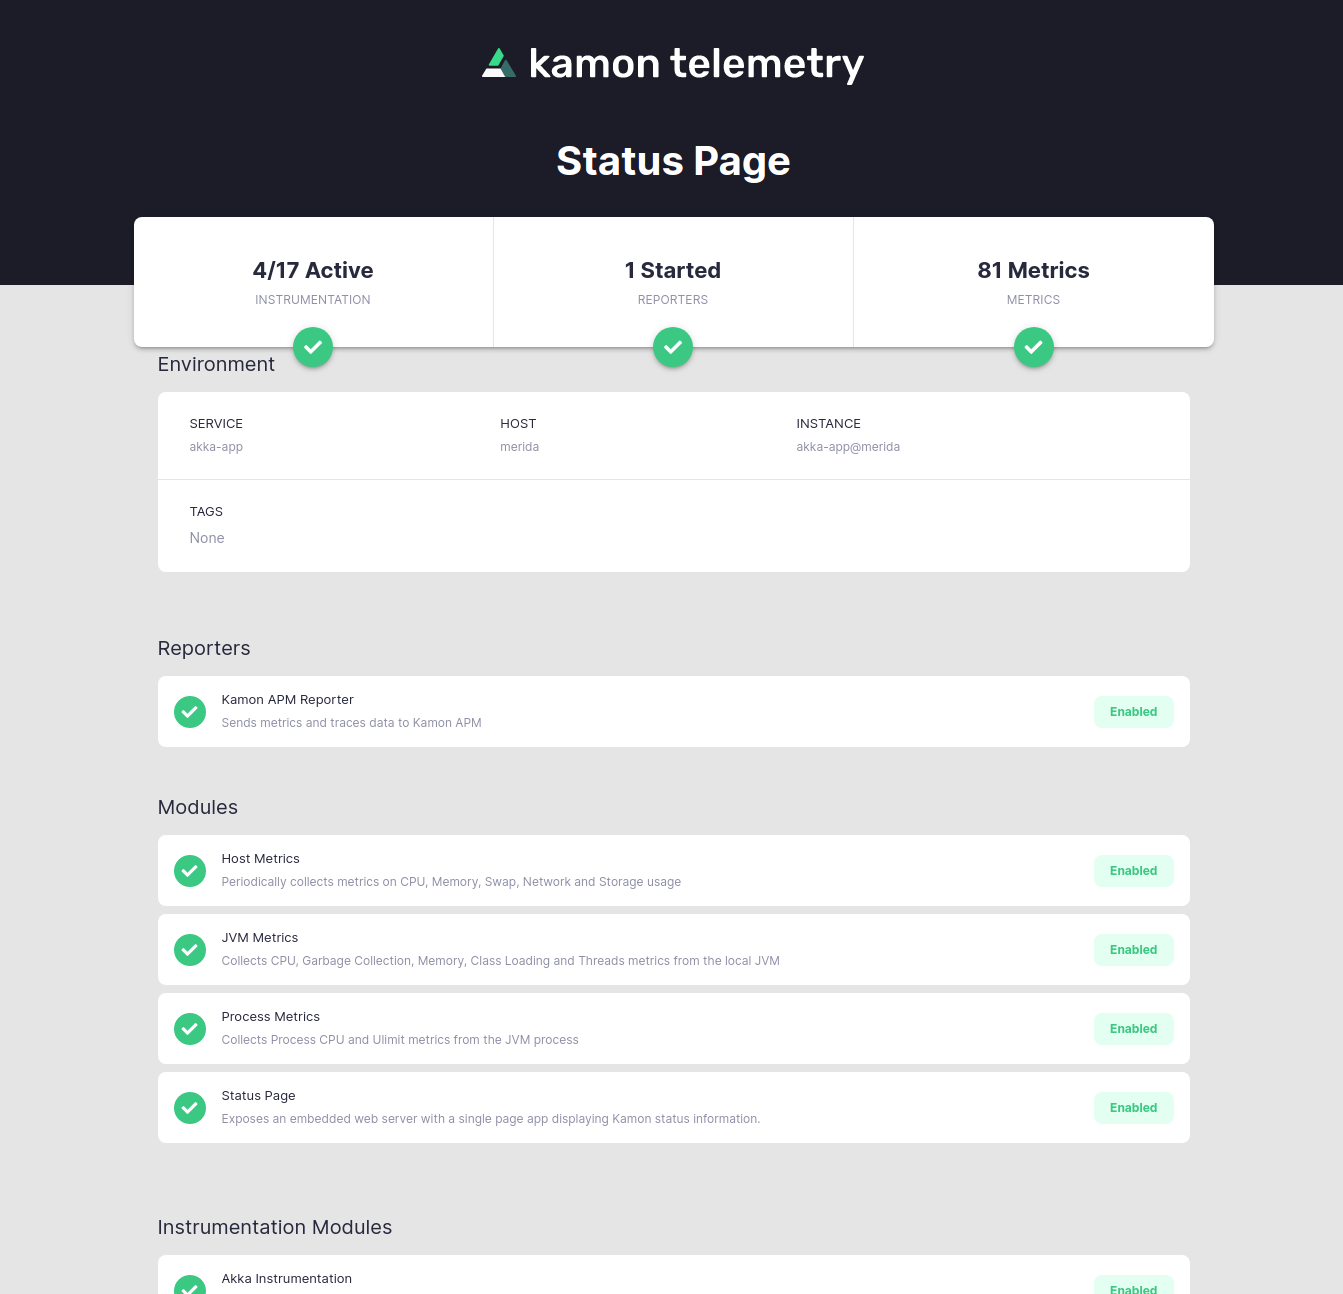
The important bits to check in the Status Page are that the modules have a green check mark and instrumentation is shown as active on the top-left corner. If your installation didn’t go well, please stop by our Github Discussions and post a question. We will do our best to help!
That is it, your installation is done! You might want to check out the How To Guides for common post-installation steps to improve your instrumentation.
Experimental: Using Kamon in Development Mode #
The guide above sets up Kamon for production mode only, but there is a hack we developed (yes, it is a hack) to enable Kamon’s instrumentation in Development mode, with two caveats:
- It only works with Lagom 1.6.x
- It only works with one Lagom project at a time
If you have several Lagom projects in the same build you can run them all, but only one of them will run with Kamon’s instrumentation in Development mode.
Here is how you set it up:
Add the SBT Kanela Runner Plugin #
Include the sbt-kanela-runner-lagom-1.6 plugin in your project/plugins.sbt file:
// For Lagom Framework Framework <=1.6.4
addSbtPlugin("io.kamon" % "sbt-kanela-runner-lagom-1.6" % "2.0.13")

// For Lagom Framework Framework >1.6.5
addSbtPlugin("io.kamon" % "sbt-kanela-runner-lagom-1.6" % "2.0.14")
Initialize Kamon #
Add the calls to Kamon.initWithoutAttaching and Kamon.stop to the loadDev method in your application loader:
  override def loadDevMode(context: LagomApplicationContext): LagomApplication = {
    Kamon.initWithoutAttaching(context.playContext.initialConfiguration.underlying)

    context.playContext.lifecycle.addStopHook(() => {
      Kamon.stop()
    })

    new HelloApplication(context) with LagomDevModeComponents
  }
Enable the SbtKanelaRunnerLagom Plugin #
Finally, pick one (and only one) of your implementation services and enable the SbtKanelaRunnerLagom plugin on it:
lazy val `hello-stream-impl` = (project in file("hello-stream-impl"))
  .enablePlugins(LagomScala, JavaAgent, SbtKanelaRunnerLagom)
And you are ready to go. The next time you execute run or runAll on your SBT terminal you will see the Kamon
instrumentation kick off for the project that has the SbtKanelaRunnerLagom plugin enabled.