-
Installation
-
With Kamon Telemetry
-
How To Guides
-
Migrations
-
-
Core Concepts
-
Foundations
-
Advanced
-
-
Instrumentation
-
Supported Frameworks
-
Akka
-
Akka HTTP
-
Cassandra Driver
-
Caffeine
-
Elasticsearch
-
Executors
-
Futures
-
JDBC
-
Kafka
-
Logback
-
Play Framework
-
Spring Framework
-
System Metrics
-
-
-
Reporters
-
Kamon APM
-
Using Kamon APM
-
Overview
-
Services
-
Traces
-
Dashboards
-
Alerts
-
Hosts
-
Investigating Issues
-
Settings and Administration
-
-
Cassandra Driver Instrumentation #
Since 2.1.2
Overview #
The Cassandra Driver instrumentation automatically traces queries sent to Cassandra, and collects performance metrics for the driver sessions and connection pools.
Query Tracing #
With the default configuration, the driver instrumentation will only trace calls to Session.execute(...). For example,
if you prepare a statement and execute seven different queries on a session, your trace will look similar to this:
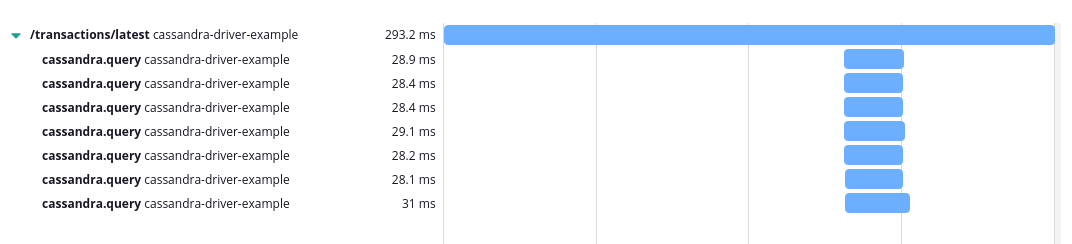
Each executed query generates a single Span, regardless of whether the query had to be retried or speculated on.
All query spans will contain these tags:
-
component: With the value
cassandra.driver. -
db.type: With the value
cassandra. - db.statement: With the CQL statement sent to Cassandra.
- cassandra.query.kind: Message class. With either select, update, delete or insert.
Additionally, for select queries there are three additional tags with information about the ResultSet returned for the
query:
- cassandra.driver.rs.fetch-size: With the configured fetch size for the query.
- cassandra.driver.rs.fetched: With the count of CQL rows that were fetched with the query.
- cassandra.driver.rs.has-more: With true or false, indicating whether the Cassandra server has more results waiting to be fetched for the query.
Round Trip Tracing #
In addition to the query tracing, the instrumentation can produce Spans for every round trip between the Cassandra
driver and the server. Round trip tracing is disabled by default because it significantly increases the number of Spans
generated for every executed query. You can enable it by changing this setting in your application.conf file:
kamon.instrumentation.cassandra {
  tracing.create-round-trip-spans = no
}
Every interaction with Cassandra servers is traced when round trip tracing is enabled, including preparation of statements, retries and speculative executions. For example, the same application used in the query tracing above generates all these Spans in a normal request processing:
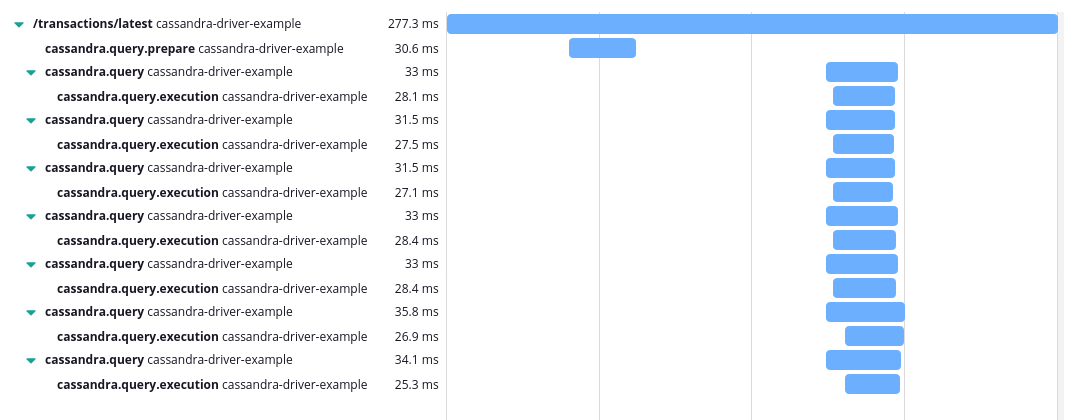
Notice the cassandra.query.prepare span, and all of the cassandra.query.execution spans that were automatically
created for each query sent to Cassandra.
All the round trip Spans are tagged with:
- cassandra.node: With the execution’s target node.
- cassandra.rack: With the rack of the execution’s target node.
- cassandra.dc: With the datacenter of the execution’s target node.
Use with caution. The number of Spans generated when round trip tracing is enabled can overwhelm your tracing system.
Disabling Tracing #
If you want to completely disable tracing of Cassandra queries and round trips, set the
kamon.instrumentation.cassandra.tracing.enabled setting to no, as shown below:
kamon.instrumentation.cassandra {
  tracing.enabled = no
}
Session Metrics #
All the following metrics are automatically tracked for all Cassandra Driver sessions:
- source: Contains wither "client" or "server", depending on the source of the error.
Connection Pool Metrics #
The instrumentation can automatically collect metrics for all connection pools created by the Cassandra Driver. This feature is disabled by default, because the Casssandra Driver creates one connection pool for each node it connects to, which could mean tracking tens to hundreds of connection pools.
If you wish to enable connection pool metrics, set the kamon.instrumentation.cassandra.metrics.track-node-connection-pools
setting to yes, as shown below:
kamon.instrumentation.cassandra {
  metrics.track-node-connection-pools = yes
}
When connection pool tracking is enabled, you will start seeing these metrics for all connection pools:
- cassandra.node: The address of the target node of the connection pool.
- cassandra.rack: The rack of the connection pool's target node.
- cassandra.dc: The datacenter of the connection pool's target node.
- source: Contains wither "client" or "server", depending on the source of the error.
Manual Installation #
In case you are not using the Kamon Bundle, add the dependency below to your build.
libraryDependencies += "io.kamon" %% "kamon-cassandra" % "2.5.9"
    <dependency>
      <groupId>io.kamon</groupId>
      <artifactId>kamon-cassandra_2.13</artifactId>
      <version>2.5.9</version>
    </dependency>
implementation 'io.kamon:kamon-cassandra_2.13:2.5.9'
![]()
You must start your application with the instrumentation agent for this module to work properly.