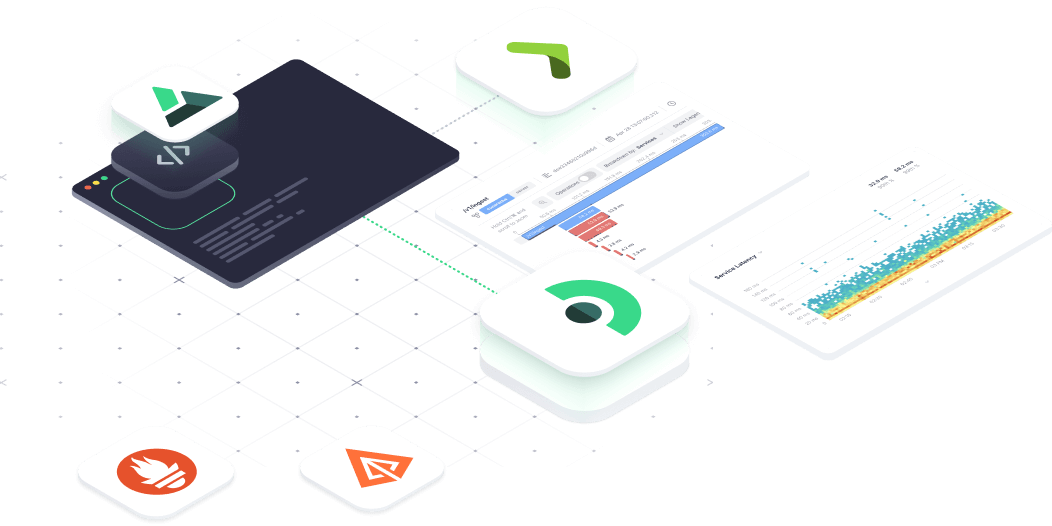
Monitoring for Play Framework
Backends and APIs
Find out what controllers, database calls, and Akka components
affect performance in production. Get correlated metrics and traces from
Play Framework in a fully managed solution, starting Free with Kamon APM
Monitor client and
server requests
Measure response time automatically for every request and drill down to the slow and failed ones
- Get out-of-the-box dashboards with latency, throughput, and errors for all Play Server routes
- Trace requests sent across services with Play WS Client, OkHttp, and other supported HTTP clients
- Propagate requestId, clientId, and other trace context information automatically across services
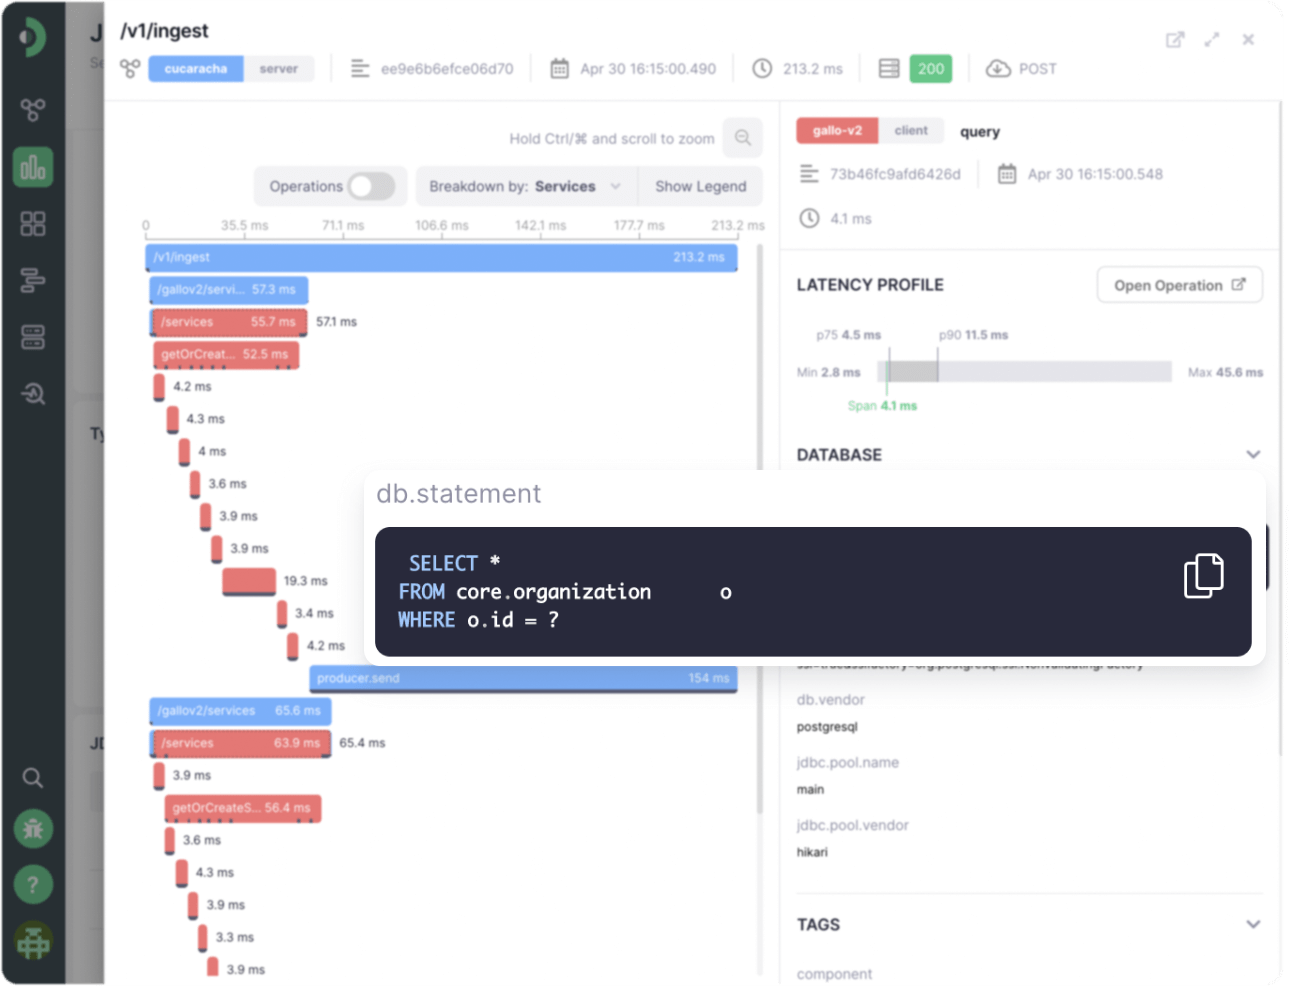
Investigate slow database queries
Find the database queries that slow down performance and cause timeouts
- Trace database calls with any JDBC driver including Postgres, MySQL, MariaDB, and more
- Monitor the Hikari Connection Pool health metrics for timeouts, connection issues, and errors
- Connect server request traces with Slick database calls automatically
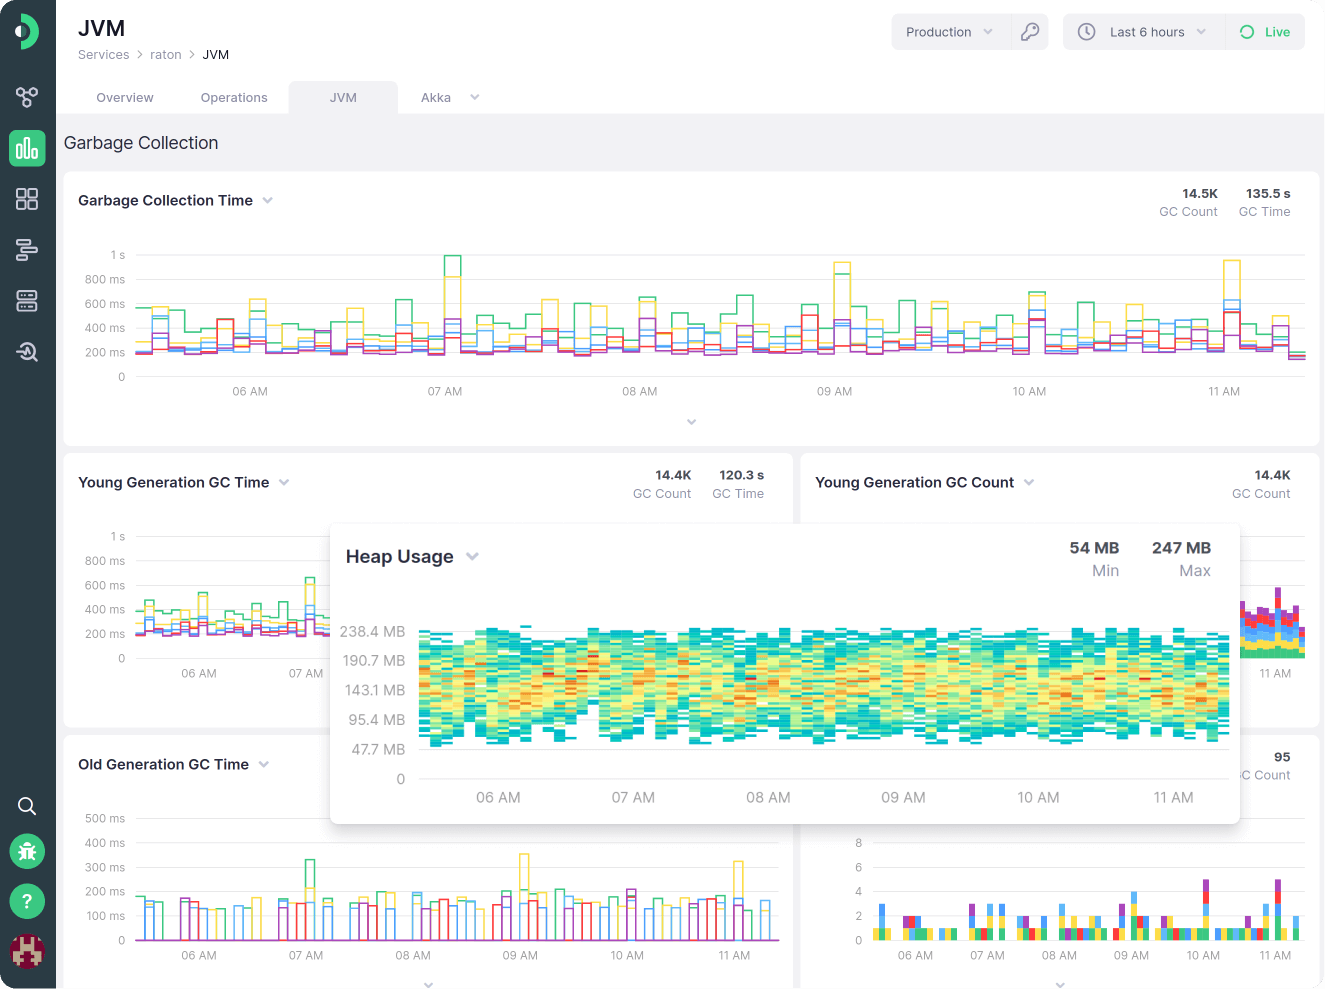
Troubleshoot JVM components
Keep an eye on the JVM components that can cause performance issues
- Track how much time is spent on garbage collection
- See how much heap memory is used and detect out of memory errors before they happen
- See how thread pools are keeping up with the work
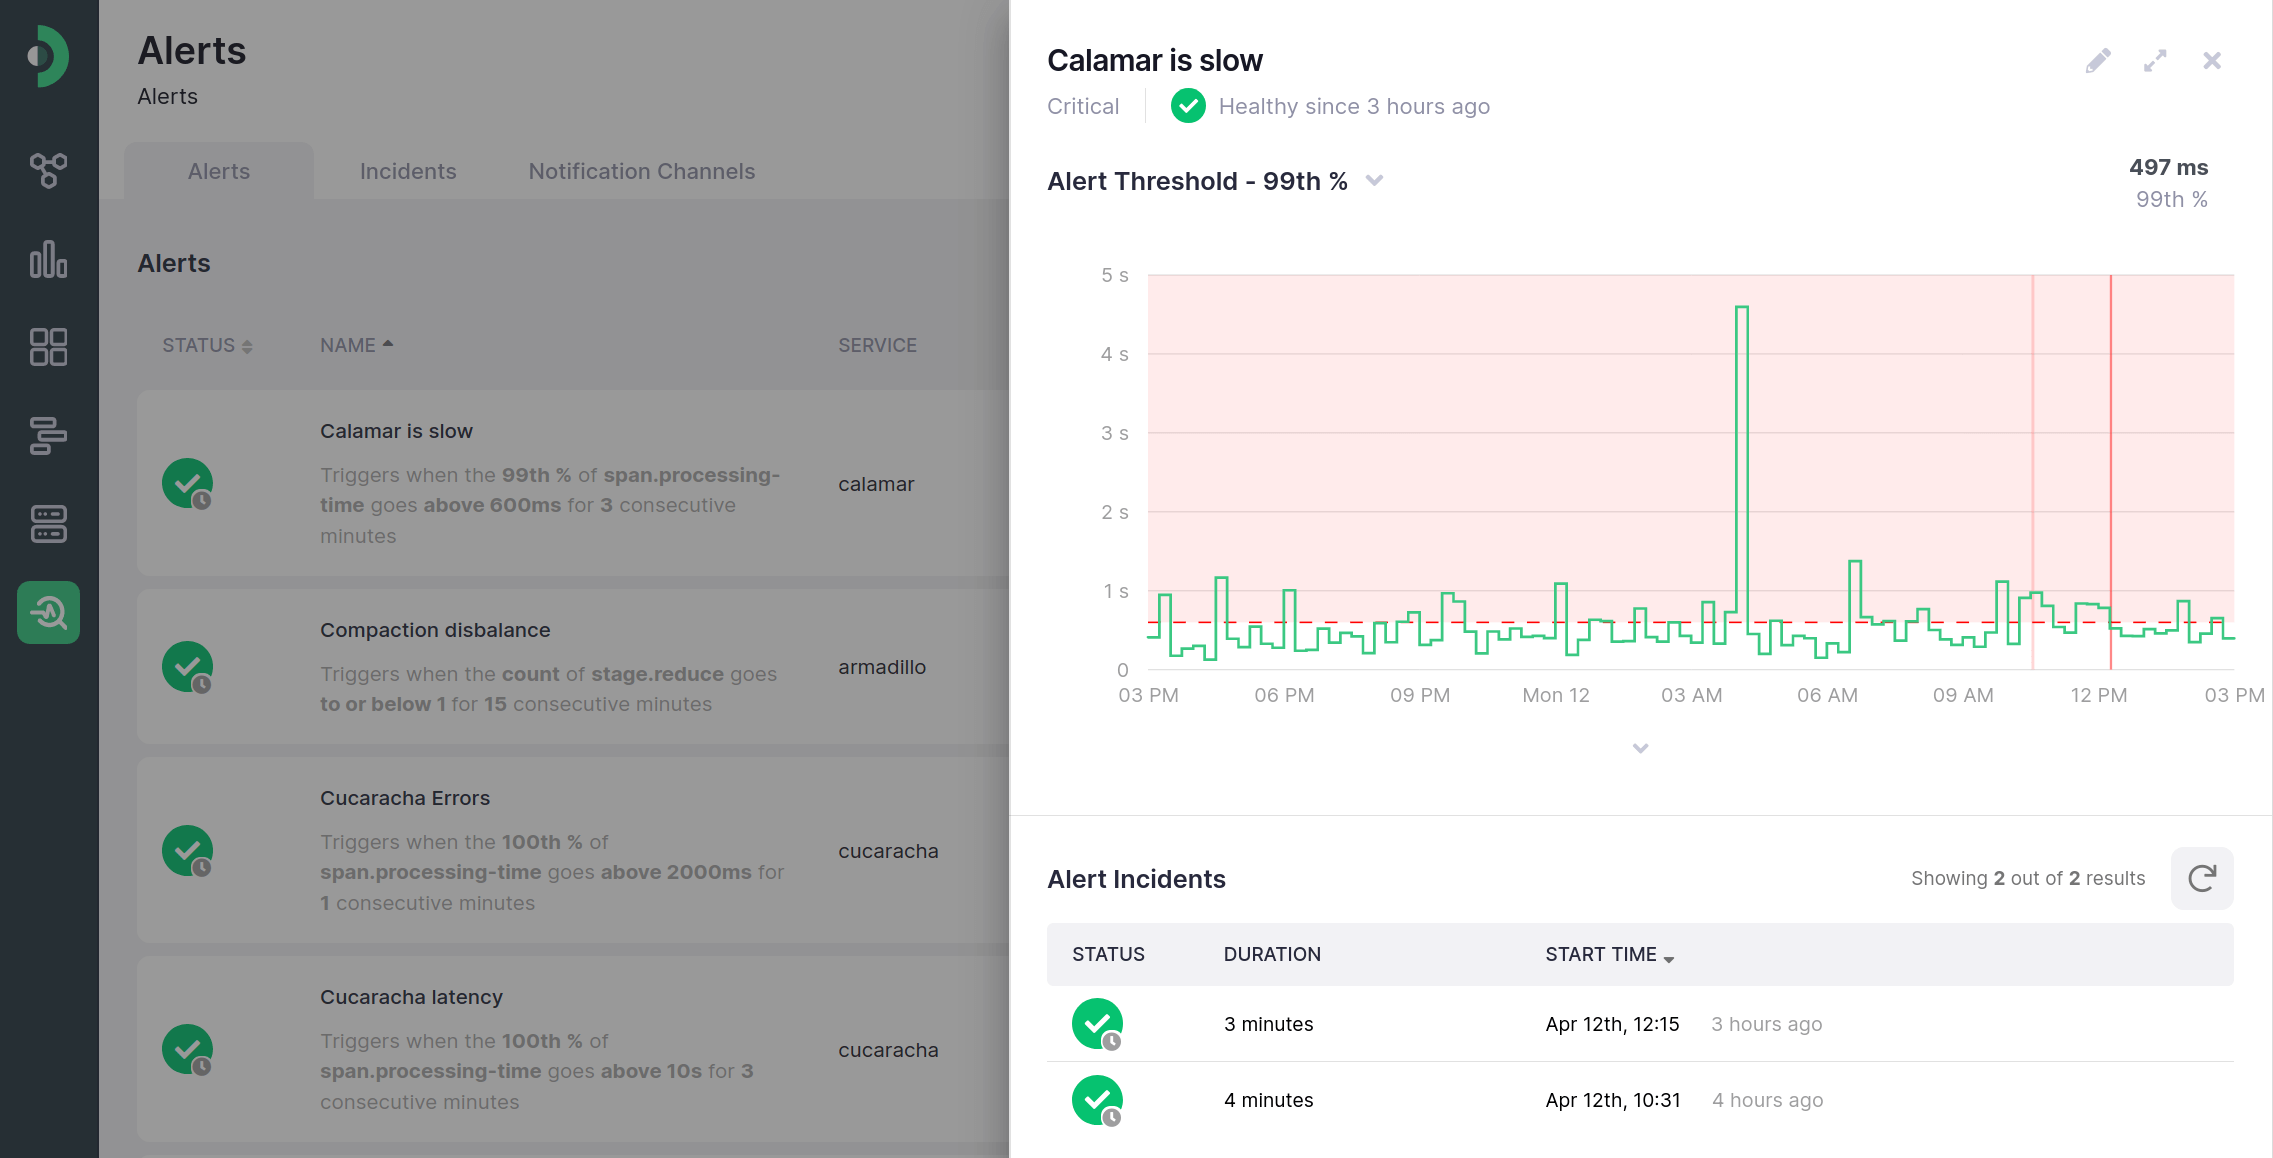
Get notifications when things go wrong
Send alert notifications to Slack or PagerDuty (and more) when latency increases or errors start to show up
- Create alerts based on accurate percentiles calculated from all your raw data
- Track Service Level Objectives (SLOs) for all your services
- Get the full picture of service status and dependencies between them in the Service Map
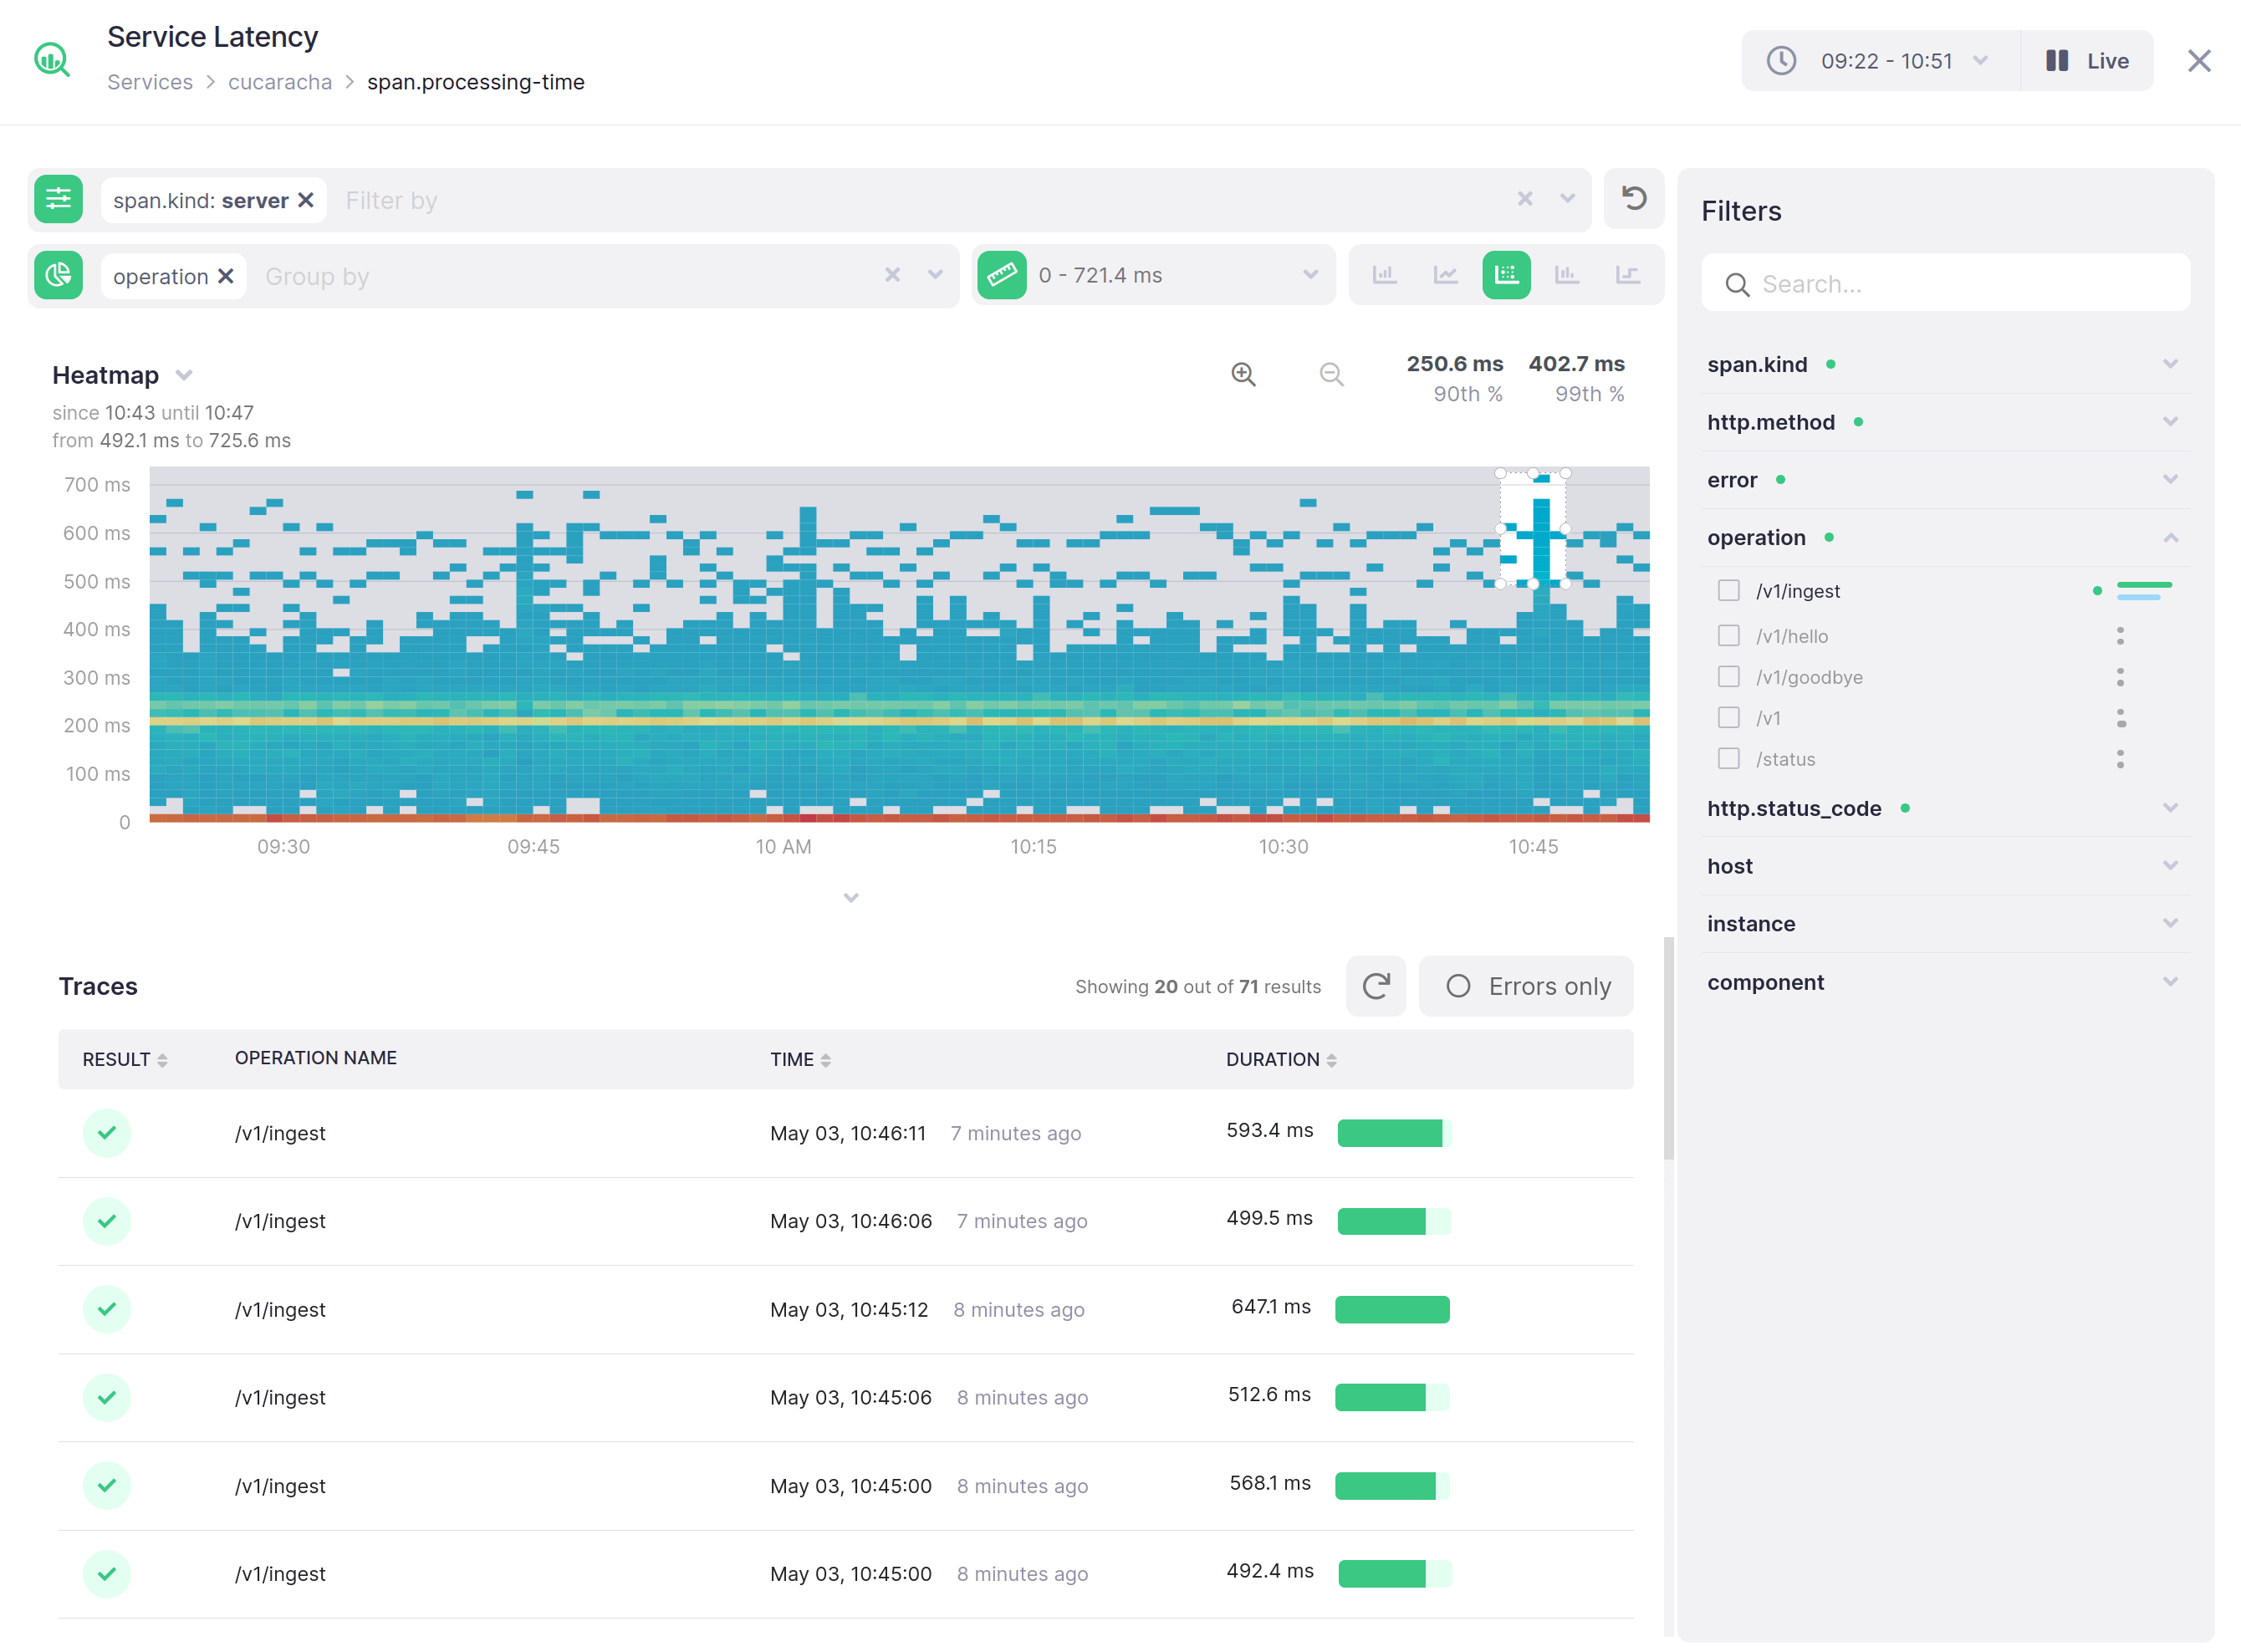
Monitor the metrics
that matter to you
Create custom dashboards, get alert notifications, and drill down into any metric you send to Kamon APM
- Use high-definition histograms to get accurate percentiles and heatmaps
- Click on any chart to slice and dice across any metric dimension
- Point and click to create alerts from any chart

Send metrics and traces
wherever you want
Kamon Telemetry works awesome with Kamon APM, but it doesn't end there. You can send the same metrics and traces to Prometheus, Zipkin, Jaeger, and many other tools