-
Installation
-
With Kamon Telemetry
-
How To Guides
-
Migrations
-
-
Core Concepts
-
Foundations
-
Advanced
-
-
Instrumentation
-
Supported Frameworks
-
Akka
-
Akka HTTP
-
Cassandra Driver
-
Caffeine
-
Elasticsearch
-
Executors
-
Futures
-
JDBC
-
Kafka
-
Logback
-
Play Framework
-
Spring Framework
-
System Metrics
-
-
-
Reporters
-
Kamon APM
-
Using Kamon APM
-
Overview
-
Services
-
Traces
-
Dashboards
-
Alerts
-
Hosts
-
Investigating Issues
-
Settings and Administration
-
-
JDBC Integration #
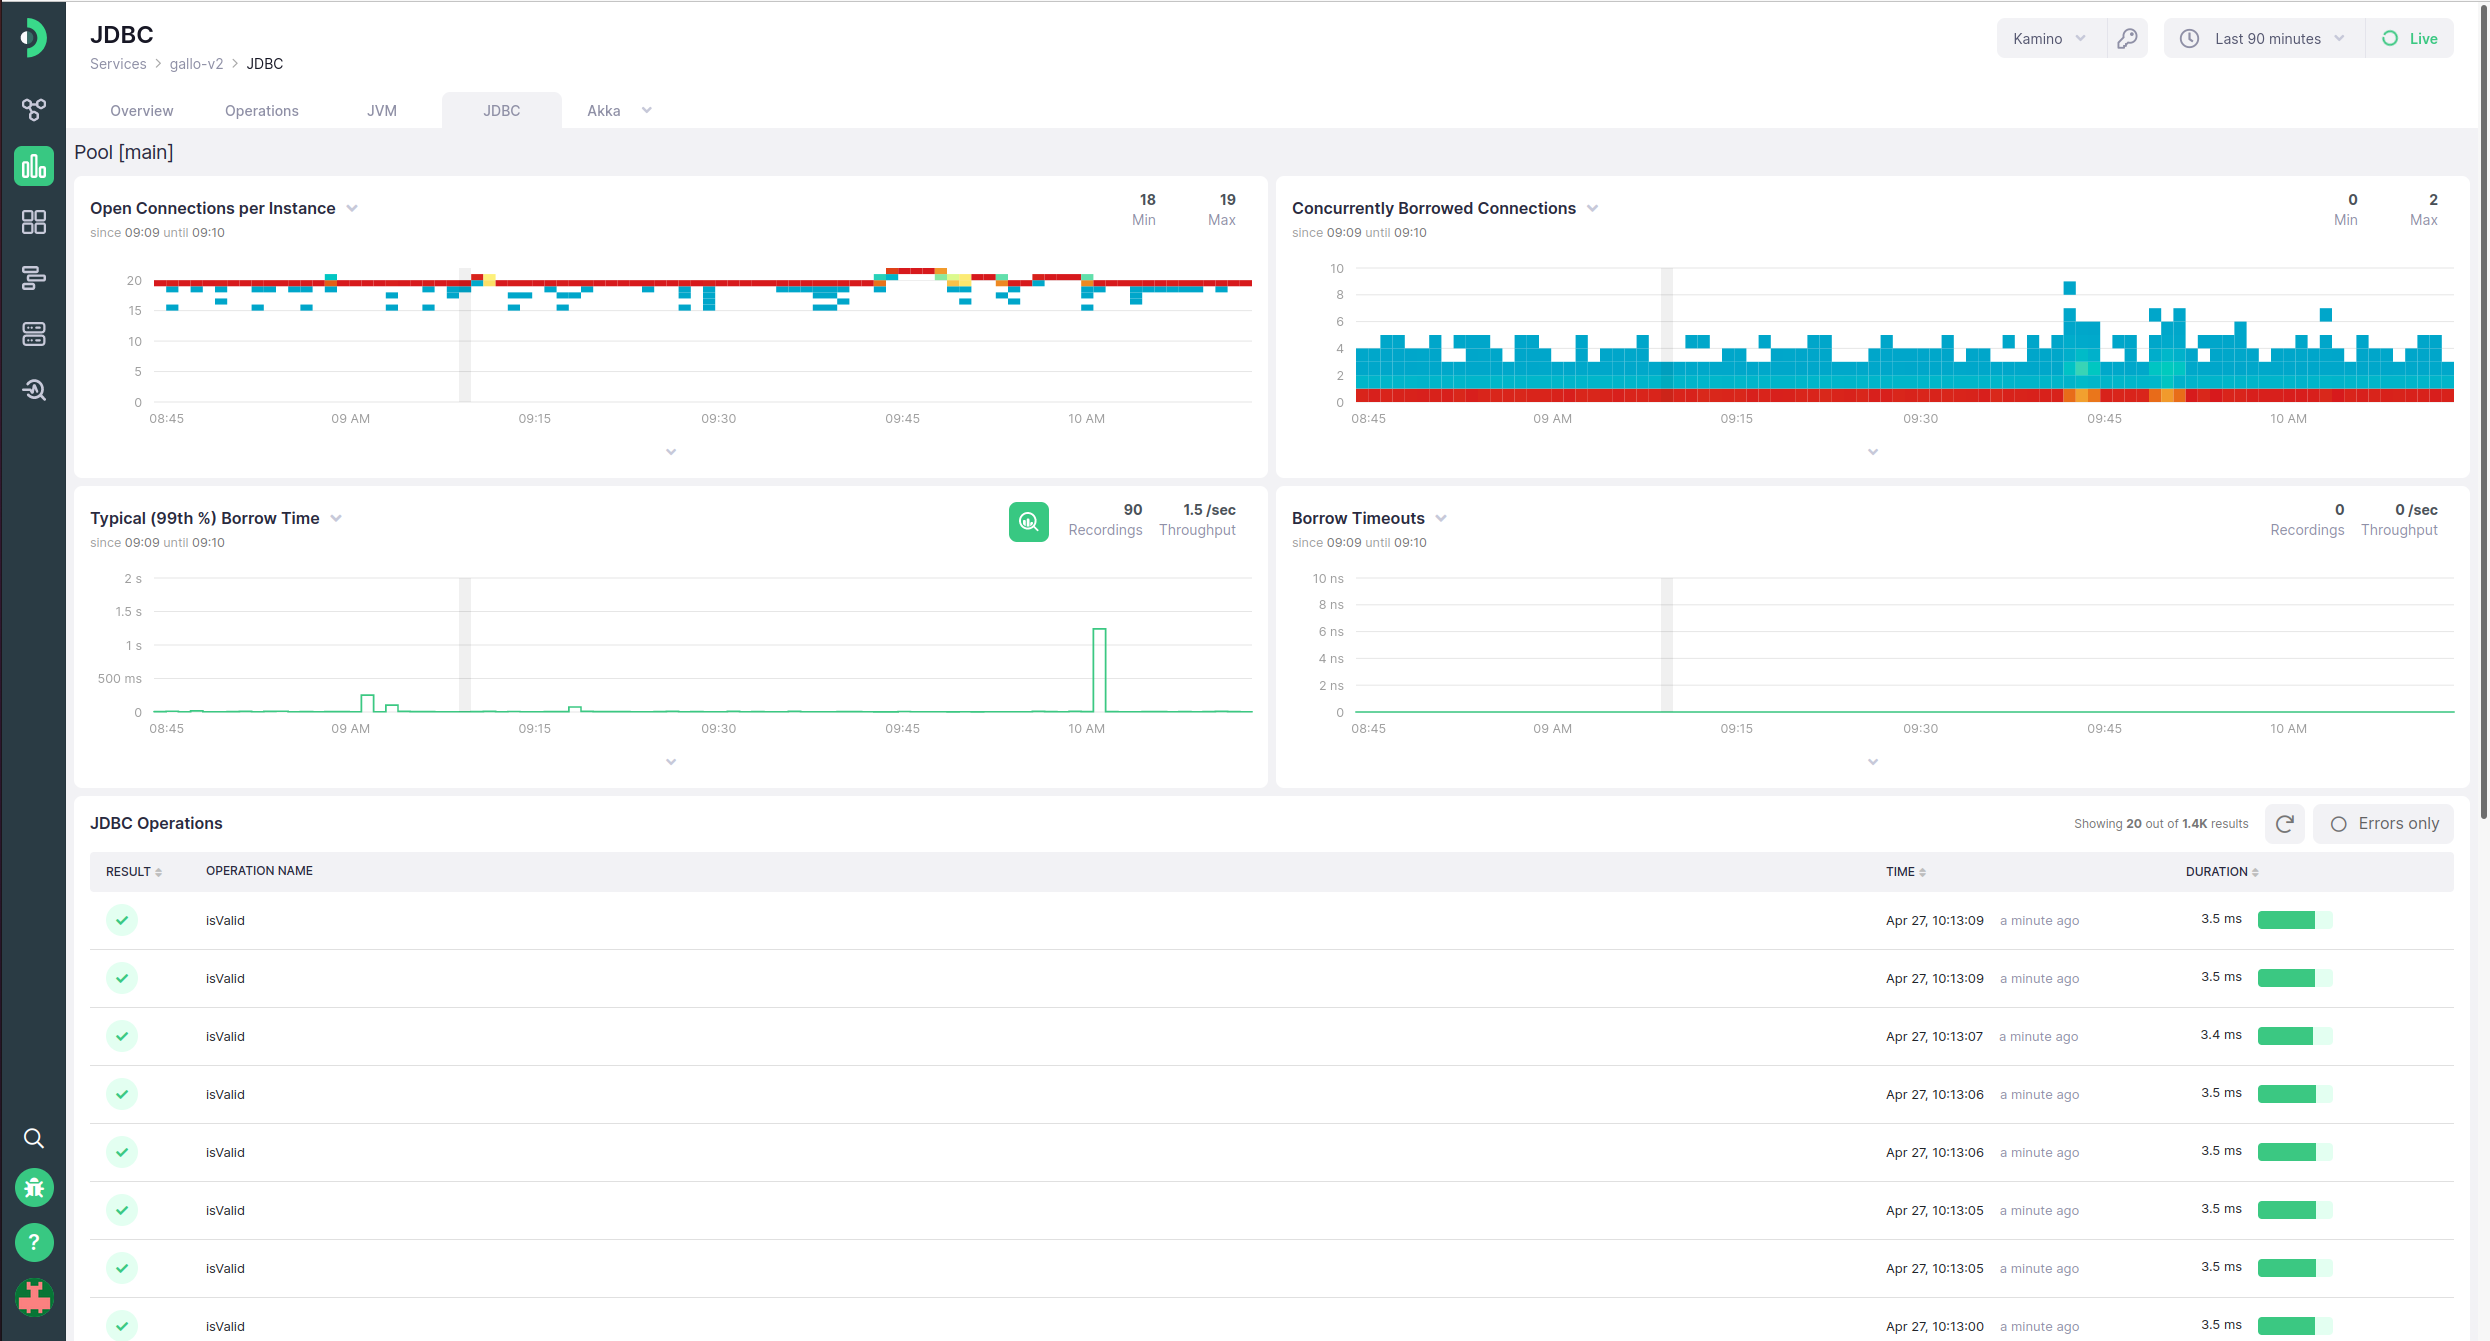
If your service is running one of the supported database drivers, Kamon APM will automatically make available to you a JDBC integration page, which will show a list of all sampled spans related to database queries. It can be used to inspect, sort, and dive into trace details. Read about the trace list for more information.
Additionally, if using one or more Hikari connection pools, each pool will get its dedicated charts displaying the following metrics for the connection pool: the distribution of the number of open connections, the distribution of concurrently borrowed collection counts, p99 of borrow times for those connections, and durations of any borrow timeouts occurring in your application.
The JDBC integration can be access from the service overview page, where a JDBC tab will appear on the top of the page if the integration is detected.
![]()
JDBC integration dashboards are a feature exclusive to Kamon Telemetry. If you use OpenTelemetry with a service using JDBC, you will not have access to this dashboard.