-
Installation
-
With Kamon Telemetry
-
How To Guides
-
Migrations
-
-
Core Concepts
-
Foundations
-
Advanced
-
-
Instrumentation
-
Supported Frameworks
-
Akka
-
Akka HTTP
-
Cassandra Driver
-
Caffeine
-
Elasticsearch
-
Executors
-
Futures
-
JDBC
-
Kafka
-
Logback
-
Play Framework
-
Spring Framework
-
System Metrics
-
-
-
Reporters
-
Kamon APM
-
Using Kamon APM
-
Overview
-
Services
-
Traces
-
Dashboards
-
Alerts
-
Hosts
-
Investigating Issues
-
Settings and Administration
-
-
Incidents #
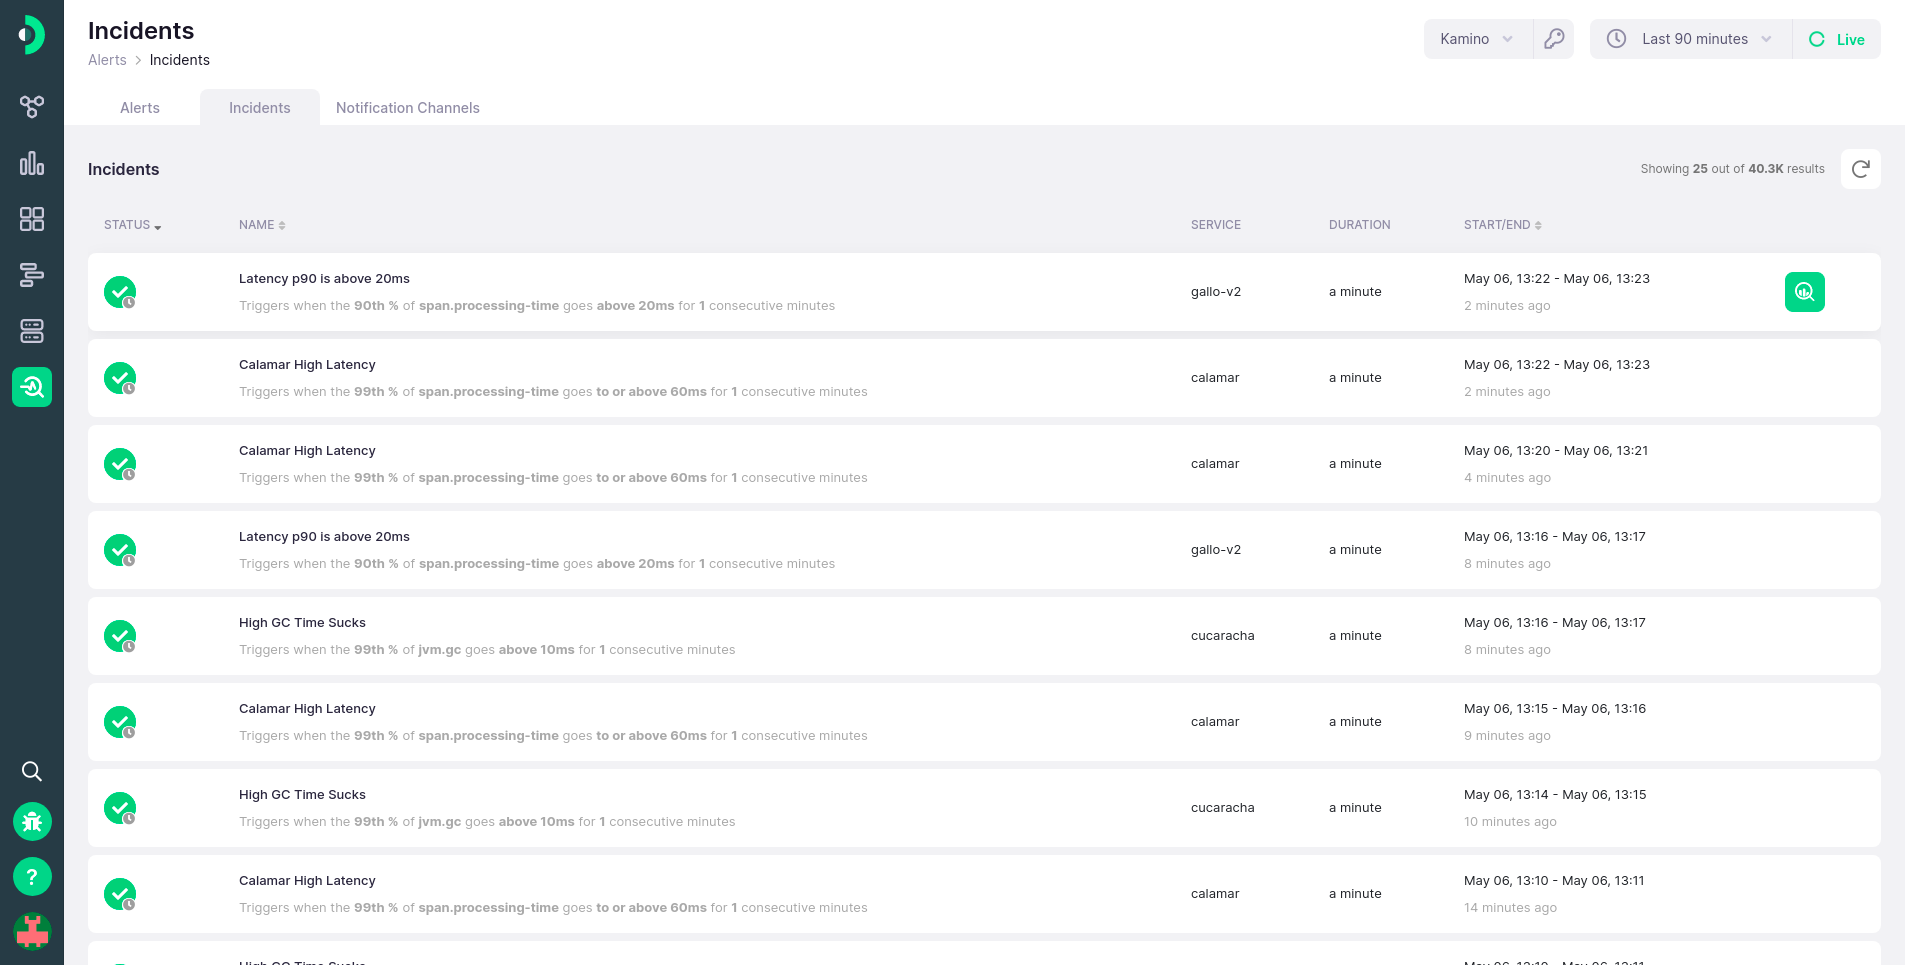
Each time an alert triggers, an incident is recorded. In simple terms, an incident a period of time during which the alert condition was breached. The Incidents page is a centralised location to find all current and past incidents and see details about them.
Each incident will be represented as a row in a paginated table. The incident will have an appropriate alert status icon if it is active, or the healthy icon with a clock indicator if the incident has since concluded. An incident will include a name, description, duration, and a start/end period. If the incident is ongoing, the duration will only be the duration thus far, and the incident end time will be marked as ongoing.
By clicking on each row, you can open the alert drawer, but with that incident already highlighted, for easier analysis.
Each row, when hovered on, will display an Analyze button. If clicked, it will take you to the analyze view, with the time and data source already preconfigured for that particular incident.
![]()
You will not be able to analyze incidents that are outside of your metric retention period! If you need a longer retention period, consider upgrading your plan.
You can load more incidents by clicking on the Load More button at the bottom of the page. The incidents table can be sorted by several of the fields if you need to find a specific incident, and will be sorted by its start time by default, with the newest incident coming first.