-
Installation
-
With Kamon Telemetry
-
How To Guides
-
Migrations
-
-
Core Concepts
-
Foundations
-
Advanced
-
-
Instrumentation
-
Supported Frameworks
-
Akka
-
Akka HTTP
-
Cassandra Driver
-
Caffeine
-
Elasticsearch
-
Executors
-
Futures
-
JDBC
-
Kafka
-
Logback
-
Play Framework
-
Spring Framework
-
System Metrics
-
-
-
Reporters
-
Kamon APM
-
Using Kamon APM
-
Overview
-
Services
-
Traces
-
Dashboards
-
Alerts
-
Hosts
-
Investigating Issues
-
Settings and Administration
-
-
Installation on a Plain Application #
This guide is an “extended” version of the official Get Started steps for a plain application, but here we
dive a little bit more into what is being achieved in each step. By “plain application” we mean any application that
starts from a good old main method that you can control, like pretty much all Akka, Akka HTTP and Spring Boot
applications out there.
The general idea stays the same as in the official guide, there are three simple steps to follow:
Install Kamon #
Add the Bundle Dependency #
First of all, add the kamon-bundle dependency using your build system of choice. The bundle contains all the
instrumentation available in Kamon, it even includes Kanela! (our instrumentation agent). Here is how it would look like
in your build:
libraryDependencies += "io.kamon" %% "kamon-bundle" % "2.5.9"
    <dependency>
      <groupId>io.kamon</groupId>
      <artifactId>kamon-bundle_2.13</artifactId>
      <version>2.5.9</version>
    </dependency>
implementation 'io.kamon:kamon-bundle_2.13:2.5.9'
The bundle is available for Java 8+ and published for Scala 2.11 and 2.12 (Scala 2.13 will be available shortly). If you are not familiar with the Scala version suffix then just pick the greatest Scala version available.
The SBT Plugin #
This is only useful if you are an SBT user, so feel free to jump to the next section if this isn’t relevant for you.
One super common development practice among SBT users is to just hit run on the SBT console a voila, the application
is running right there and then. But, if you want Kanela (our instrumentation agent) to work properly when running from
SBT then you should install the sbt-kanela-runner plugin by adding this to your project/plugins.sbt file:
addSbtPlugin("io.kamon" % "sbt-kanela-runner" % "2.0.14")After this, whenever you hit run the instrumentation will be applied as expected!
Initializing Kamon #
The last step is to initialize Kamon, which is just about calling Kamon.init() as the very first thing when your main
method is invoked:
object Start extends App {
  Kamon.init()

  // Your application code goes here
}
fun main(args: Array<String>) {
  Kamon.init()

  // Your application code goes here
}
  public static void main(String[] args) {
    Kamon.init();

    // Your application code goes here
  }
The initialization process will attach Kanela to the JVM, and find all modules available on the classpath and initialize them.
![]()
For Scala Developers: If you are applying mixins directly on your App companion object, those mixins might cause
initialization of certain classes before the instrumentation is applied. If this is the case, you can either
reorganize your companion object to ensure that the Kamon initialization comes first, or launch your application with
the -javaagent option.
Verify the Installation #
Next time you start your application, Kamon should start the Status Page module included in the bundle, which provides a very convenient way to figure out whether everything is in place or not: just got to localhost:5266 on your browser and something like this should show up:
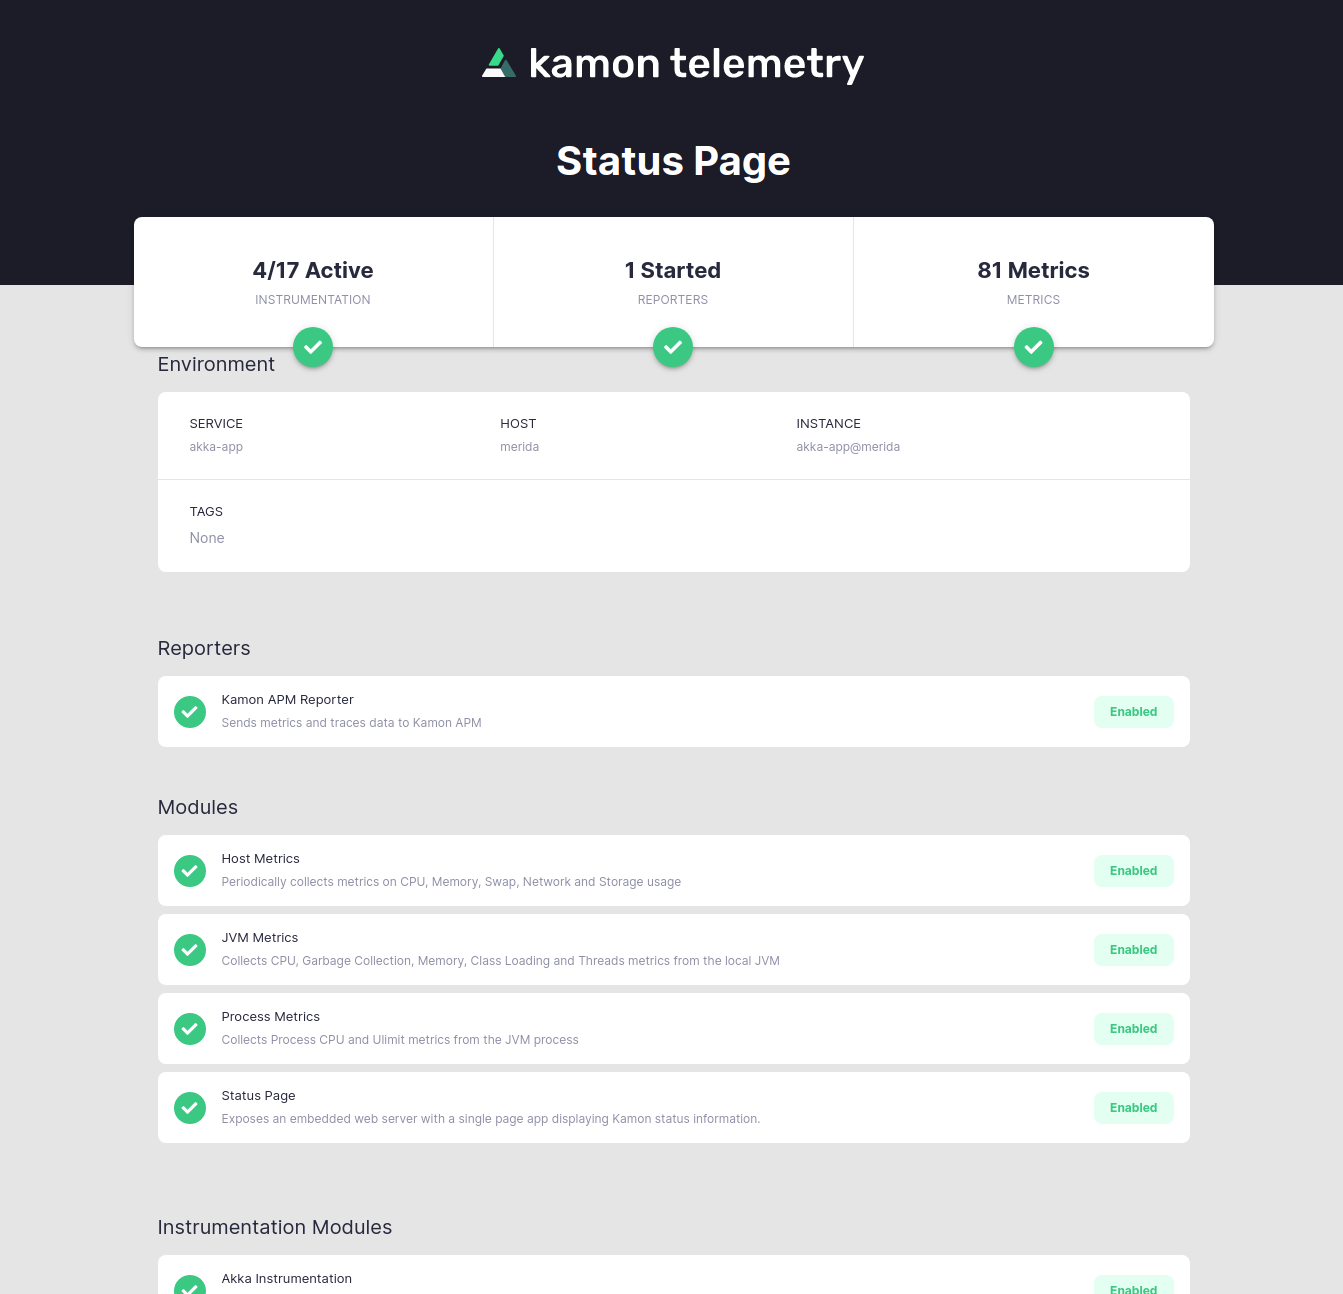
The important bit here is to ensure that modules are loaded and instrumentation is active. As you start adding more and more metrics modules and custom telemetry to Kamon, you will probably be coming back to this page to verify that all is working as expected.
Install Reporters #
At this point, the only thing you are missing is to install some reporters that will take the metrics and trace data collected by Kamon into an external system. Adding a reporter is just about adding the appropriate dependency to your build. For example, if you wanted to add the Kamon APM reporter to your build, just add the appropriate dependency:
libraryDependencies += "io.kamon" %% "kamon-apm-reporter" % "2.5.9"
    <dependency>
      <groupId>io.kamon</groupId>
      <artifactId>kamon-apm-reporter_2.13</artifactId>
      <version>2.5.9</version>
    </dependency>
implementation 'io.kamon:kamon-apm-reporter_2.13:2.5.9'
And that is all, Kamon will automatically pick up the module from the classpath and initialize it during startup! Head over to the Reporters Section to see all available reporters, including the ones for Prometheus, Zipkin, InfluxDB, Datadog and several more!