-
Installation
-
With Kamon Telemetry
-
How To Guides
-
Migrations
-
-
Core Concepts
-
Foundations
-
Advanced
-
-
Instrumentation
-
Supported Frameworks
-
Akka
-
Akka HTTP
-
Cassandra Driver
-
Caffeine
-
Elasticsearch
-
Executors
-
Futures
-
JDBC
-
Kafka
-
Logback
-
Play Framework
-
Spring Framework
-
System Metrics
-
-
-
Reporters
-
Kamon APM
-
Using Kamon APM
-
Overview
-
Services
-
Traces
-
Dashboards
-
Alerts
-
Hosts
-
Investigating Issues
-
Settings and Administration
-
-
Kamon APM #
Overview #
Kamon APM is a hosted monitoring and debugging platform for backend services and APIs, designed from the ground up with one goal in mind: accept all the metrics and tracing data exactly as Kamon Telemetry records it. No averaging, no pre-aggregating, no downsampling of metrics, no data quality loss. This policy of seamless integration with Kamon Telemetry translates into better, accurate and relevant alerts and insight on your application’s behavior.
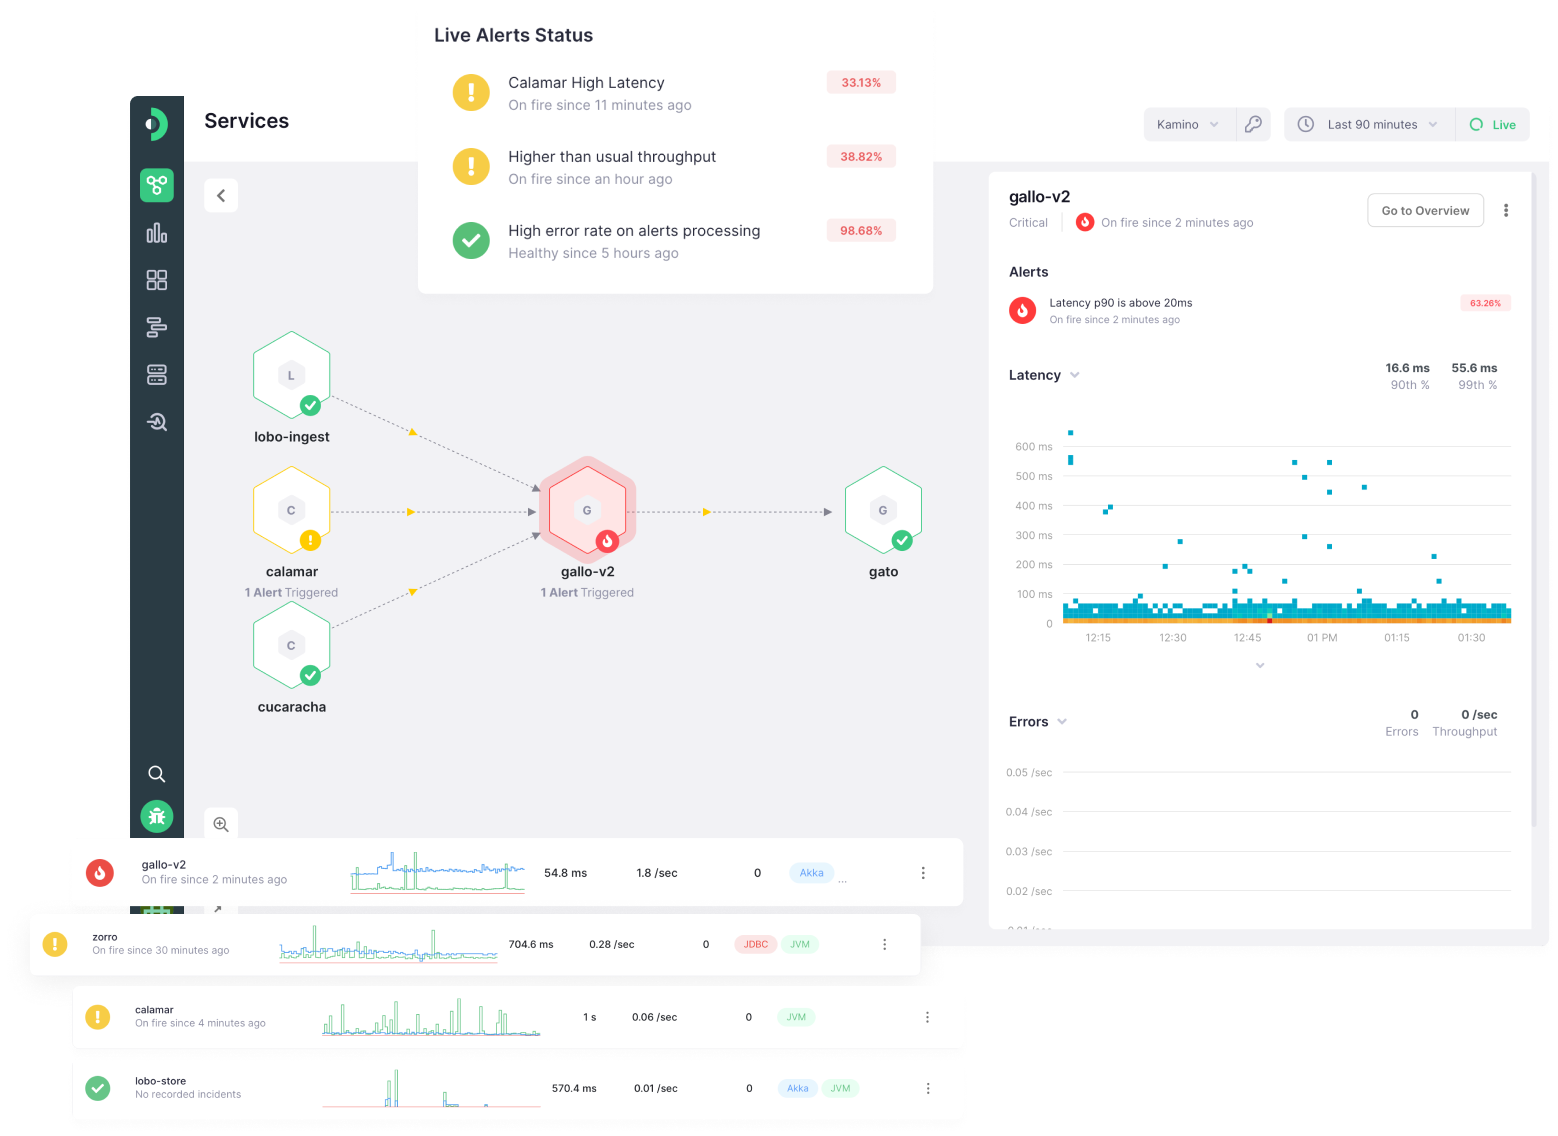
With Kamon APM, you can deep dive into the metrics your services send and get auto-detection of unusual deviations, use traces to analyze performance bottlenecks and errors, see the layout of your microservice architecture using the Service Map. When your system is behaving unusually, you can set up alerts to receive reports to your e-mail, Slack, or elsewhere. If the pre-defined integrations are not enough, you can set up a custom dashboard to visualize any service metric received by the system, as well as host metrics and span processing metrics.
Kamon APM has a deep understanding of JVM metrics, the JDBC, Cassandra, Kafka, and more, integrating perfectly with Kamon Telemetry. It provides an easy way to start monitoring Akka, Play or Spring Boot out of the box, and gives you understanding of your system and a way to discover and solve errors, slowdowns, and other problems. While the product works best with JVM-based services and Kamon Telemetry, but its utility does not end there - with Kamon APM, you can also ingest OpenTelemetry traces to monitor services written in any programming language with OpenTelemetry support!
Getting Started #
You can get started with Kamon APM for free, in just 3 minutes. You can sign up with your e-mail or via Google without having to enter your credit card details. The free Developer plan can be used for free for any duration of time, but will not offer the full range of Kamon APM capabilities. See the list of plans for more details.
Onboarding #
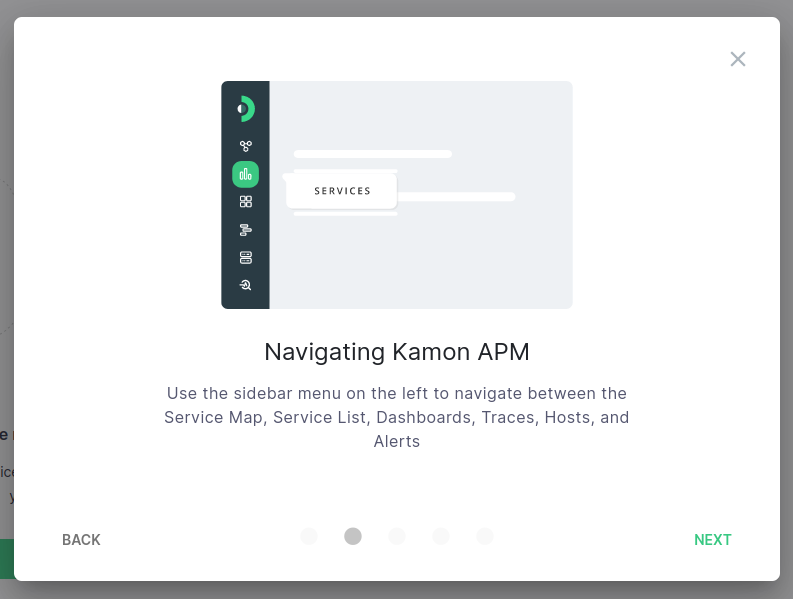
Once you have signed up for Kamon APM, you will immediately be greeted with the welcome carousel dialog, which will showcase the features of Kamon APM. Completing this carousel will be the first step in your onboarding, a process which will guide you through setting up Kamon APM in a way that will enable you to get as much out of it as possible.
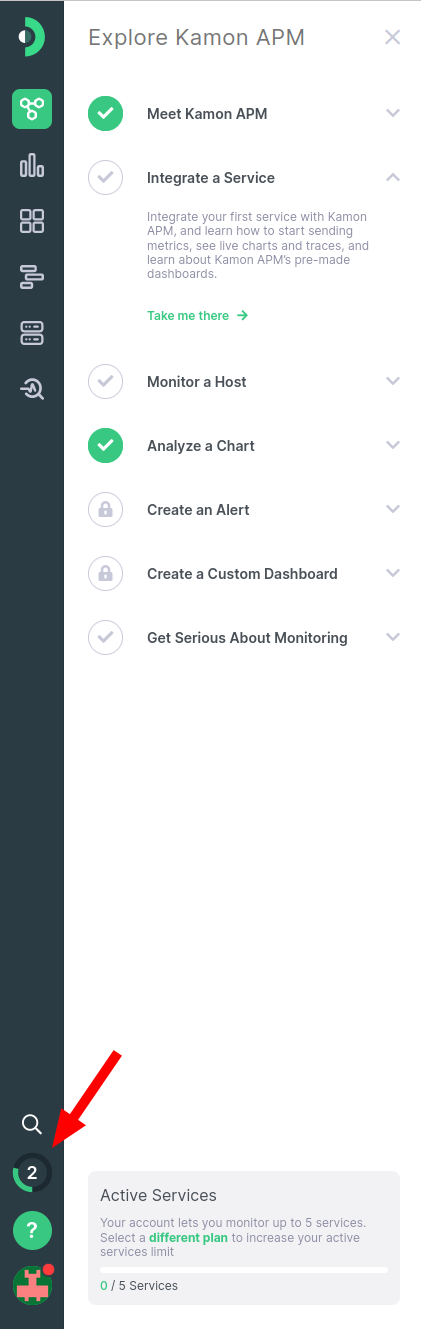
You can continue the process by opening the onboarding sidebar by clicking on the onboarding step counter, located in the application sidebar. Each step will have a name and an indication of whether it is pending, completed, or locked (blocked by some previous step). A step can be expanded by clicking on it to see a description of it, and to preview a call to action to begin completing the step. For the first and last step, this will simply open a straightforward dialog. For the other steps, it will start a walkthrough, which should take you through completing the action.
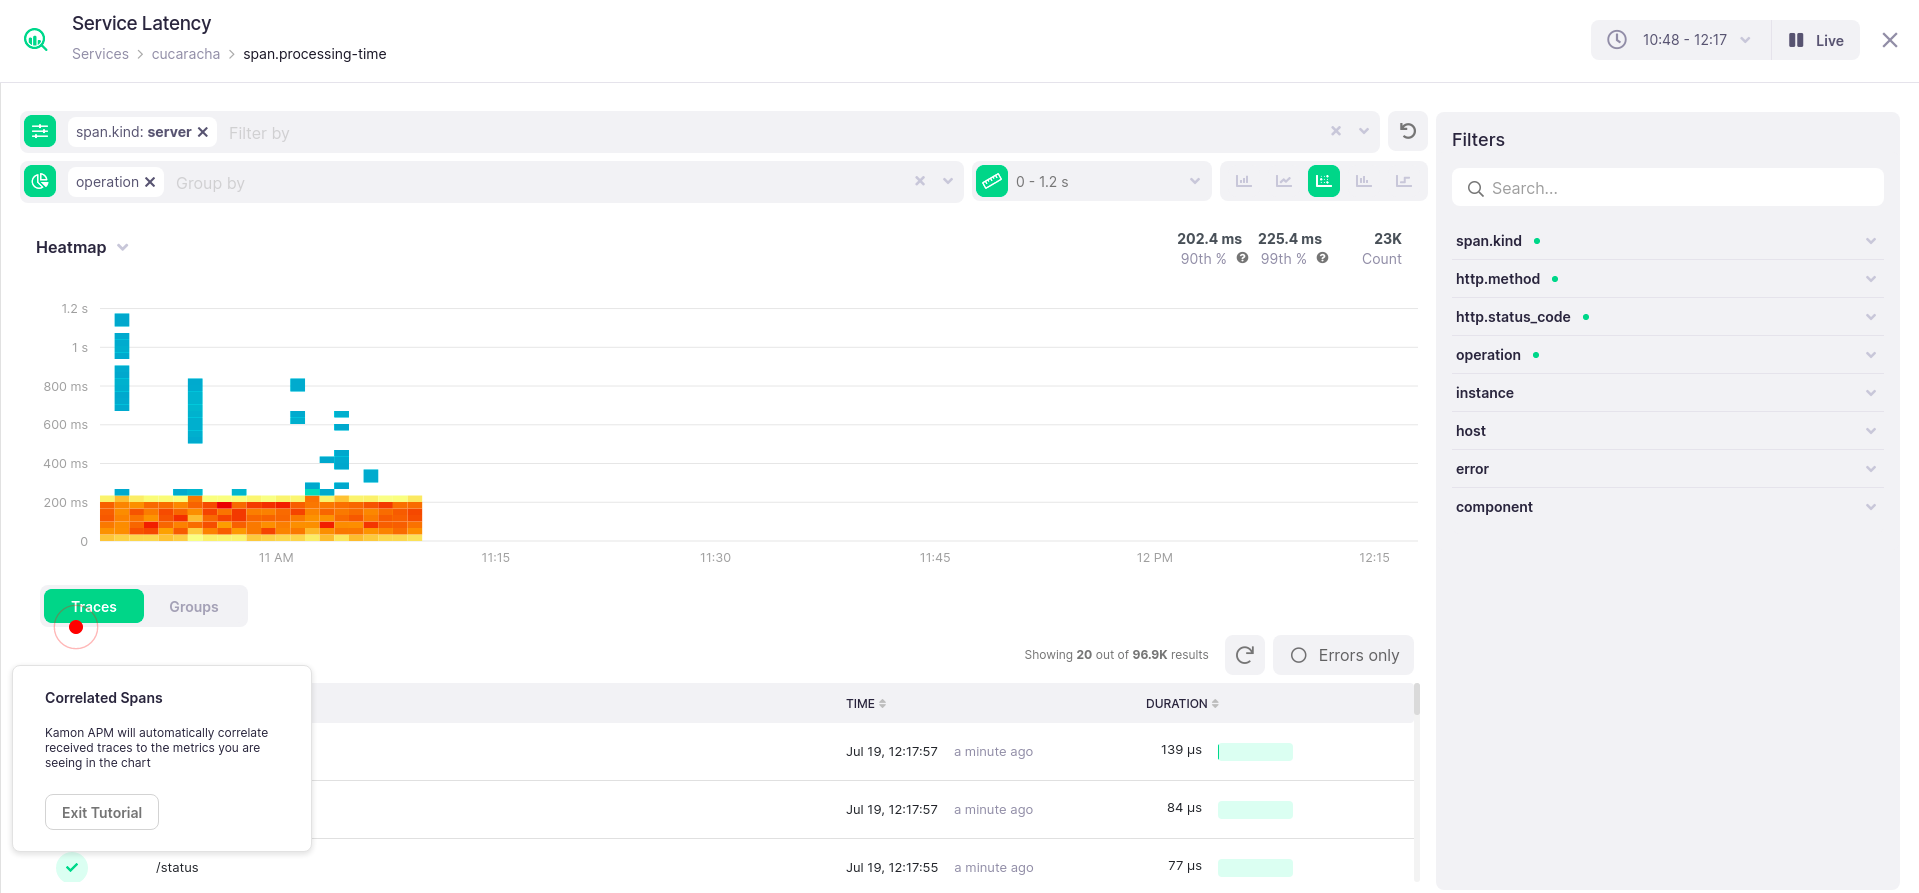
The walkthrough will guide you through the described activity by showing you what to do via a red, pulsating dot. Underneath it, a tooltip will explain the step in more detail. Every step can be completed by clicking on the indicating element. Alternatively, if the tooltip features an x button, the step is merely explanatory and can be completed by closing the tooltip. At any point, you can stop the process, instead of going through with it, by clicking on the “Exit Walkthrough” button in the tooltip.
By the end of each walkthrough, you will have completed the step in question, and the step counter should increase to track your progress as you learn more about Kamon APM.