-
Installation
-
With Kamon Telemetry
-
How To Guides
-
Migrations
-
-
Core Concepts
-
Foundations
-
Advanced
-
-
Instrumentation
-
Supported Frameworks
-
Akka
-
Akka HTTP
-
Cassandra Driver
-
Caffeine
-
Elasticsearch
-
Executors
-
Futures
-
JDBC
-
Kafka
-
Logback
-
Play Framework
-
Spring Framework
-
System Metrics
-
-
-
Reporters
-
Kamon APM
-
Using Kamon APM
-
Overview
-
Services
-
Traces
-
Dashboards
-
Alerts
-
Hosts
-
Investigating Issues
-
Settings and Administration
-
-
JVM Integration #
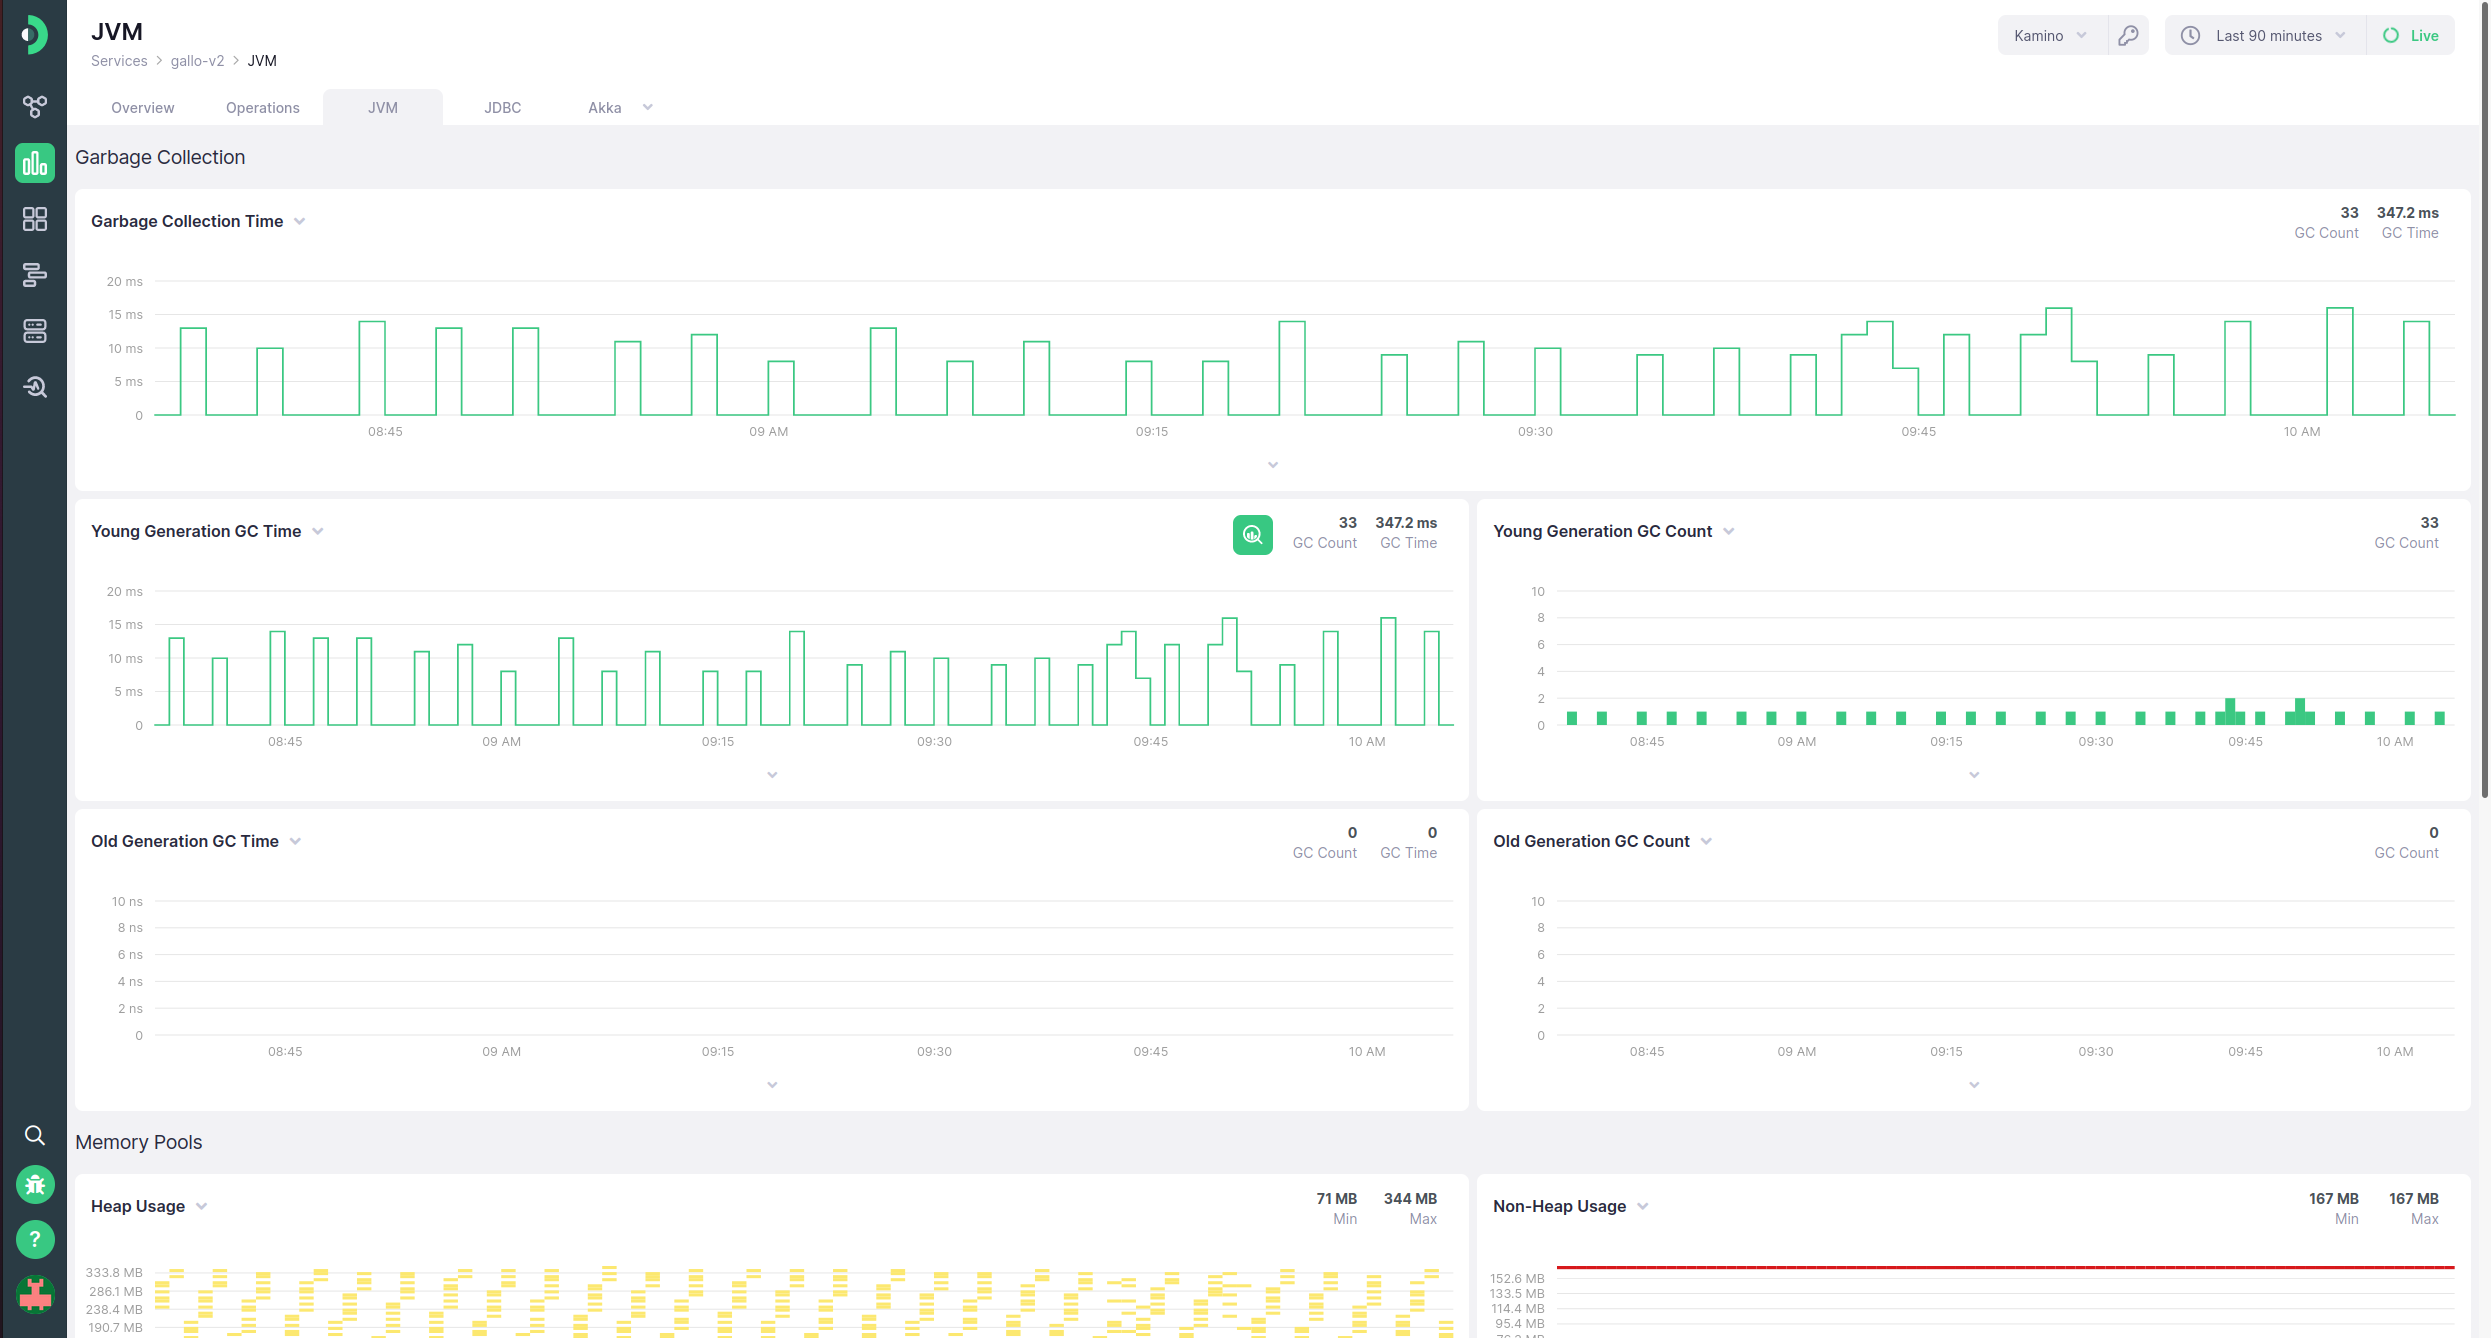
Services running on the JVM and collecting the JVM metrics will have a JVM integration tab, displaying charts with information collected about the Java virtual machine your service is running on. They can be split into three main categories:
The top half of the page displays garbage collection metrics - the duration and number of garbage collection intervals, with an additional split between young and old GC generations. The second section is dedicated to heap and memory usage. Here you can see the memory usage, both in heap and outside of the heap, as well as additional memory allocations in your code and promotions of memory chunks to the old generation. Finally, the third section shows durations of JVM hiccups, as well as their distribution in a percentile chart.
One particular correlation that can be of interest is that between hiccups and garbage collection time. If you have many, or very long, hiccups that do not correlate very well to the garbage collection times, it might mean that there are issues in your host setup, or that other processes are taking up resources that your service running on JVM might make better use of instead.
The JDBC integration can be access from the service overview page, where a JVM tab will appear on the top of the page if the integration is detected.
![]()
JVM integration dashboards are a feature exclusive to Kamon Telemetry. If you use OpenTelemetry with a service running on the JVM, you will not have access to this dashboard.