-
Installation
-
With Kamon Telemetry
-
How To Guides
-
Migrations
-
-
Core Concepts
-
Foundations
-
Advanced
-
-
Instrumentation
-
Supported Frameworks
-
Akka
-
Akka HTTP
-
Cassandra Driver
-
Caffeine
-
Elasticsearch
-
Executors
-
Futures
-
JDBC
-
Kafka
-
Logback
-
Play Framework
-
Spring Framework
-
System Metrics
-
-
-
Reporters
-
Kamon APM
-
Using Kamon APM
-
Overview
-
Services
-
Traces
-
Dashboards
-
Alerts
-
Hosts
-
Investigating Issues
-
Settings and Administration
-
-
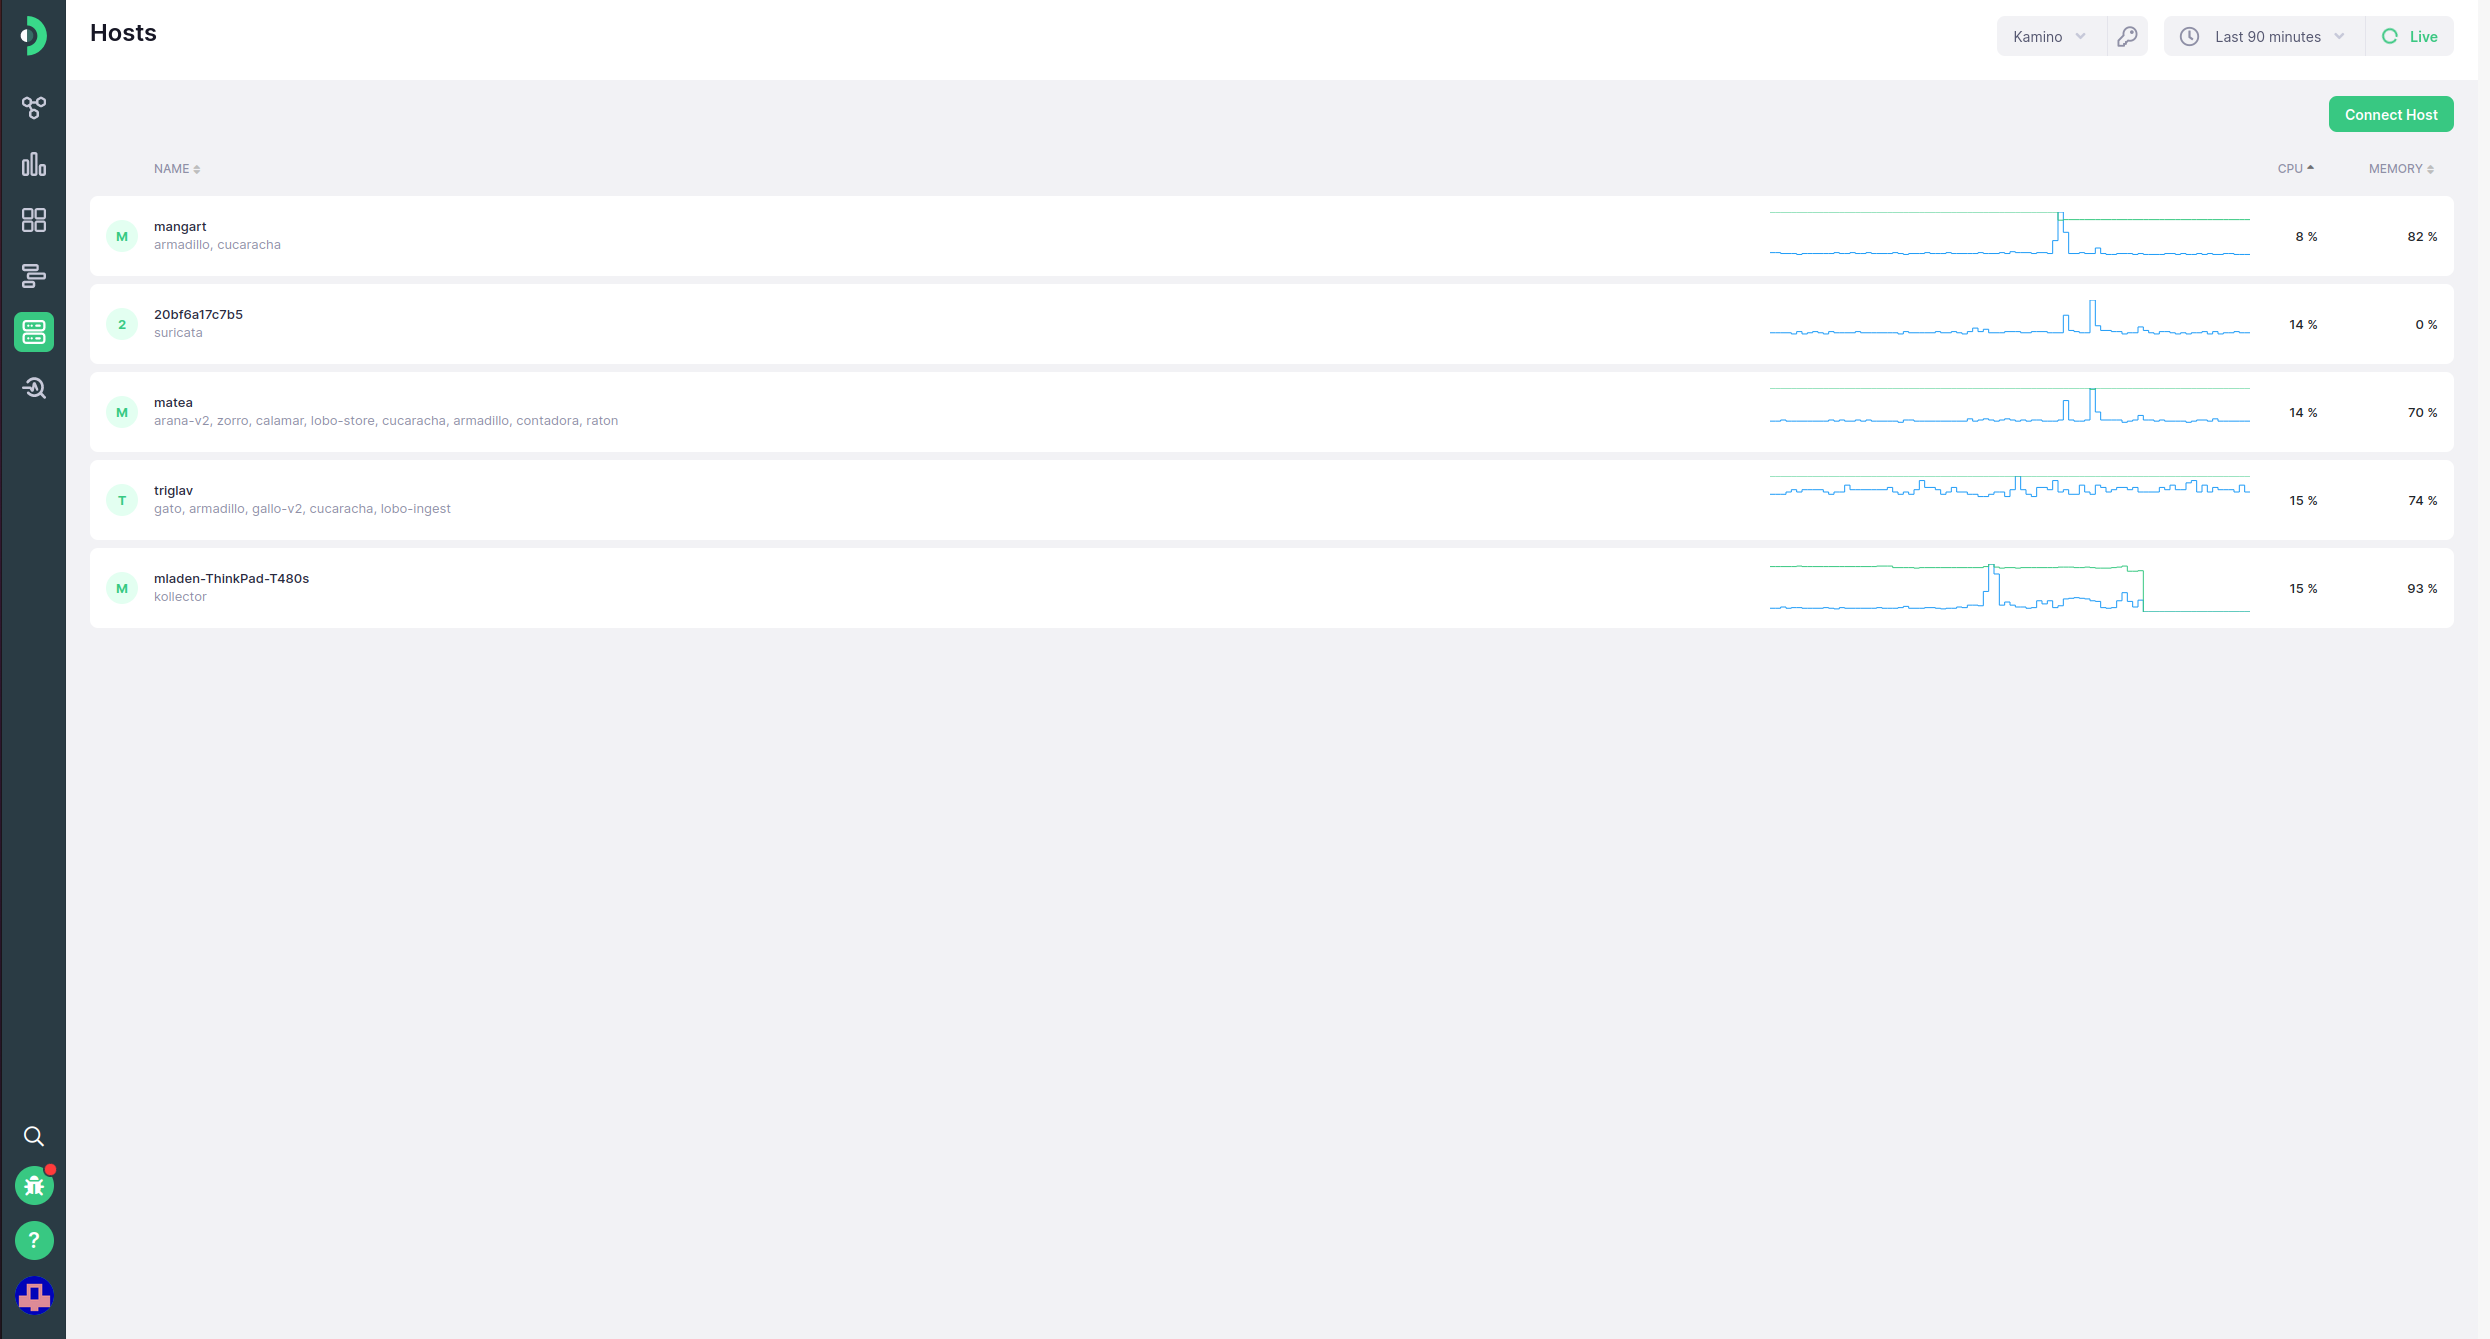
Host List #
With the Host List, you can get a quick overview of the status of your service hosts, in a tabular format. Each row of the table represents one host, listing its name, the services hosted on it, and its CPU usage (p90) and memory usage percentage. Both of these metrics are also represented in a sparkline. When hovering on the appropriate numerical representation of the metric, the sparkline in question will be highlighted. The values in the sparkline correspond to the time period selected in the time picker. Clicking on any of the rows will take you to the host details page for that host.
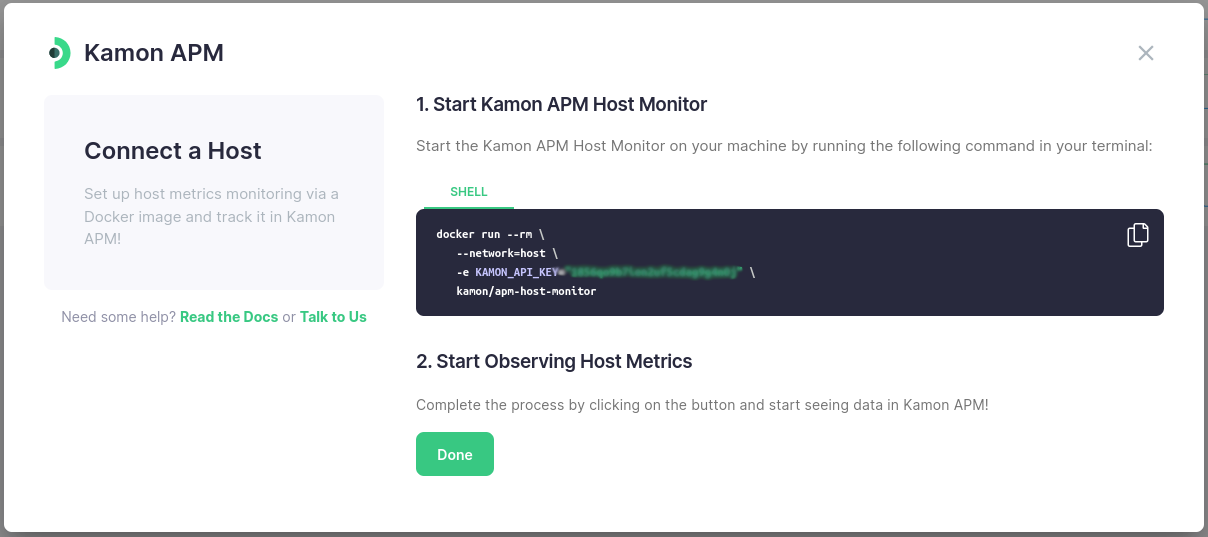
Connect Host #
You can connect new hosts to Kamon APM by initializing the Host Monitor for that host machine. It’s a simple matter of clicking on the Connect Host button, in the top right, and following the instructions in the dialog.