-
Installation
-
With Kamon Telemetry
-
How To Guides
-
Migrations
-
-
Core Concepts
-
Foundations
-
Advanced
-
-
Instrumentation
-
Supported Frameworks
-
Akka
-
Akka HTTP
-
Cassandra Driver
-
Caffeine
-
Elasticsearch
-
Executors
-
Futures
-
JDBC
-
Kafka
-
Logback
-
Play Framework
-
Spring Framework
-
System Metrics
-
-
-
Reporters
-
Kamon APM
-
Using Kamon APM
-
Overview
-
Services
-
Traces
-
Dashboards
-
Alerts
-
Hosts
-
Investigating Issues
-
Settings and Administration
-
-
InfluxDB Reporter #
InfluxDB is an open source time series database developed by InfluxData. It is written in Go and optimized for fast, high-availability storage and retrieval of time series data in fields such as operations monitoring, application metrics, Internet of Things sensor data, and real-time analytics.
Installation and Startup #
libraryDependencies += "io.kamon" %% "kamon-influxdb" % "2.5.9"
    <dependency>
      <groupId>io.kamon</groupId>
      <artifactId>kamon-influxdb_2.13</artifactId>
      <version>2.5.9</version>
    </dependency>
implementation 'io.kamon:kamon-influxdb_2.13:2.5.9'
Once the reporter is on your classpath it will be automatically picked up by Kamon.
Integration Notes #
This module sends all the metrics data to InfluxDB over HTTP. Kamon metric names will become InfluxDB’s “measurement name”, all tags will be transmitted unchanged and depending on the metric type, the following fields will be added:
- Counters will be reported with a single
countfield. - Gauges will be reported with a single
valuefield. - Histograms and Range Samplers will be reported with
count,sum,min,maxandpXXfields, where each of thepXXfields represent a percentile for the given distribution of values. These percentiles can be configured using thekamon.influxdb.percentilessetting.
Authentication #
This reporter doesn’t use any authentication mechanism out of the box, but you can add Basic or Token authentication with these settings:
kamon.influxdb {
  authentication {
    token = "your_api_token"

#     // OR

    user = "user"
    password = "password"
  }
}
Configuration #
These are all the configuration setting available for the InfluxDB reporter:
kamon.influxdb {

  # Hostname and port in which your InfluxDB is running
  hostname = "127.0.0.1"
  port = 8086

  # The database where to write in InfluxDB.
  database = "mydb"

  # For histograms, which percentiles to count
  percentiles = [50.0, 70.0, 90.0, 95.0, 99.0, 99.9]

  # The protocol to use when used to connect to your InfluxDB: HTTP/HTTPS
  protocol = "http"
  # Whether or not to submit distributions with count = 0 to influxdb (with 0 values)
  post-empty-distributions = false

  # The precision to report the period timestamp in. Corresponds with what influx will accept, minus hours and minutes
  # [ns,u,µ,ms,s]
  precision = "s"

  # Client authentication credentials for connection to the InfluxDB server. There is no authentication by default.
  # You can enable authentication by adding an authentication section to your configuration file with either token or
  # user/password settings in it. If you specify both, token authentication will be used.
  #
  #   authentication {
  #     token = "your_api_token"
  #
  #     // OR
  #
  #     user = "user"
  #     password = "password"
  #
  #   }

  # Allow including environment information as tags on all reported metrics.
  environment-tags {

    # Define whether specific environment settings will be included as tags in all exposed metrics. When enabled,
    # the service, host and instance tags will be added using the values from Kamon.environment().
    include-service = yes
    include-host = yes
    include-instance = yes

    # Specifies which Kamon environment tags should be ignored. All unmatched tags will be always added to al metrics.
    exclude = []
  }

  tag-filter {
    includes = ["**"]
    excludes = []
  }
}
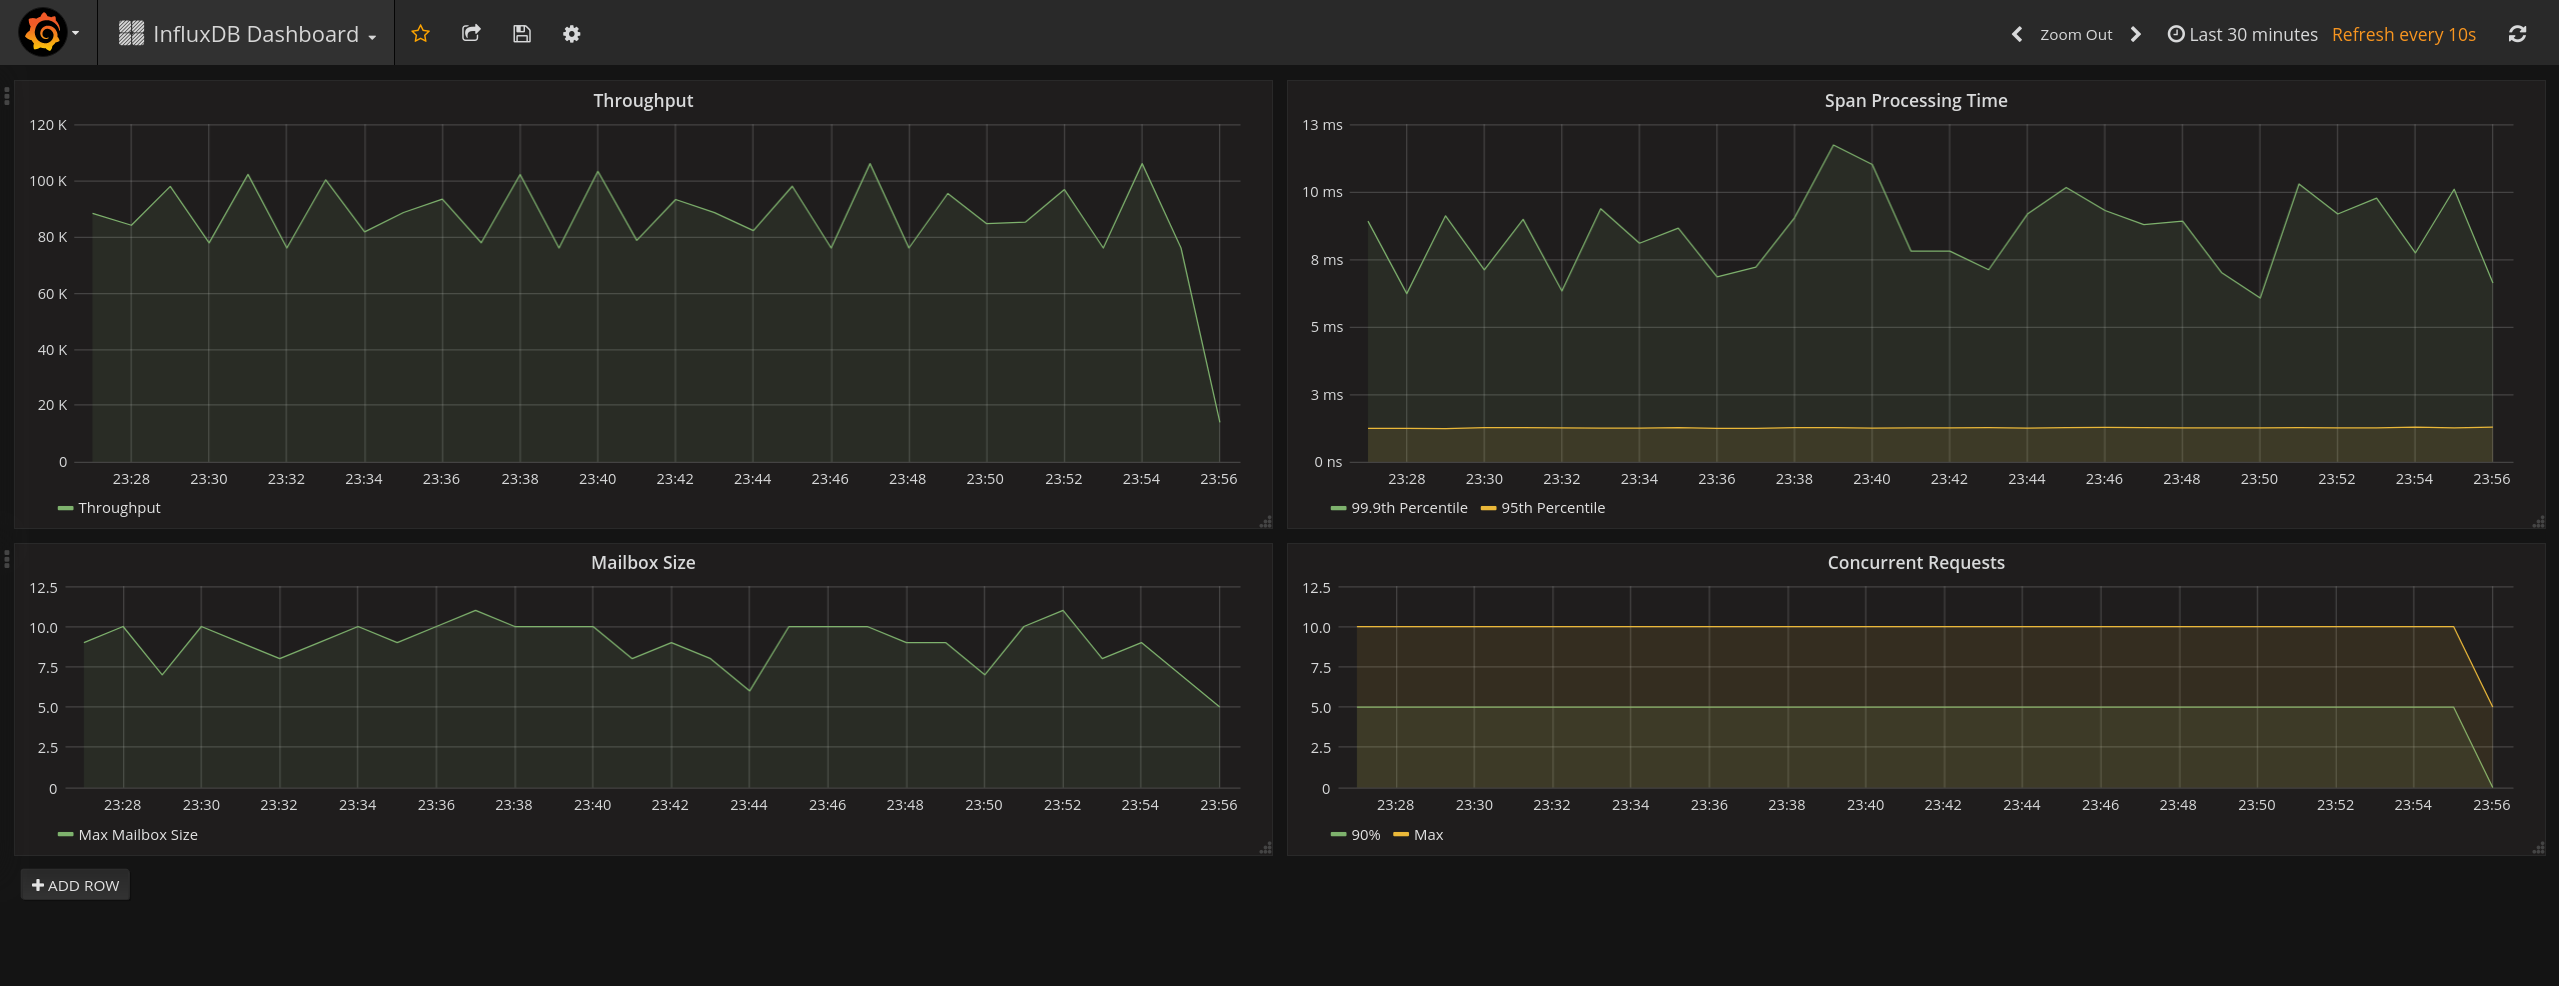
Teasers #
Here is a simple example showing some Actor and Span metrics using InfluxDB and Grafana together: