-
Installation
-
With Kamon Telemetry
-
How To Guides
-
Migrations
-
-
Core Concepts
-
Foundations
-
Advanced
-
-
Instrumentation
-
Supported Frameworks
-
Akka
-
Akka HTTP
-
Cassandra Driver
-
Caffeine
-
Elasticsearch
-
Executors
-
Futures
-
JDBC
-
Kafka
-
Logback
-
Play Framework
-
Spring Framework
-
System Metrics
-
-
-
Reporters
-
Kamon APM
-
Using Kamon APM
-
Overview
-
Services
-
Traces
-
Dashboards
-
Alerts
-
Hosts
-
Investigating Issues
-
Settings and Administration
-
-
Managing Dashboards #
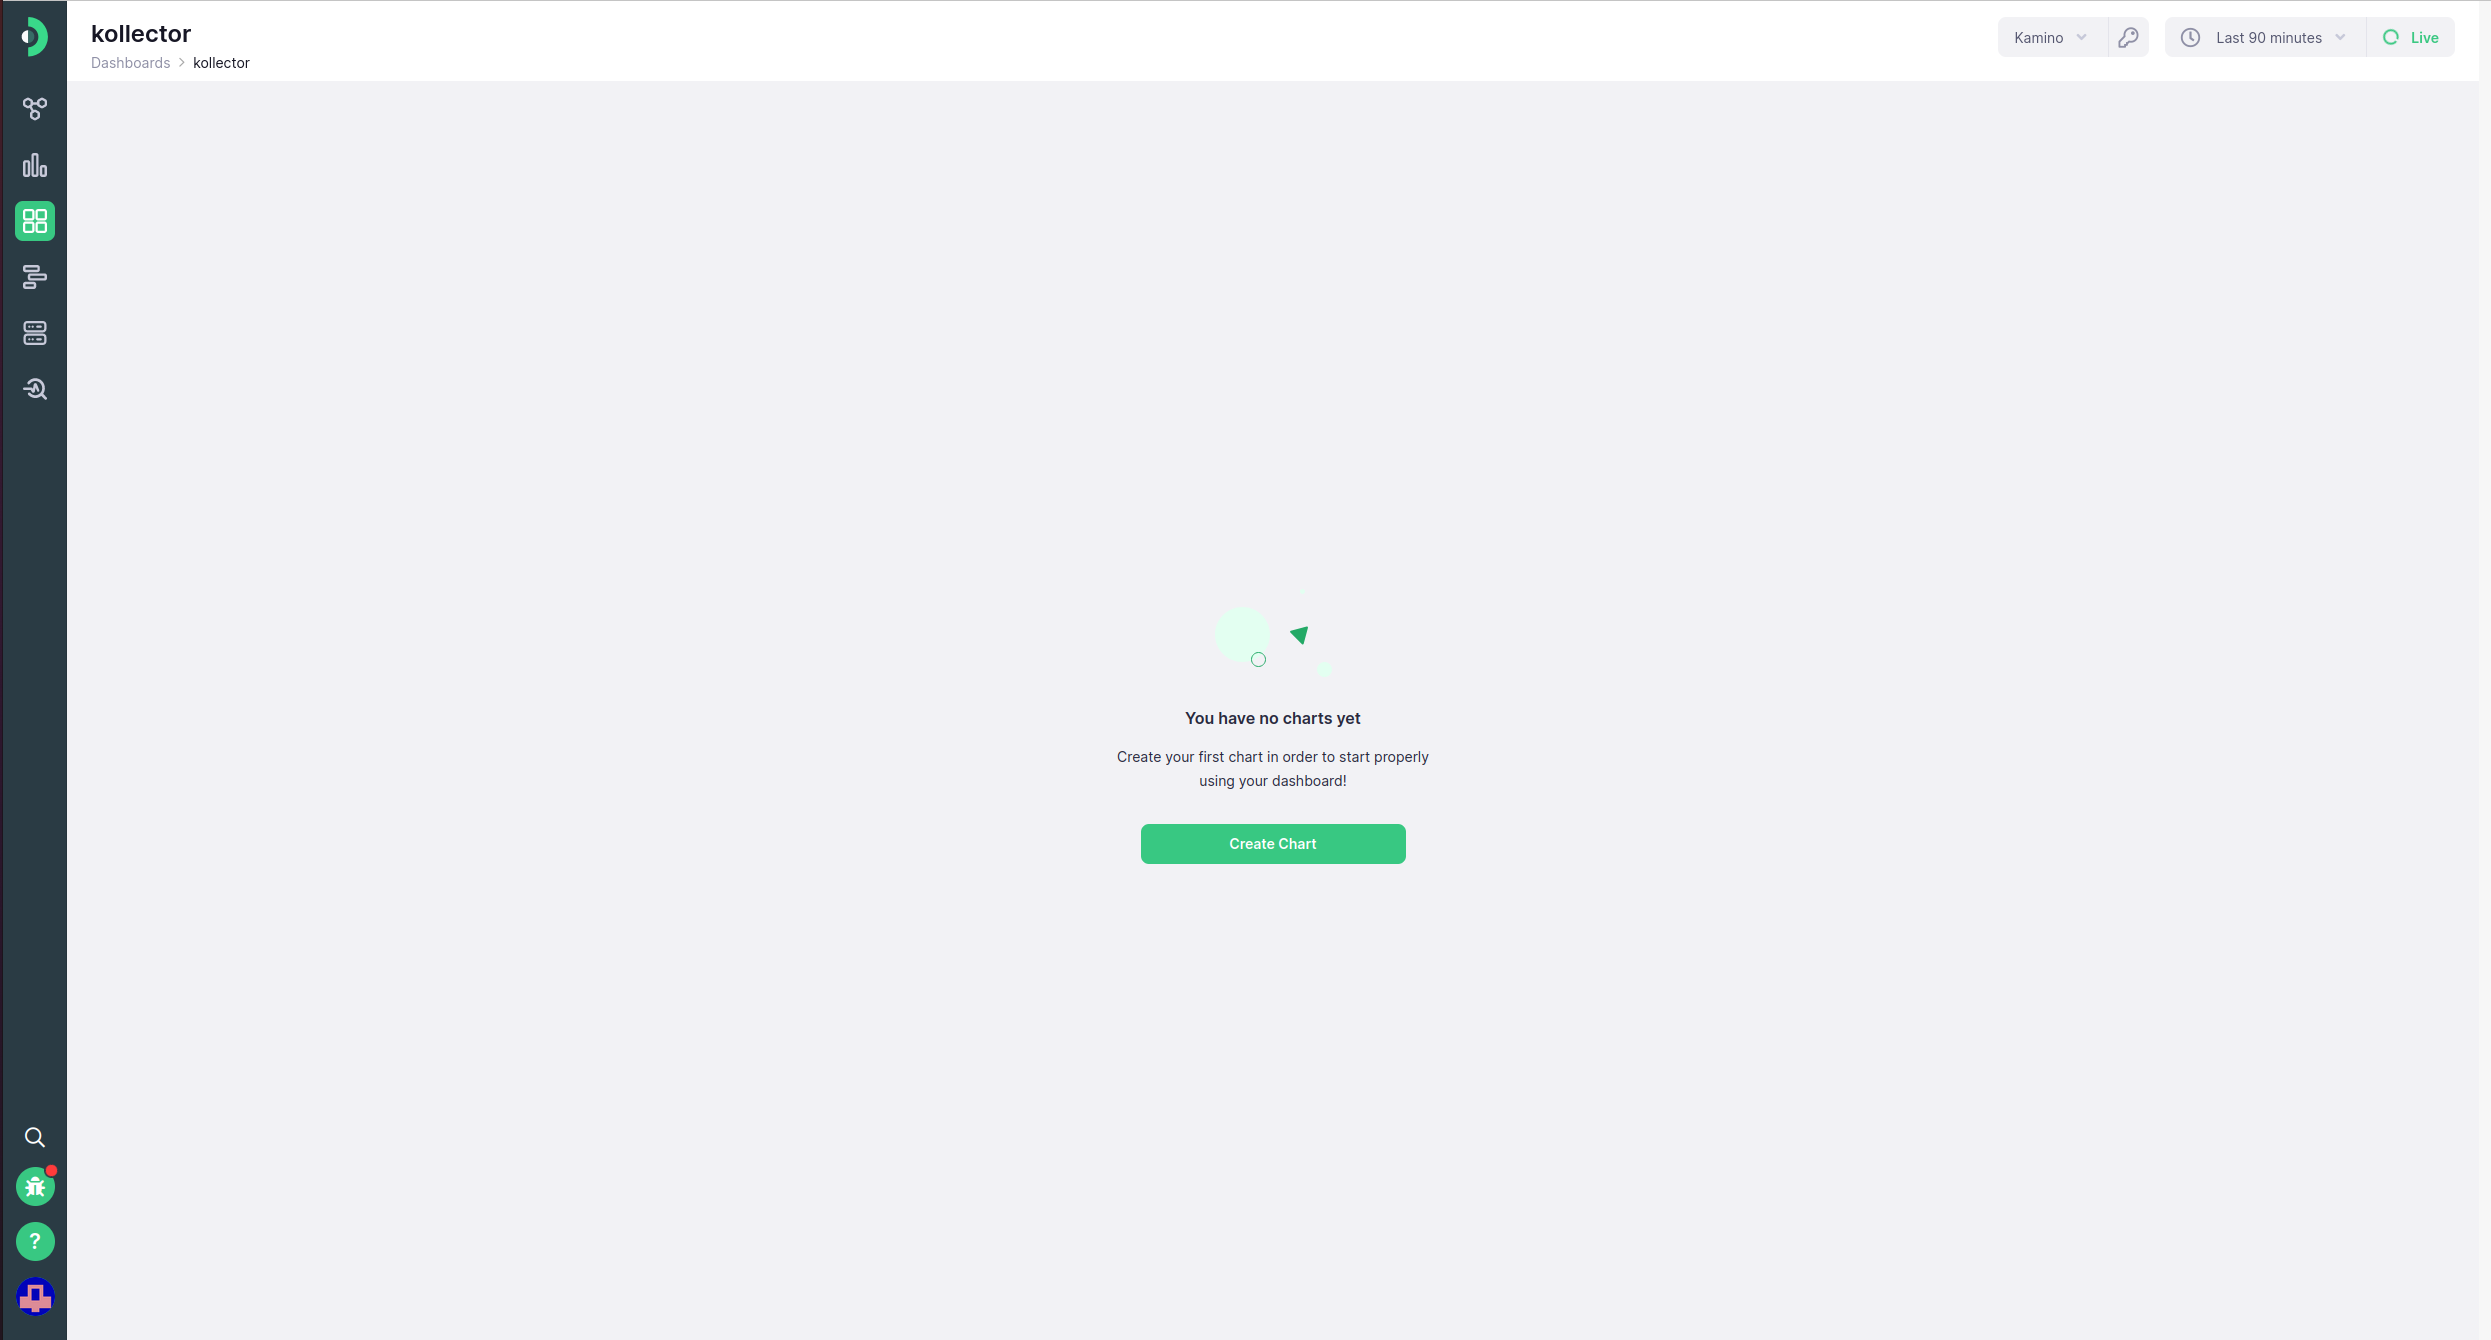
When you create your first dashboard, it will most likely be empty. You will need to create dashboard charts to start populating your dashboard. Once you have added some charts to your dashboard, you will be able to perform additional actions on them, available only for custom dashboards. On a dashboard with charts present, an Add Chart button will always be available in the top right of the dashboard.
Any chart can be resized by clicking and dragging the resize toggle in the bottom right of the chart. There are a number of pre-determined sizes your charts can take, and they will automatically align themselves to the nearest size as you drag. Note that charts will not visualize their data during the dragging, and will instead revert to the placeholder state. The data will be re-drawn only when the resize action has completed. Furthermore, if you have multiple charts, you can drag them to re-arrange, by using the drag handle in the top right of the chart. When hovering over the indicator, the cursor will change to the drag cursor, to indicate that this action is possible. When dragging, a gray preview area will indicate where the chart will be placed if you stop dragging it by releasing it.
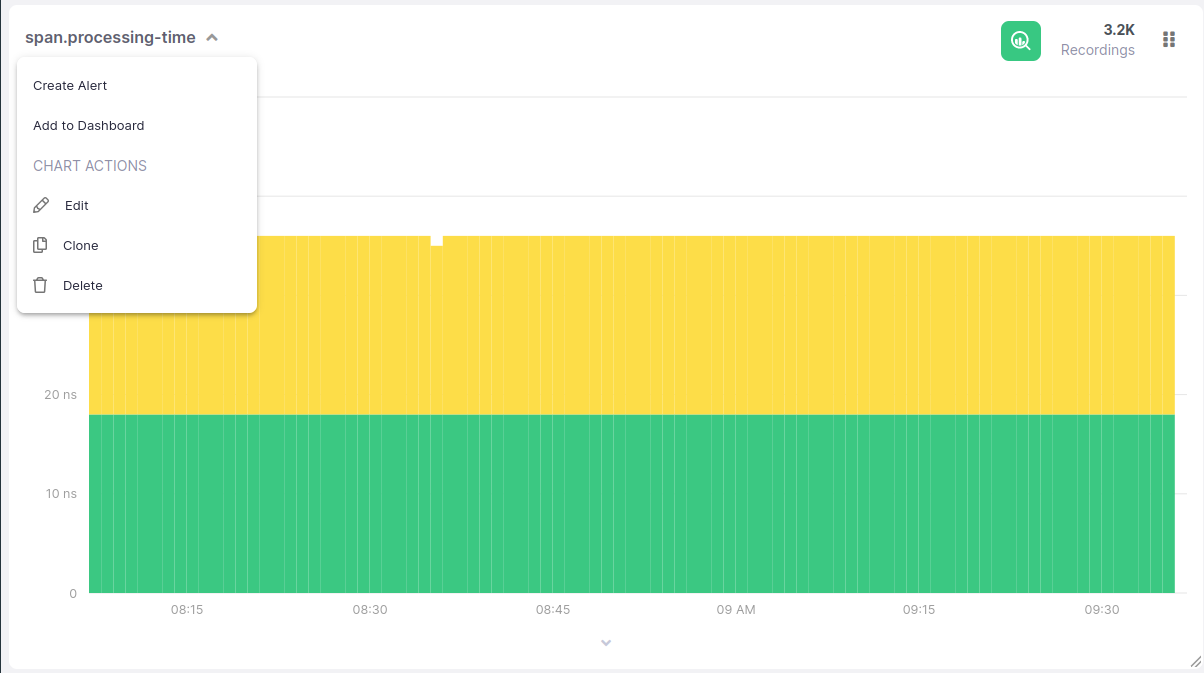
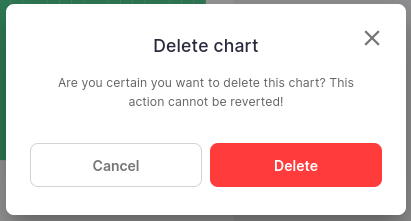
In addition the the regular chart actions, dashboard charts will have three more actions in the chart action menu, toggled by clicking on its title. You will be able to edit the chart, clone it, or delete the chart from the dashboard. Read more about cloning and editing in the adding charts documentation. The delete action will remove the chart from the dashboard, after prompting for confirmation.
![]()
Deleting dashboard charts is a permanent action that cannot be reverted. Make sure you really no longer need the chart, or have backed it up in another dashboard.
Chart Placeholder State #
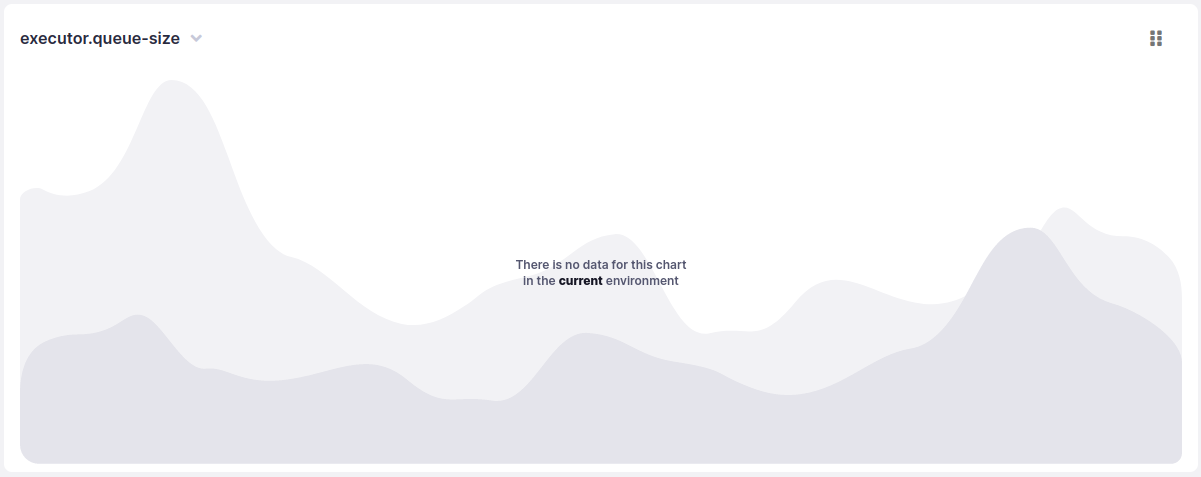
In some cases, charts might stop displaying and instead fall back to a placeholder state. This can happen due to one of two reasons:
- The chart was set up for another environment, and the service does not exist in this environment
- The metric shown no longer exists (e.g., you’ve changed Kamon versions, or stopped sending a custom metric)
Environment Locked Charts #
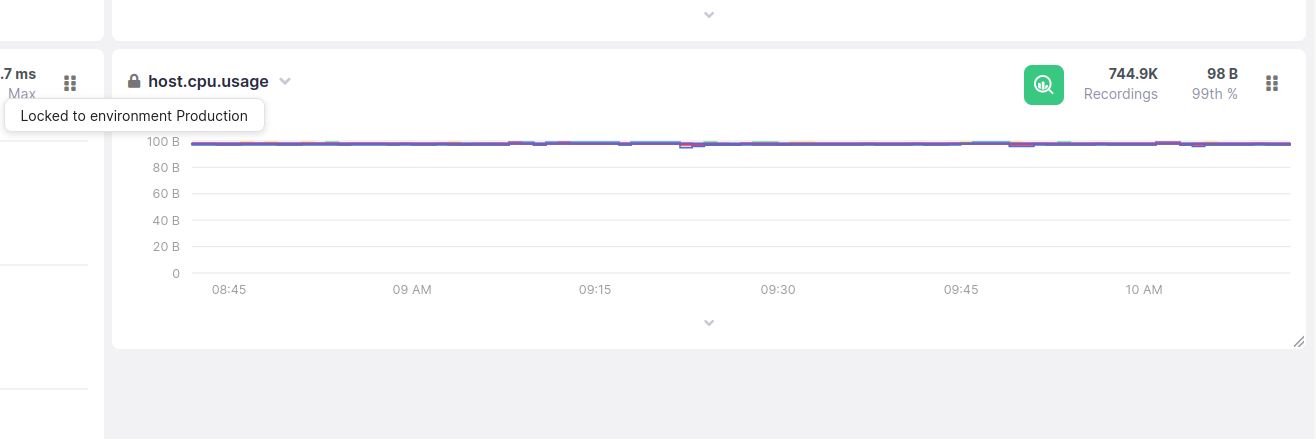
When a dashboard is locked to a certain environment, a lockpad icon will be shown to the left of its chart title. When this is the case, the chart will always show data for that environment, even if you change it in the environment picker. You can hover over the icon to learn which environment it is locked to. Read about creating dashboard chart to learn more about locking a chart to an environment.