-
Installation
-
With Kamon Telemetry
-
How To Guides
-
Migrations
-
-
Core Concepts
-
Foundations
-
Advanced
-
-
Instrumentation
-
Supported Frameworks
-
Akka
-
Akka HTTP
-
Cassandra Driver
-
Caffeine
-
Elasticsearch
-
Executors
-
Futures
-
JDBC
-
Kafka
-
Logback
-
Play Framework
-
Spring Framework
-
System Metrics
-
-
-
Reporters
-
Kamon APM
-
Using Kamon APM
-
Overview
-
Services
-
Traces
-
Dashboards
-
Alerts
-
Hosts
-
Investigating Issues
-
Settings and Administration
-
-
Monitoring Spring Boot Applications with Kamon #
This guide walks you through setting up Kamon with a Spring Boot application and sending your first metrics and traces to Kamon APM. The same steps will work if you choose any other reporter.
1. Add the Kamon Dependencies #
Add the kamon-bundle and kamon-apm-reporter dependencies to your pom.xml file (or equivalent for other build
tools):
        <!--
            Ensure that the Scala version suffix (2.13 in this case)
            matches all your Scala dependencies, if you have any.
        -->

        <dependency>
            <groupId>io.kamon</groupId>
            <artifactId>kamon-bundle_2.13</artifactId>
            <version>2.5.9</version>
        </dependency>
        <dependency>
            <groupId>io.kamon</groupId>
            <artifactId>kamon-apm-reporter_2.13</artifactId>
            <version>2.5.9</version>
        </dependency>
    // Ensure that the Scala version suffix (2.13 in this case)
	// matches all your Scala dependencies, if you have any.

    implementation "io.kamon:kamon-bundle_2.13:2.5.9"
    implementation "io.kamon:kamon-apm-reporter_2.13:2.5.9"
The Kamon Bundle dependency contains all the Kamon automatic instrumentation modules in a single jar, so that you don’t need any additional dependencies. The APM reporter dependency is in charge of sending all your metrics and traces to Kamon APM.
2. Initialize Kamon #
Call Kamon.init() as the first thing in your main method:
import kamon.Kamon;

@SpringBootApplication
public class SpringBootExample {

	public static void main(String[] args) {
		Kamon.init();
		SpringApplication.run(SpringBootExample.class, args);
	}
}
The call to Kamon.init() installs the automatic instrumentation on the JVM and starts sending data to Kamon APM (and
any other reporters you might have). It is very important that the call to Kamon.init() happens before initializing
the Spring Boot classes, otherwise some parts of your application might not be processed by the automatic
instrumentation.
![]()
You can start your applications with the -javaagent JVM option if you
can’t ensure that the call to Kamon.init() will be the first thing in your main method.
3. Configure the APM Reporter #
Add your service name and API key to the resources/application.conf file:
kamon {
  environment.service = "Spring Boot App"
  apm.api-key = "Your API Key"
}
You can copy your API key directly from Kamon APM.
Verifying the Installation #
Next time your application starts, Kamon should be up and running as well! Open http://localhost:5266/ in your browser and you’ll find the Kamon Status Page. It should look like this:
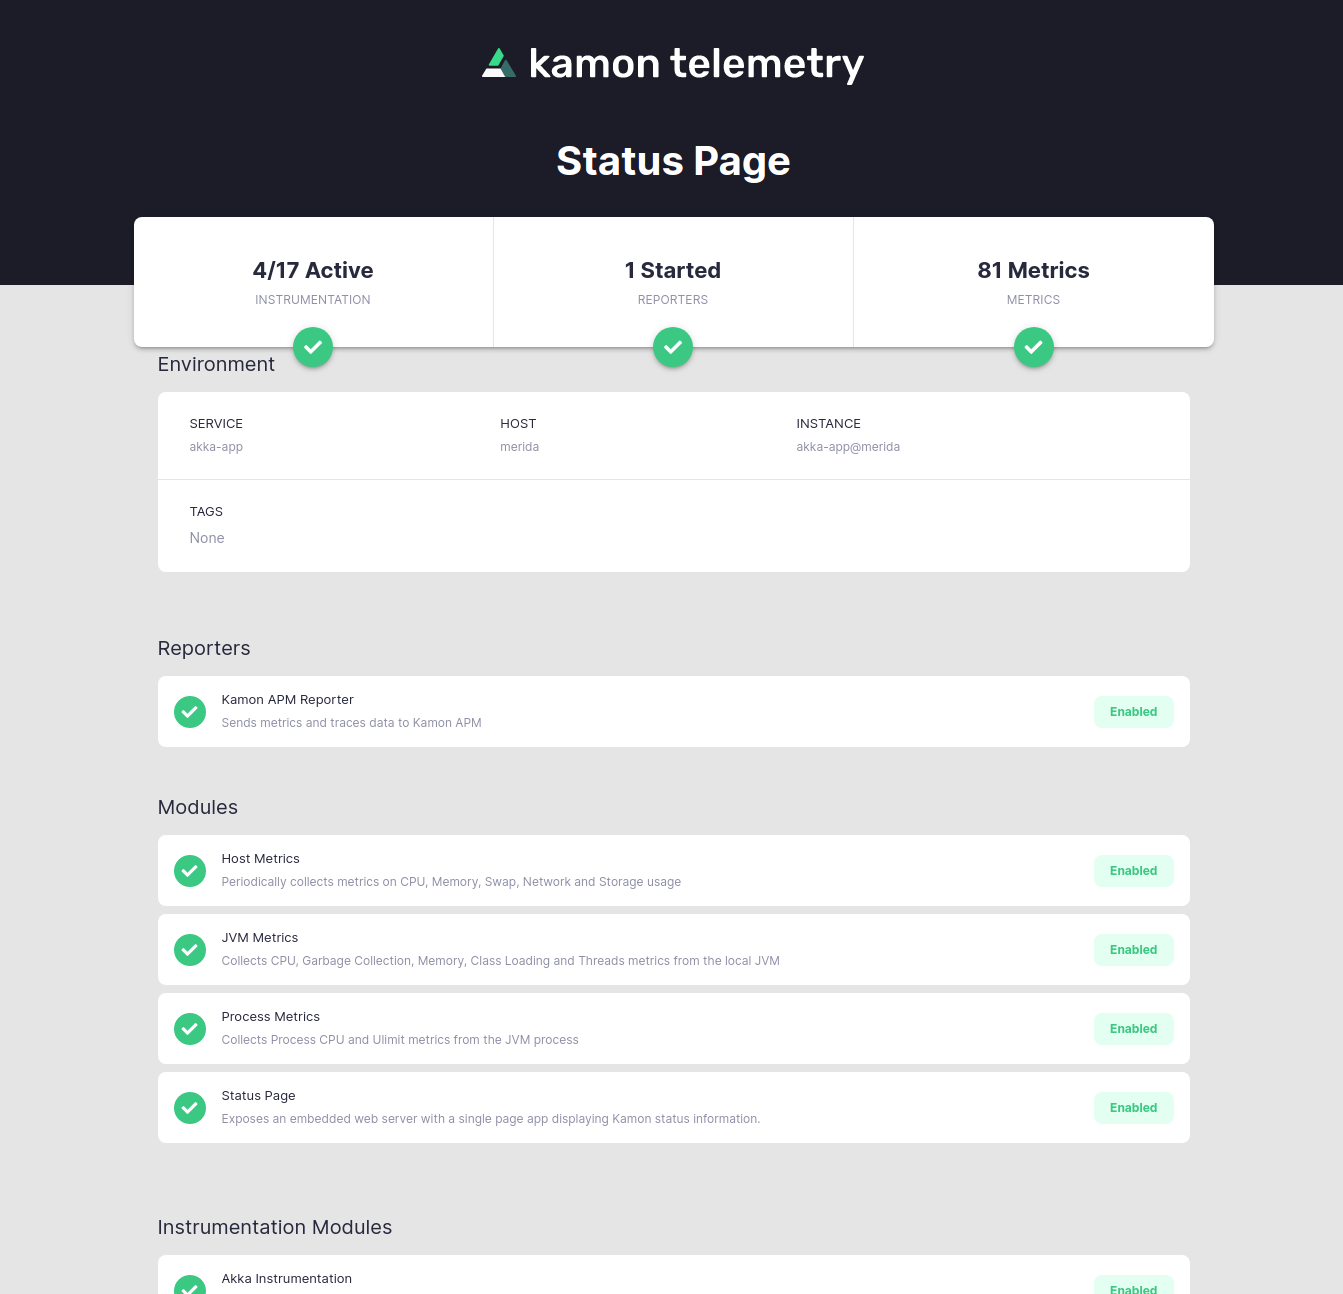
The important bits to check in the Status Page are that the modules have a green check mark and instrumentation is shown as active on the top-left corner. If your installation didn’t go well, please stop by our Github Discussions and post a question. We will do our best to help!
That is it, your installation is done! You might want to check out the How To Guides for common post-installation steps to improve your instrumentation.