-
Installation
-
With Kamon Telemetry
-
How To Guides
-
Migrations
-
-
Core Concepts
-
Foundations
-
Advanced
-
-
Instrumentation
-
Supported Frameworks
-
Akka
-
Akka HTTP
-
Cassandra Driver
-
Caffeine
-
Elasticsearch
-
Executors
-
Futures
-
JDBC
-
Kafka
-
Logback
-
Play Framework
-
Spring Framework
-
System Metrics
-
-
-
Reporters
-
Kamon APM
-
Using Kamon APM
-
Overview
-
Services
-
Traces
-
Dashboards
-
Alerts
-
Hosts
-
Investigating Issues
-
Settings and Administration
-
-
Datadog Reporter #
Datadog is a monitoring service for IT, Operations and Development teams who write and run applications at scale.
Installation #
libraryDependencies += "io.kamon" %% "kamon-datadog" % "2.5.9"
    <dependency>
      <groupId>io.kamon</groupId>
      <artifactId>kamon-datadog_2.13</artifactId>
      <version>2.5.9</version>
    </dependency>
implementation 'io.kamon:kamon-datadog_2.13:2.5.9'
Once the reporter is on your classpath it will be automatically picked up by Kamon. This dependency ships with three modules:
-
datadog-agent(enabled: true) Sends metrics data to the Datadog Agent via UDP. -
datadog-trace-agent(enabled: true) Sends spans data to the Datadog Trace Agent via HTTP. -
datadog-api(enabled: false) Sends metrics data directly to the Datadog public API.
If you want to control which modules are started by default just change the enabled setting for the appropriate module.
kamon {
  modules {
    datadog-agent {
      enabled = true
    }

    datadog-trace-agent {
      enabled = true
    }

    datadog-api {
      enabled = false
    }
  }
}
Agent Reporter #
By default, the Agent reporter assumes that you have an instance of the Datadog Agent running in localhost and listening on port 8125. You can configure specific details for the agent reporter with these configuration settings:
kamon {
  datadog {

    #
    # Settings relevant to the DatadogAgentReporter
    #
    agent {

      # Hostname and port in which your dogstatsd is running (if not using
      # the API). Remember that Datadog packets are sent using UDP and
      # setting unreachable hosts and/or not open ports wont be warned
      # by the Kamon, your data wont go anywhere.
      hostname = "127.0.0.1"
      port = 8125

      # Max packet size for UDP metrics data sent to Datadog.
      max-packet-size = 1024 bytes
      measurement-formatter = "default"
      packetbuffer = "default"
    }
  }
}
Trace Agent Reporter #
The Trace Agent reporter is also started by default and assumes that it can reach the agent locally. These are the settings relevant to the Trace Agent reporter:
kamon {
  datadog {

    #
    # Settings relevant to the DatadogSpanReporter
    #
    trace {

      # Default to trace agent URL
      # See: (https://docs.datadoghq.com/api/?lang=python#tracing)
      api-url = "http://localhost:8126/v0.4/traces"

      # FQCN of the "kamon.datadog.KamonDataDogTranslator" implementation
      # that will convert Kamon Spans into Datadog Spans, or "defult" to
      # use the built-in translator.
      translator = "default"

      # HTTP client timeout settings:
      #   - connect-timeout: how long to wait for an HTTP connection
      #     to establish before failing the request.
      #   - read-timeout: how long to wait for a read IO operation
      #     to complete before failing the request.
      #   - write-timeout: how long to wait for a write IO operation
      #     to complete before failing the request.
      #
      connect-timeout = 5 seconds
      read-timeout = 5 seconds
      write-timeout = 5 seconds
    }
  }
}
API Reporter #
When using the API reporter you must configure your API key using the kamon.datadog.http.api-key configuration setting.
Since Kamon has access to the entire distribution of values for a given period, the API reporter can directly post the
data that would otherwise be summarized and sent by the Datadog Agent. Gauges andAll histogram-backed metrics will be reported as
follows:
- metric.avg
- metric.count
- metric.median
- metric.95percentile
- metric.max
- metric.min
You can refer to the Datadog documentation for more details. Here are the settings relevant to the API reporter:
kamon {
  datadog {

    #
    # Settings relevant to the DatadogAPIReporter
    #
    api {

      # API endpoint to which metrics time series data will be posted.
      api-url = "https://app.datadoghq.com/api/v1/series"

      # Datadog API key to use to send metrics to Datadog directly
      # over HTTPS. The API key will be combined with the API URL
      # to get the complete endpoint use for posting time series
      # to Datadog.
      api-key = ""

      # HTTP client timeout settings:
      #   - connect-timeout: how long to wait for an HTTP connection
      #     to establish before failing the request.
      #   - read-timeout: how long to wait for a read IO operation
      #     to complete before failing the request.
      #   - write-timeout: how long to wait for a write IO operation
      #     to complete before failing the request.
      #
      connect-timeout = 5 seconds
      read-timeout = 5 seconds
      write-timeout = 5 seconds
    }
  }
}
Metric Units #
Kamon keeps all timing measurements in nanoseconds and information measurements in bytes. In order to scale those to other
units before sending to Datadog, set the time-unit and information-unit config keys to desired units. Supported units
are:
n  - nanoseconds
µs - microseconds
ms - milliseconds
s  - seconds

b  - bytes
kb - kilobytes
mb - megabytes
gb - gigabytes
For example,
kamon.datadog.time-units = "ms"
Will scale all timing measurements to milliseconds right before sending to Datadog.
Integration Notes #
- Contrary to other Datadog client implementations, we don’t flush the metrics data as soon as the measurements are
taken but instead, all metrics data is buffered by the
kamon-datadogmodule and flushed periodically using the configuredkamon.metric.tick-interval. - It is advisable to experiment with the
kamon.metric.tick-intervalandkamon.datadog.agent.max-packet-sizesettings to find the right balance between network bandwidth utilisation and granularity on your metrics data.
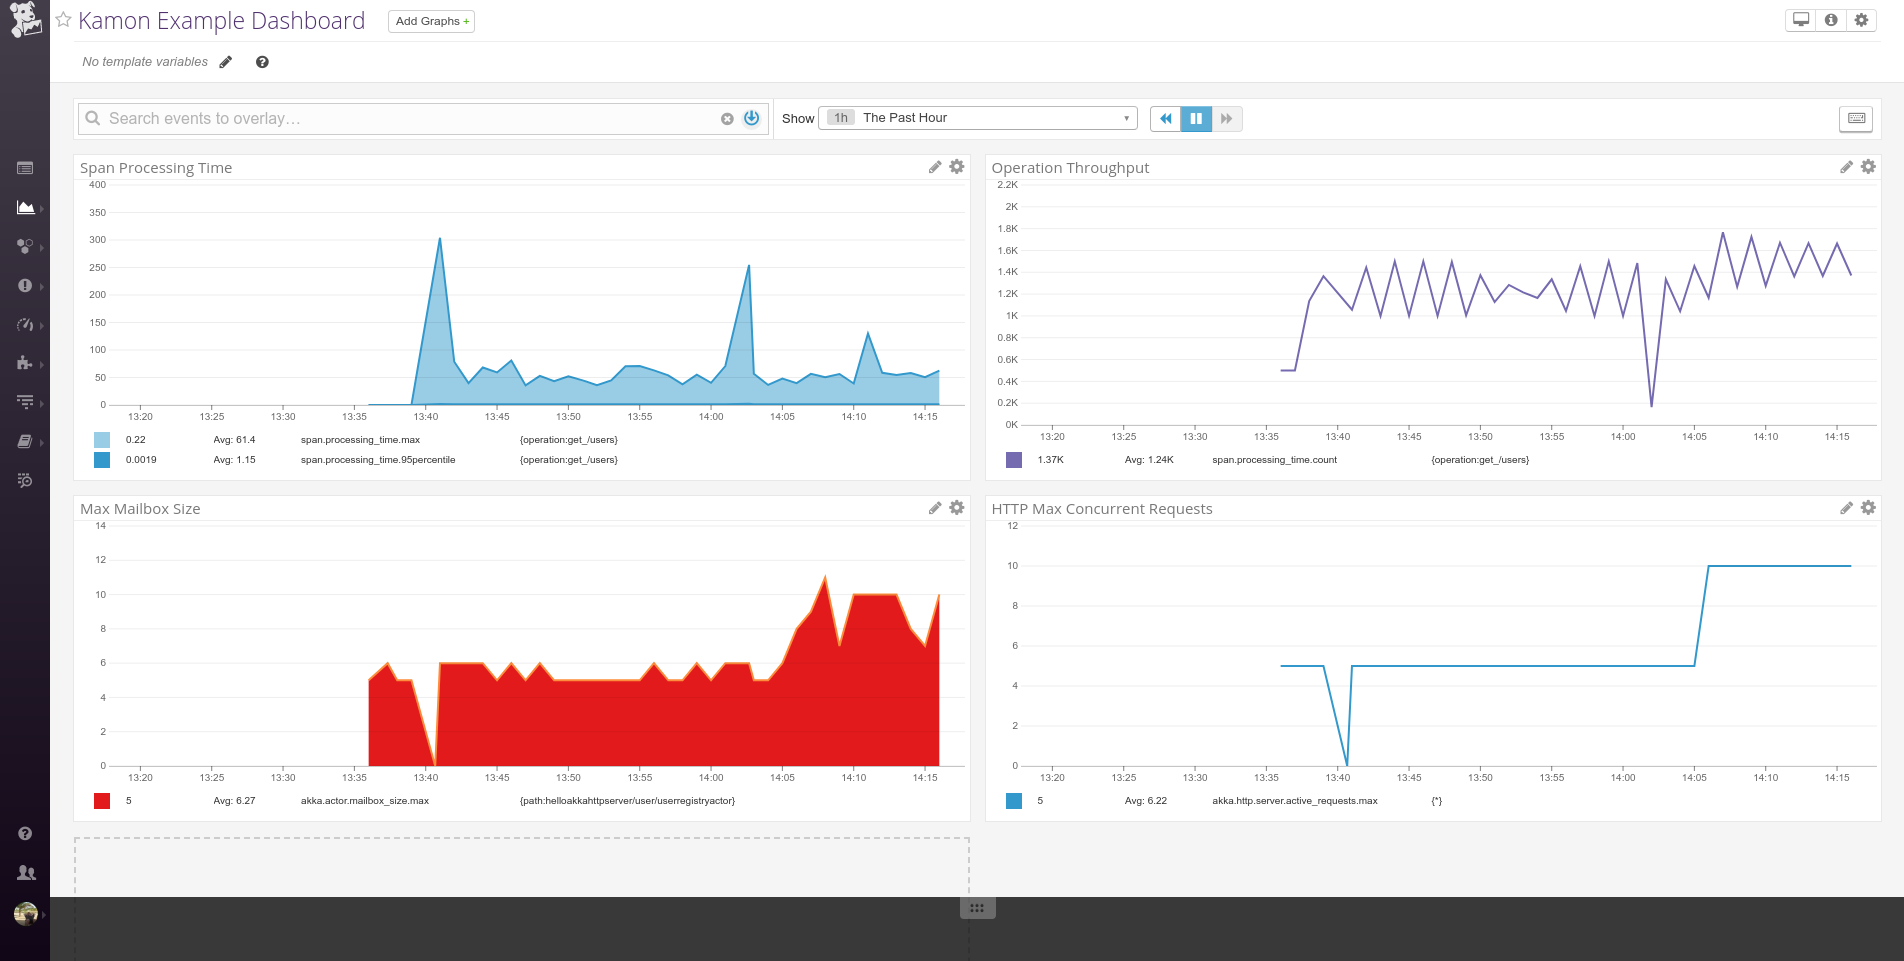
Teasers #
Creating a dashboard in the Datadog user interface is really simple, all metric names will match the Kamon metric names with the additional “qualifier” suffix. Here is a very simple example of a dashboard created with metrics reported by Kamon: