-
Installation
-
With Kamon Telemetry
-
How To Guides
-
Migrations
-
-
Core Concepts
-
Foundations
-
Advanced
-
-
Instrumentation
-
Supported Frameworks
-
Akka
-
Akka HTTP
-
Cassandra Driver
-
Caffeine
-
Elasticsearch
-
Executors
-
Futures
-
JDBC
-
Kafka
-
Logback
-
Play Framework
-
Spring Framework
-
System Metrics
-
-
-
Reporters
-
Kamon APM
-
Using Kamon APM
-
Overview
-
Services
-
Traces
-
Dashboards
-
Alerts
-
Hosts
-
Investigating Issues
-
Settings and Administration
-
-
Span List #
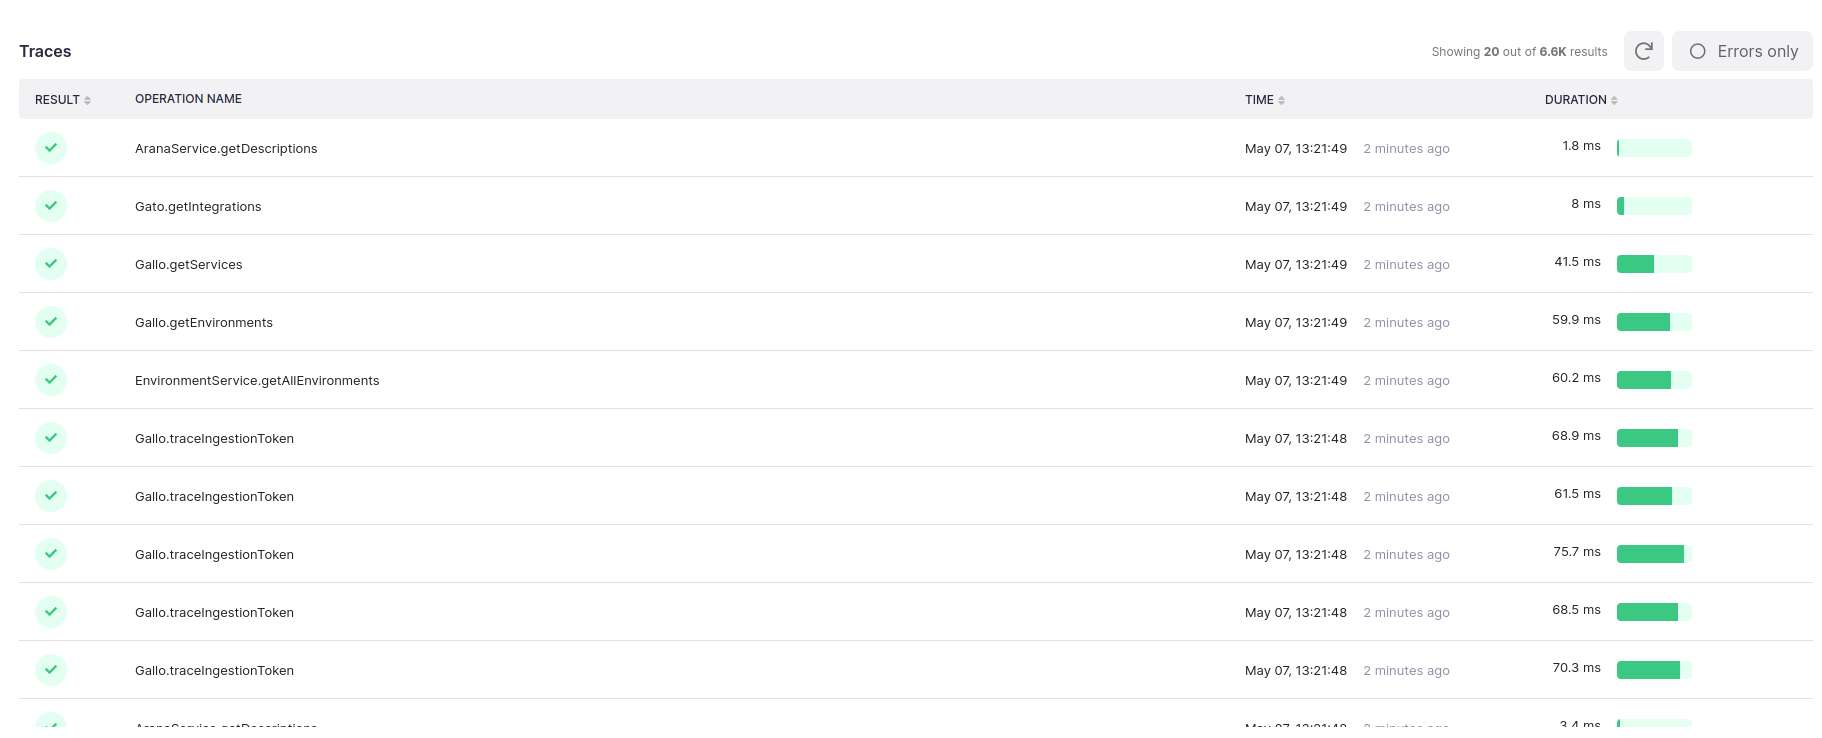
Span lists are one of the core components in Kamon APM. You will often find them integrated into pages such as the JDBC dashboard, the trace search, or the analyze view. They will list spans that match certain criteria, as determined by the context they appear in, but all will share a few common features. Every span list will show the following:
| Field | Type | Description |
|---|---|---|
| Span Result | Icon | Completed successfully or with error |
| Operation Name | String |
operation as per the span tag
|
| Time | Datetime | When the span concluded |
| Duration | Duration | Duration of span and marker showing position in overall distribution of span durations in the list |
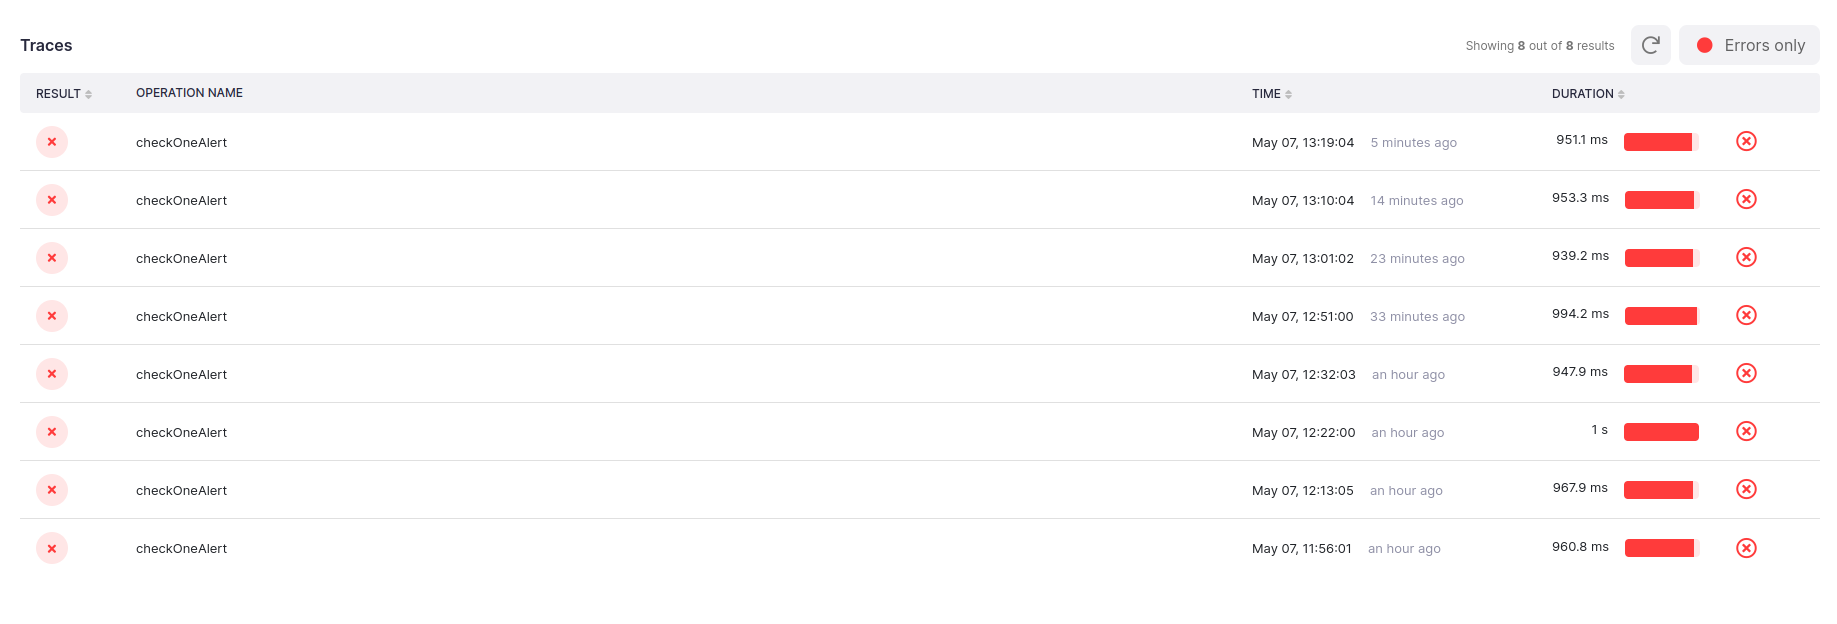
The span might also include one of two markers next to the duration, that indicate presence of errors:
The red X indicator shows the the span itself has an error (or, rather, an error occurred during the operation). The yellow exclamation mark indicates that while the operation itself did not experience an error, once of the operations it called (its descendant spans) did.
Every trace list is time sensitive, and will only show spans within the time period selected in the time picker. Some lists, however, will not automatically update to match live mode. You will recognize these lists by the presence of a refresh marker. In that case, the view will be frozen until either the time picker selection is manually changed, or the refresh button is clicked. In the latter case, the time will then be updated to match the current state of the sliding time window.
The span list also includes an error toggle. If turned on, only spans with errors (an error occurred during the execution of the operation) will be shown in the list.


