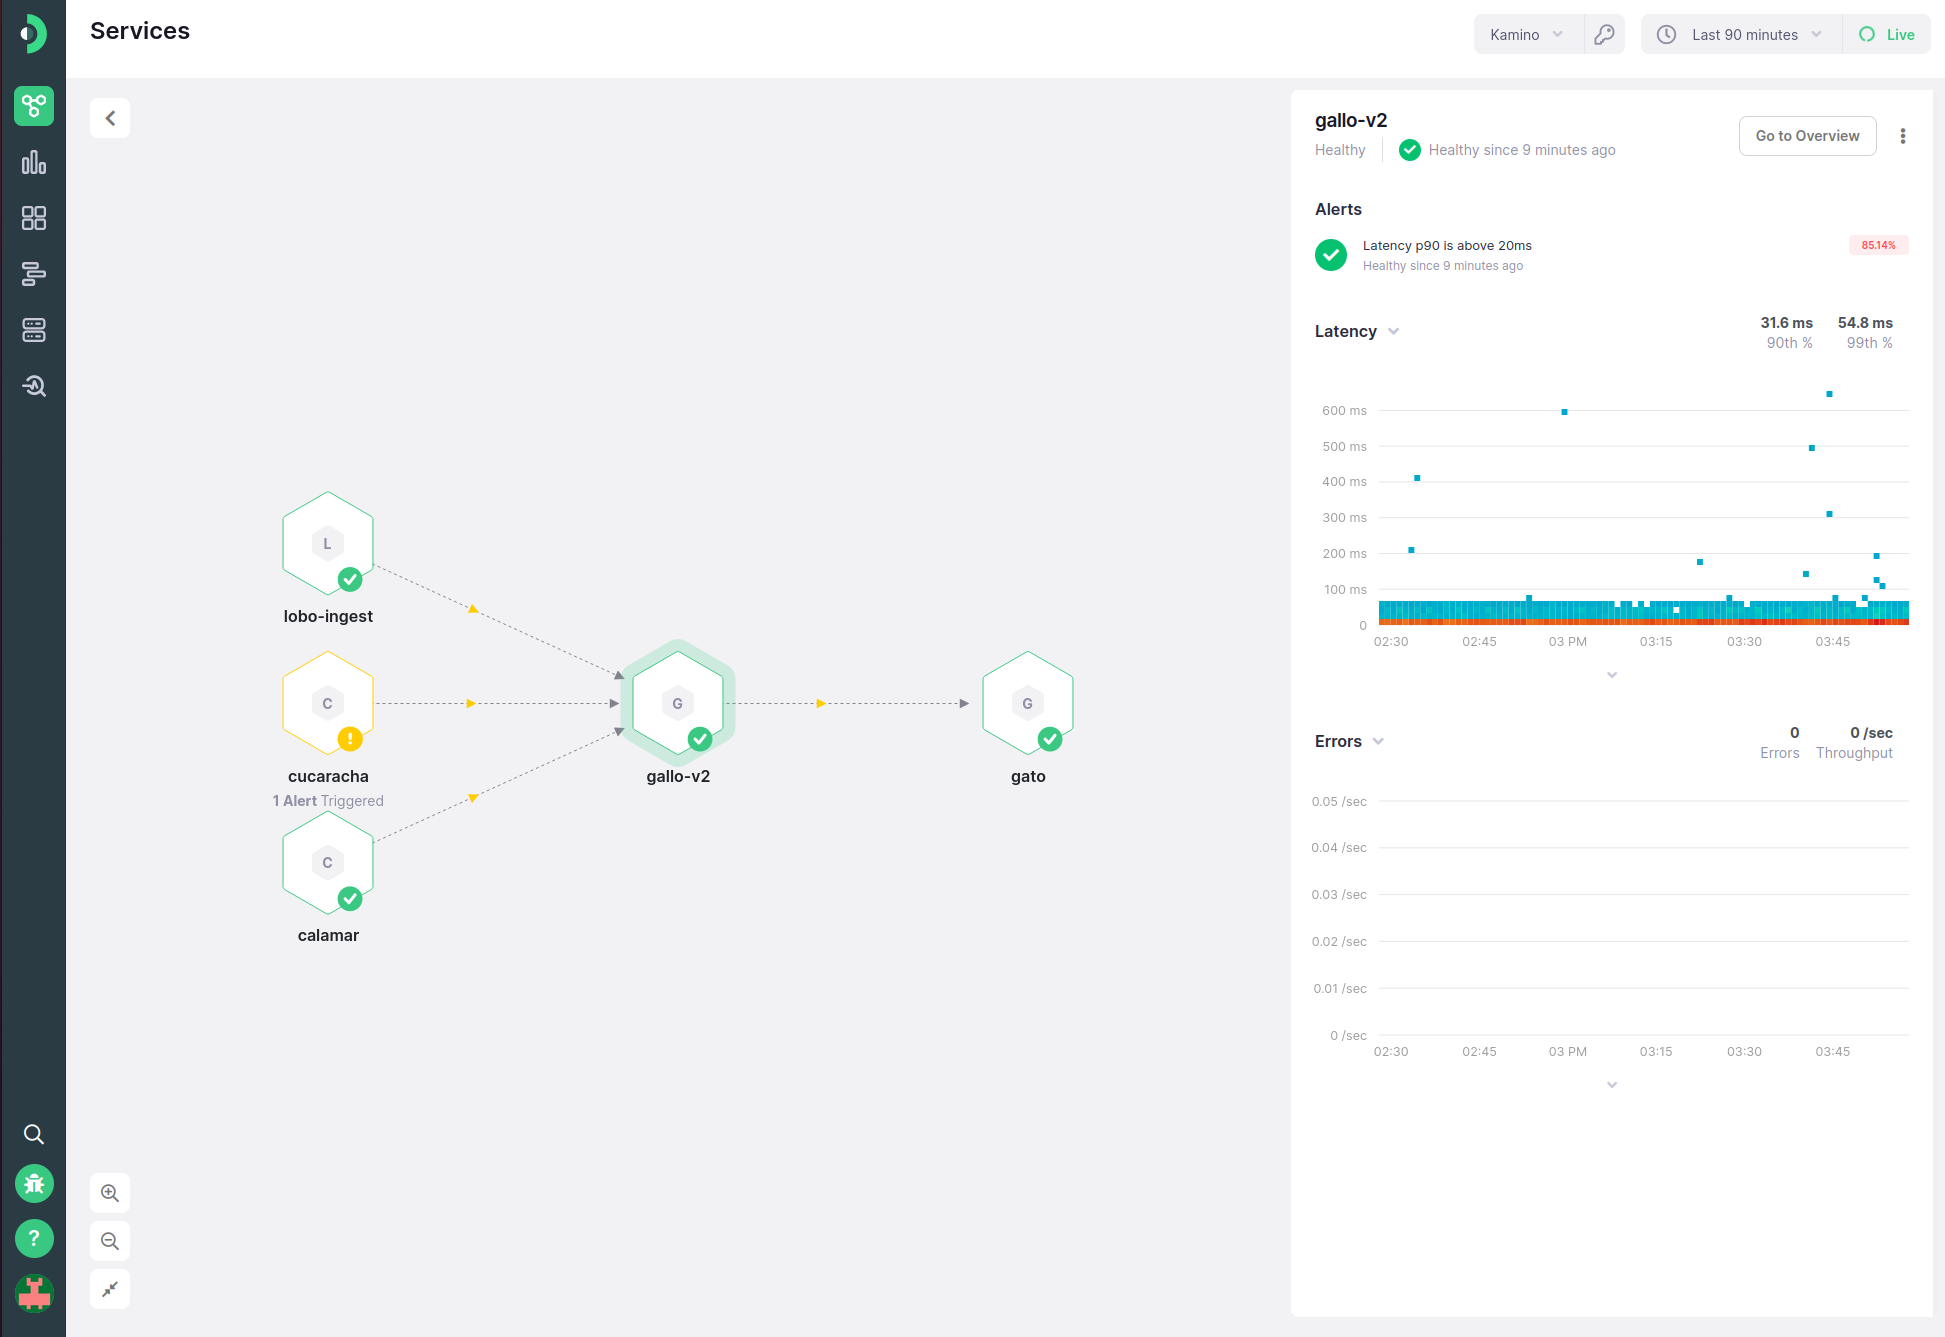
Service Map #
Overview #
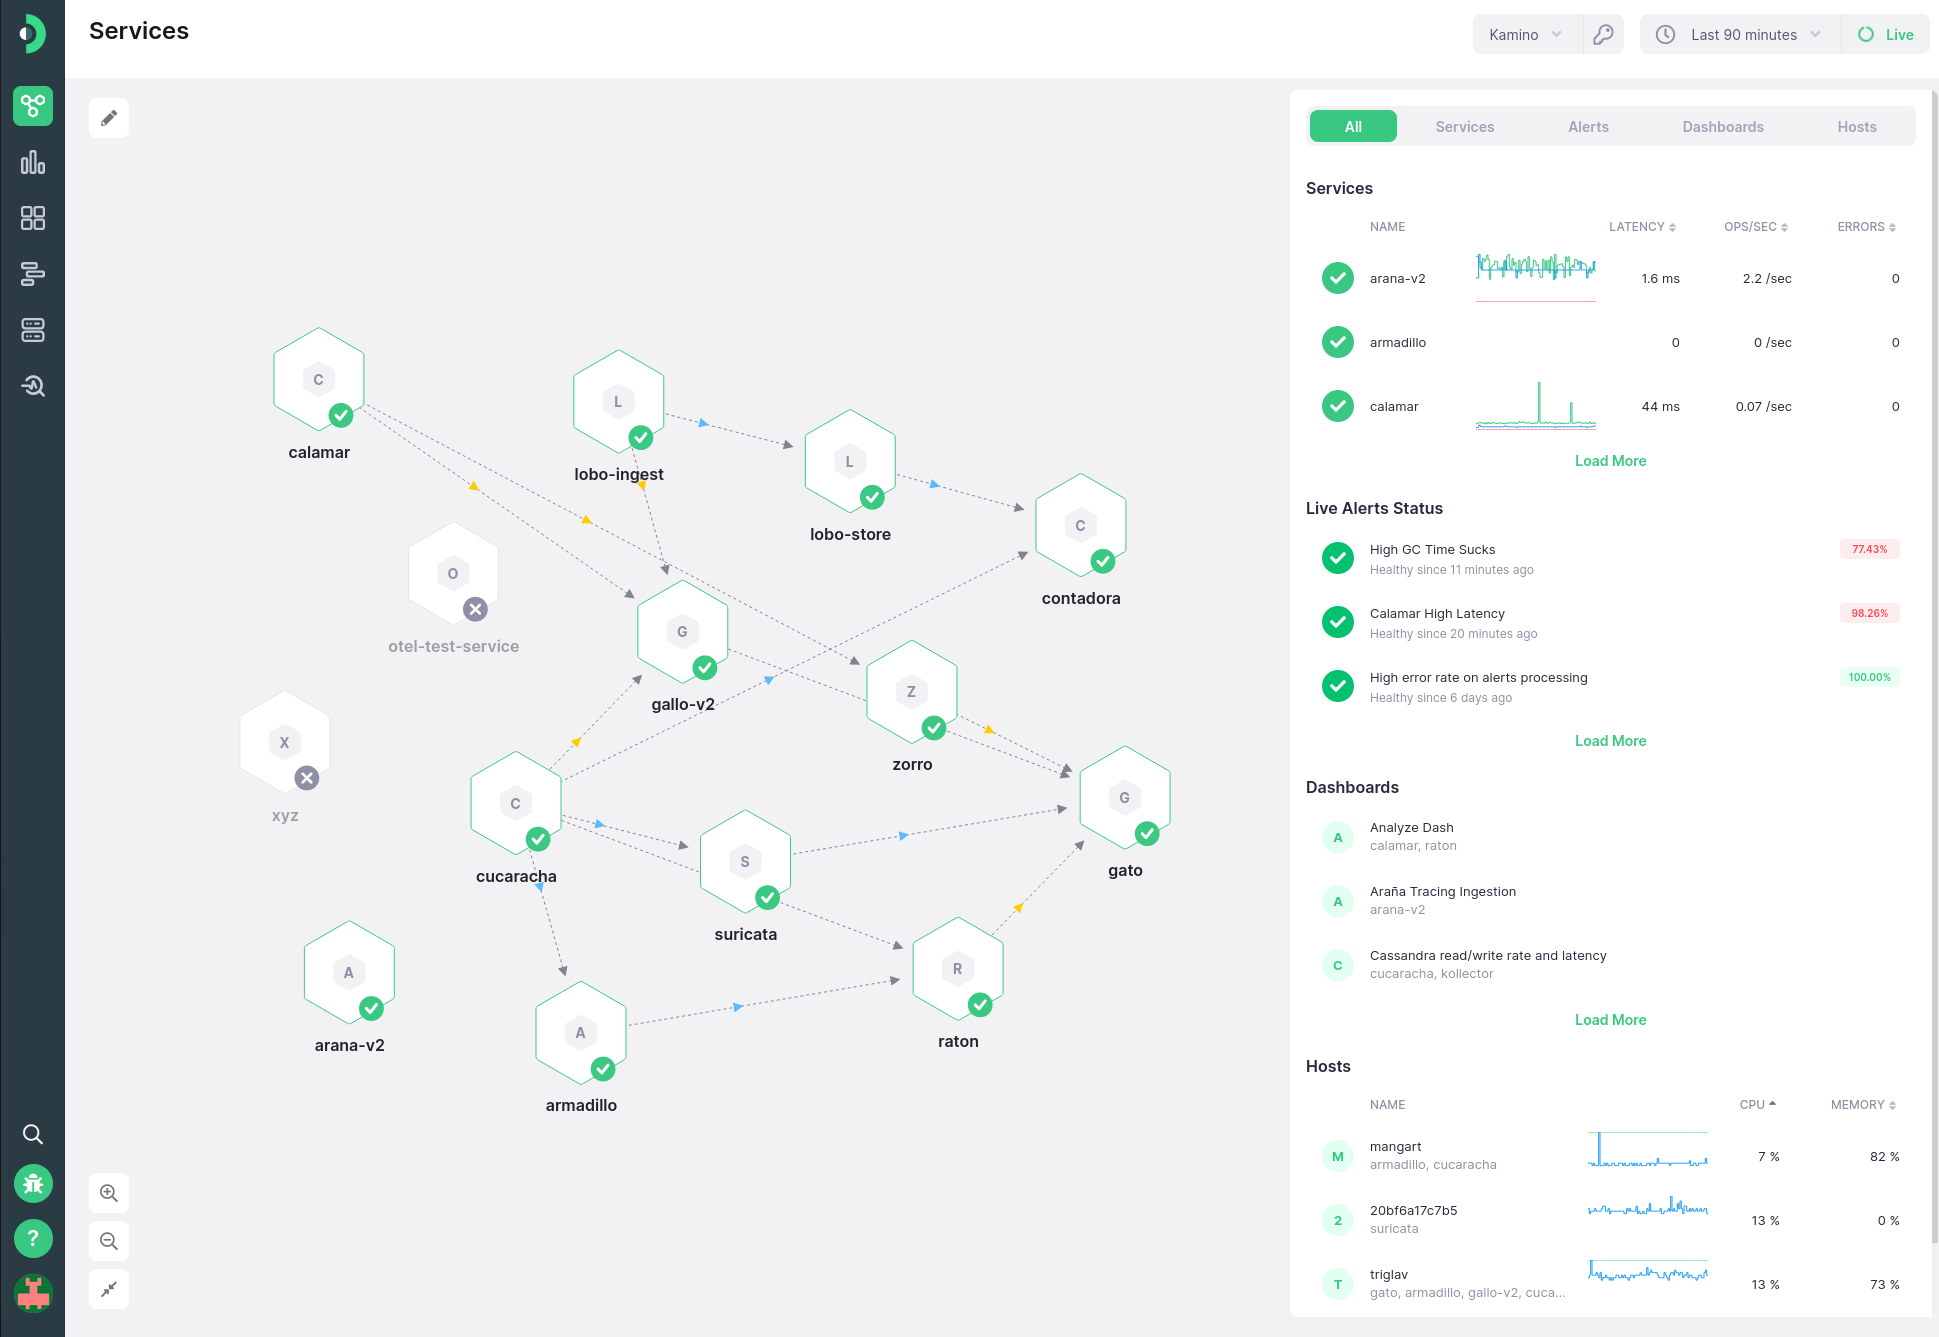
When using Kamon APM, you want to gauge the state of your entire system as completely as possible, as easily as possible. The Service Map is the page that enables you to do so, presenting the state of your service architecture. Here you can see the state of your services, how they connect and communicate, as well as an overview of the state of your hosts and dashboards.
The Service Map #
The Service Map represents each one of your instrumented services or APIs as a hexagonal node. The node can be in one of five states, depending on its liveness and alert status:
| State | Status | Description |
|---|---|---|
| Healthy |  |
A service which is sending data and has no active alert incidents |
| Warning |  |
A service which is sending data, but has an active alert with the warning severity |
| Critical |  |
A service which is sending data, but has an active alert with the critical severity |
| Dead |  |
A service which has stopped sending data |
| Restricted |  |
A service which surpasses the count allowed by the plan and is obscured |
When multiple alerts have active incidents for the same service, the most severe one will determine its state. You can see the alerts documentation for more details.
Dead services are those services which are no longer sending data to the system. This could be due to them being stopped, or due to an issue in your configuration. Historical data for these services will still be shown, as long as some data was sent inside of the currently selected period.
Restricted services are those services which go beyond the maximum number of services allowed by your subscription plan. On the Developer Plan, you can have up to 5 services at the same time, but any additional services will be restricted. While data sent by them will be ingested, you will not be able to see or use the data in any way, unless you delete another existing service to reduce to number to 5 or below, or upgrade to a paid plan. On all paid plans, the number of services is unrestricted. If clicked, these services will show the Upgrade Prompt, allowing you to switch to a paid plan directly from the Service Map.
Each (unrestricted service) can be hovered to highlight the service itself, and its links to other services, if any. By clicking on a service, you will enter focused mode, while double-clicking will take you to the service overview.
Layout #
The Service Map layout is generated automatically, and will attempt to arrange your services so that:
- There is sufficient space between them
- Services that are invoked by more caller will tend to gravitate towards the right
- Connected services are closer than unconnected services
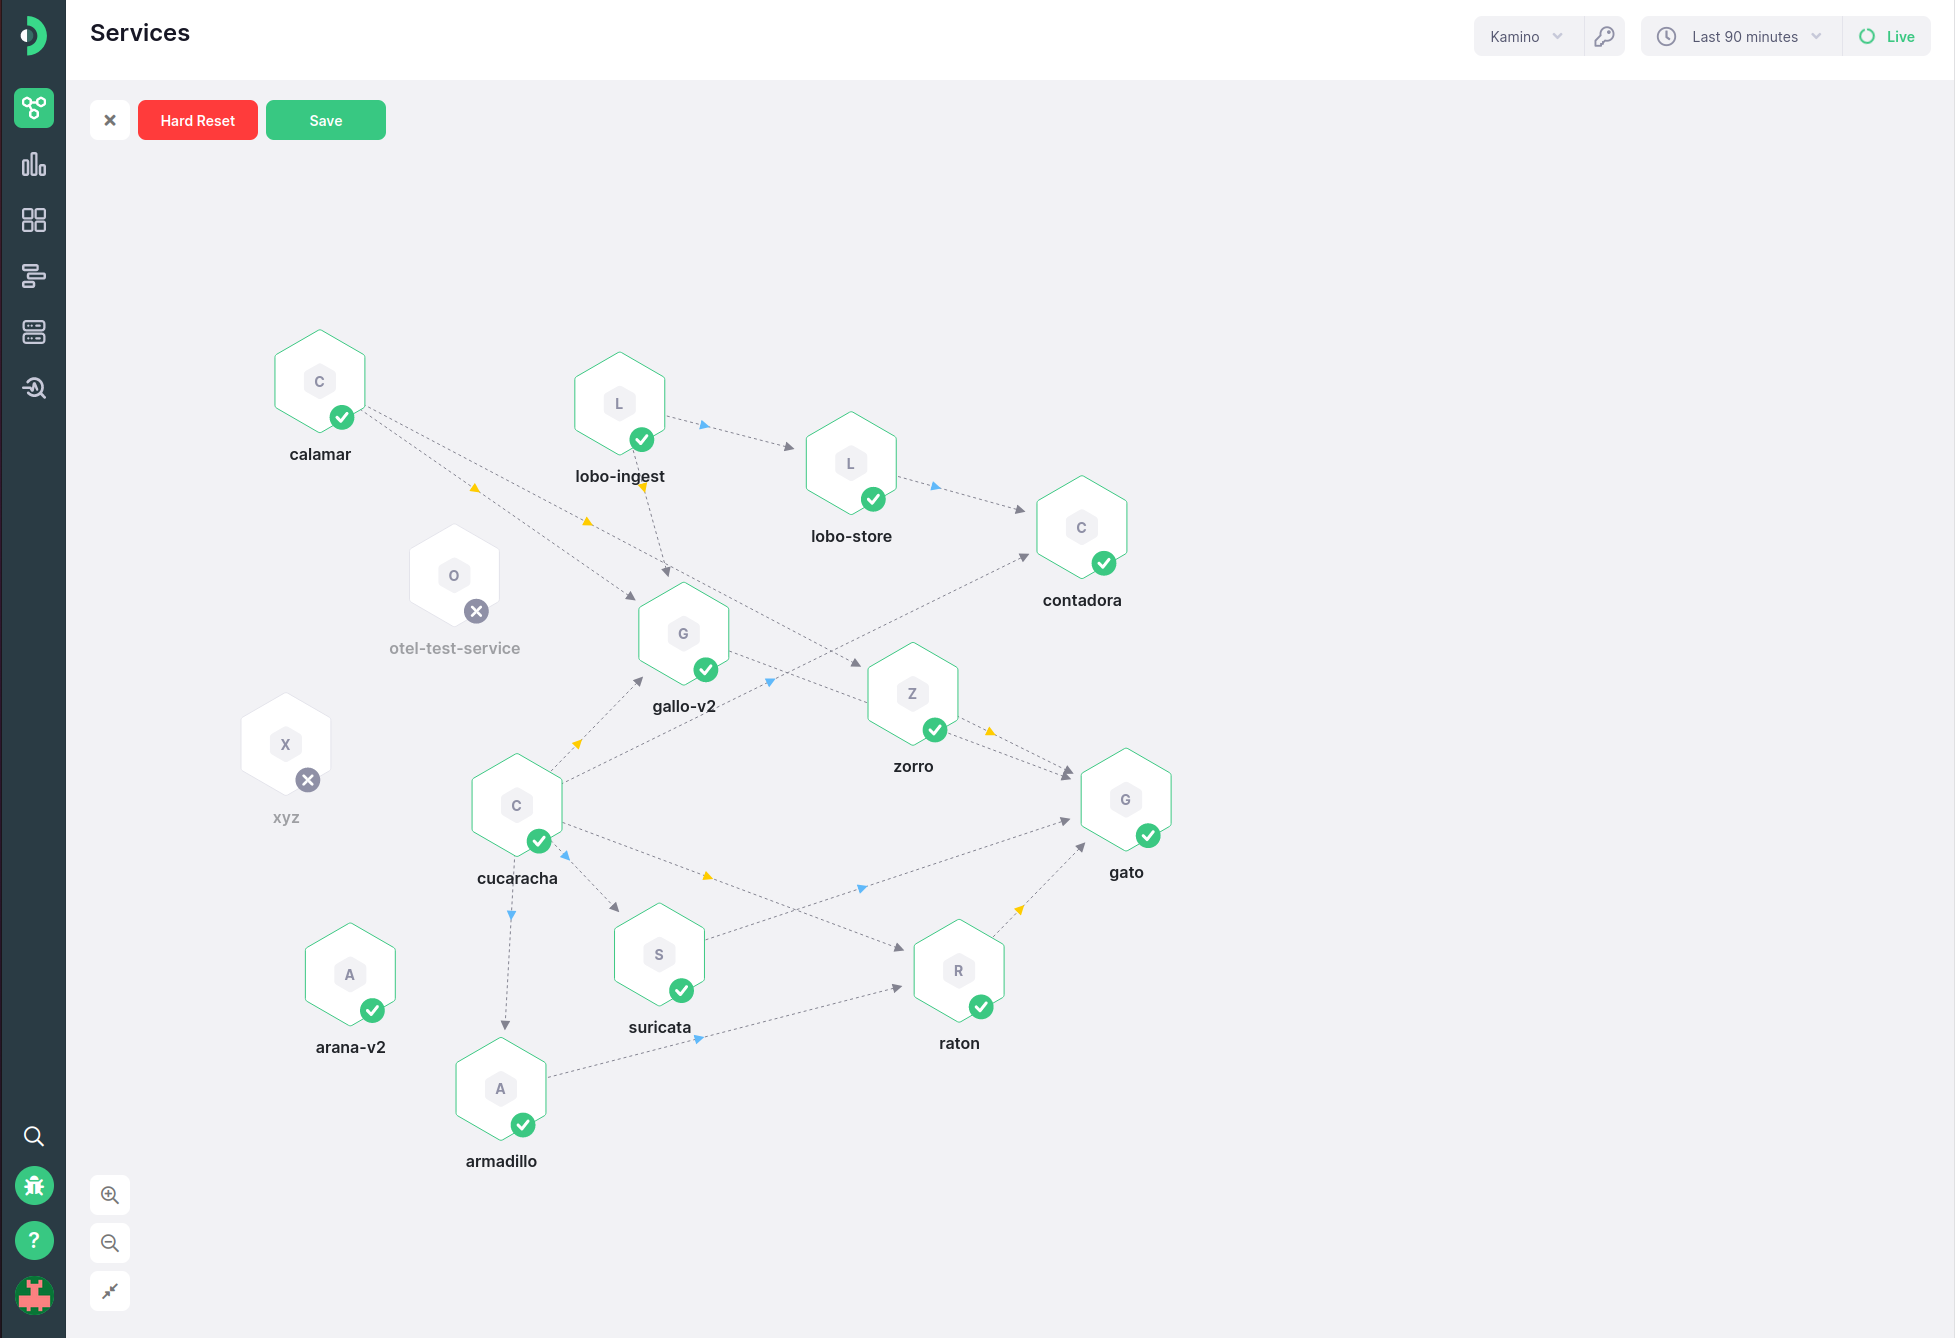
If the generated layout does not suit you, you can enter edit mode by pressing the button in the top left corner. In this mode, you can re-arrange the nodes by dragging them. If the layout is saved, it will be shared by all users in your organization. In edit mode, you can also discard all changes and reset to the pre-calculated layout.
If you save a layout and a new service is added, the layout will be lost and a new layout will be calculated for all your services, in an attempt to include the newly added nodes.
Zooming and Panning #
The Service Map can be zoomed into and out of. You can zoom by clicking the zoom in/out buttons in the bottom right corner of the service map, or by using the mouse wheel. To pan the Service Map, click on the service map outside of a node or a link, hold down the mouse button, and drag.
To reset to the initial zoom level and re-centre, you can click on the reset button underneath the zoom in/out buttons.
Service Links #
When Kamon detects that services are communicating (e.g., via http or through Kafka), it will display a connection in the Service Map. The link will show the direction if communication, if it can be inferred. To view more details, hover over the link to display an informative tooltip. The types of connections are as follows:
| Link | Symbol | Description |
|---|---|---|
| Client-Server |  |
A service (the client) calls another service (the server), via some protocol |
| Producer-Consumer |  |
A service produces messages, and another services consumes then |
| Both |  |
Both of the above |
| Calls |  |
A service invokes another service via unidentified method |
| Communicate | N/A | Two services communicate. The direction and method are uncertain |
Links are detected automatically by analyzing Traces collected from your services. If connections are not appearing, make sure your application is correctly propagating context.
For Producer-consumer via Kafka, see the Kafka documentation.
Service Map Sidebar #
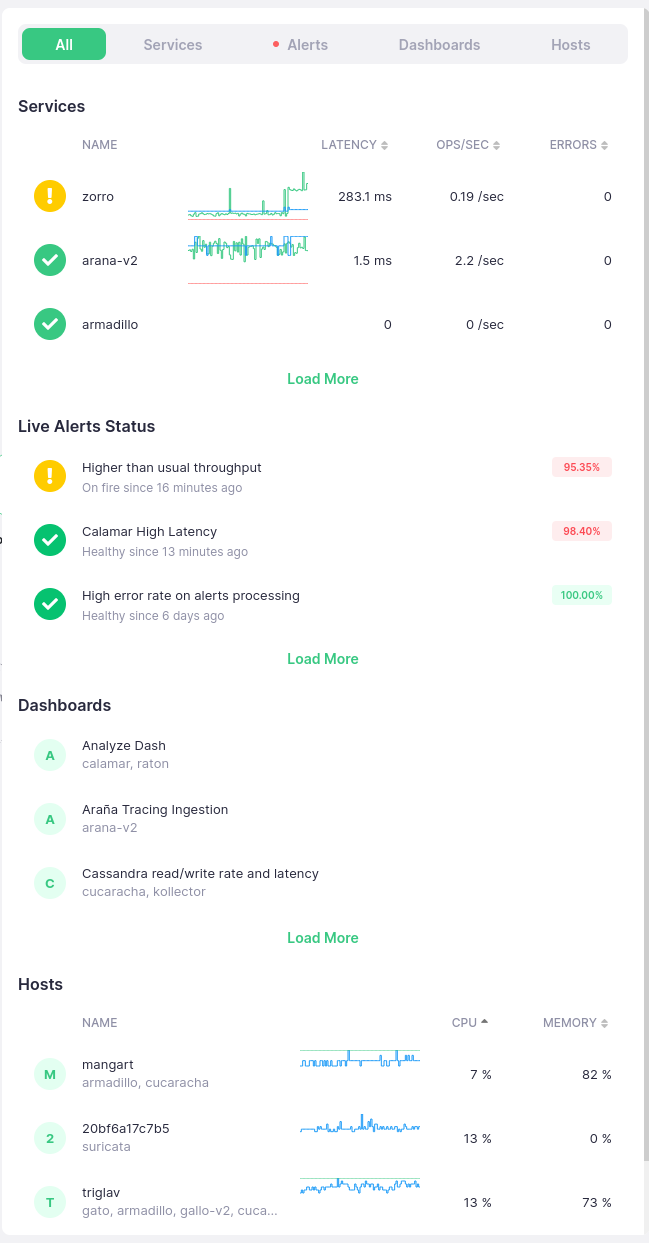
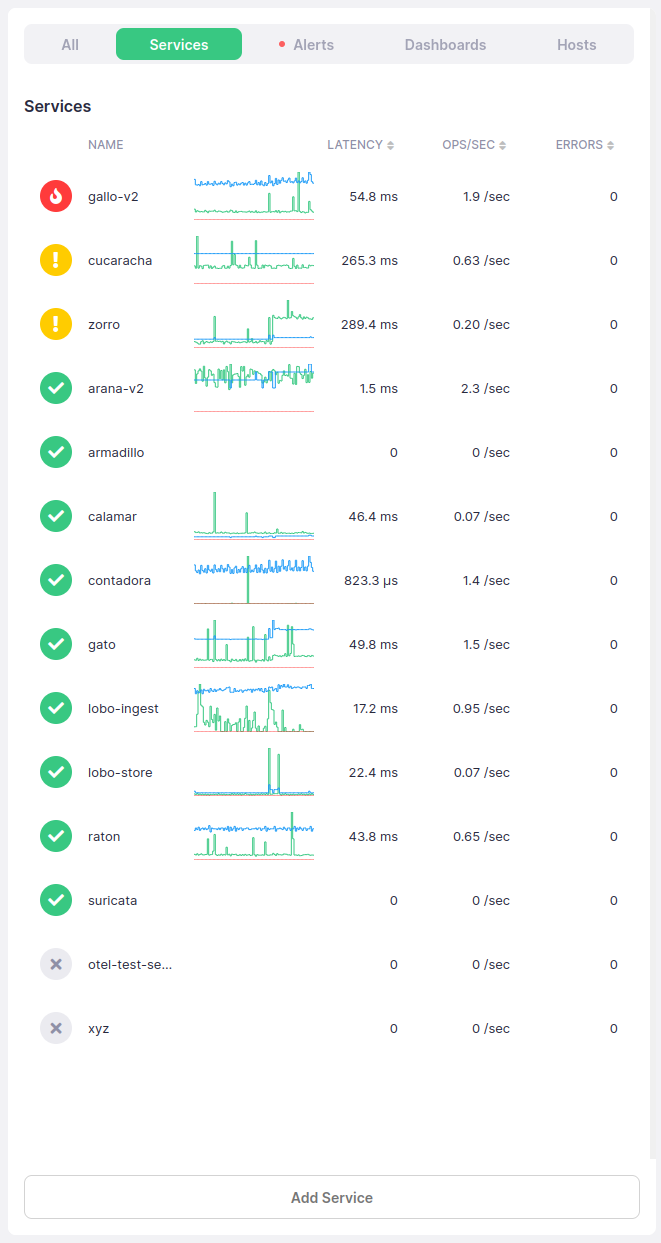
On the right-hand-side of the Service Map, you can see the Overview Sidebar. This sidebar contains an overview of your services, alerts, dashboards, and hosts. It will show basic information such as names, statuses, and (for services and hosts) sparkline summaries of some basic metrics.
When viewing All, it will show, by default, up to three items for each category. Services and Alerts will be sorted by severity, while Dashboards and Hosts will be sorted alphabetically. More items, if available, can be loaded by clicking Load More.
Other tabs will include a full list, as well as a button to add another instance of the item.
Focused Mode #
By clicking on a service, you will enter Focused Mode. In this mode only the service and its direct links will be shown. Additionally, the sidebar content will change to show more information about the focused service:
- Its status and information
- A link to the service overview
- All alerts defined for the service
- A histogram of server spans reported by this service
- A bar chart of spans including errors for this service
- Dropdown menu that allows you to delete the service or define a new alert for it
Clicking on another service will switch the view to Focused Mode for that particular service.
