-
Installation
-
With Kamon Telemetry
-
How To Guides
-
Migrations
-
-
Core Concepts
-
Foundations
-
Advanced
-
-
Instrumentation
-
Supported Frameworks
-
Akka
-
Akka HTTP
-
Cassandra Driver
-
Caffeine
-
Elasticsearch
-
Executors
-
Futures
-
JDBC
-
Kafka
-
Logback
-
Play Framework
-
Spring Framework
-
System Metrics
-
-
-
Reporters
-
Kamon APM
-
Using Kamon APM
-
Overview
-
Services
-
Traces
-
Dashboards
-
Alerts
-
Hosts
-
Investigating Issues
-
Settings and Administration
-
-
Time Picker #
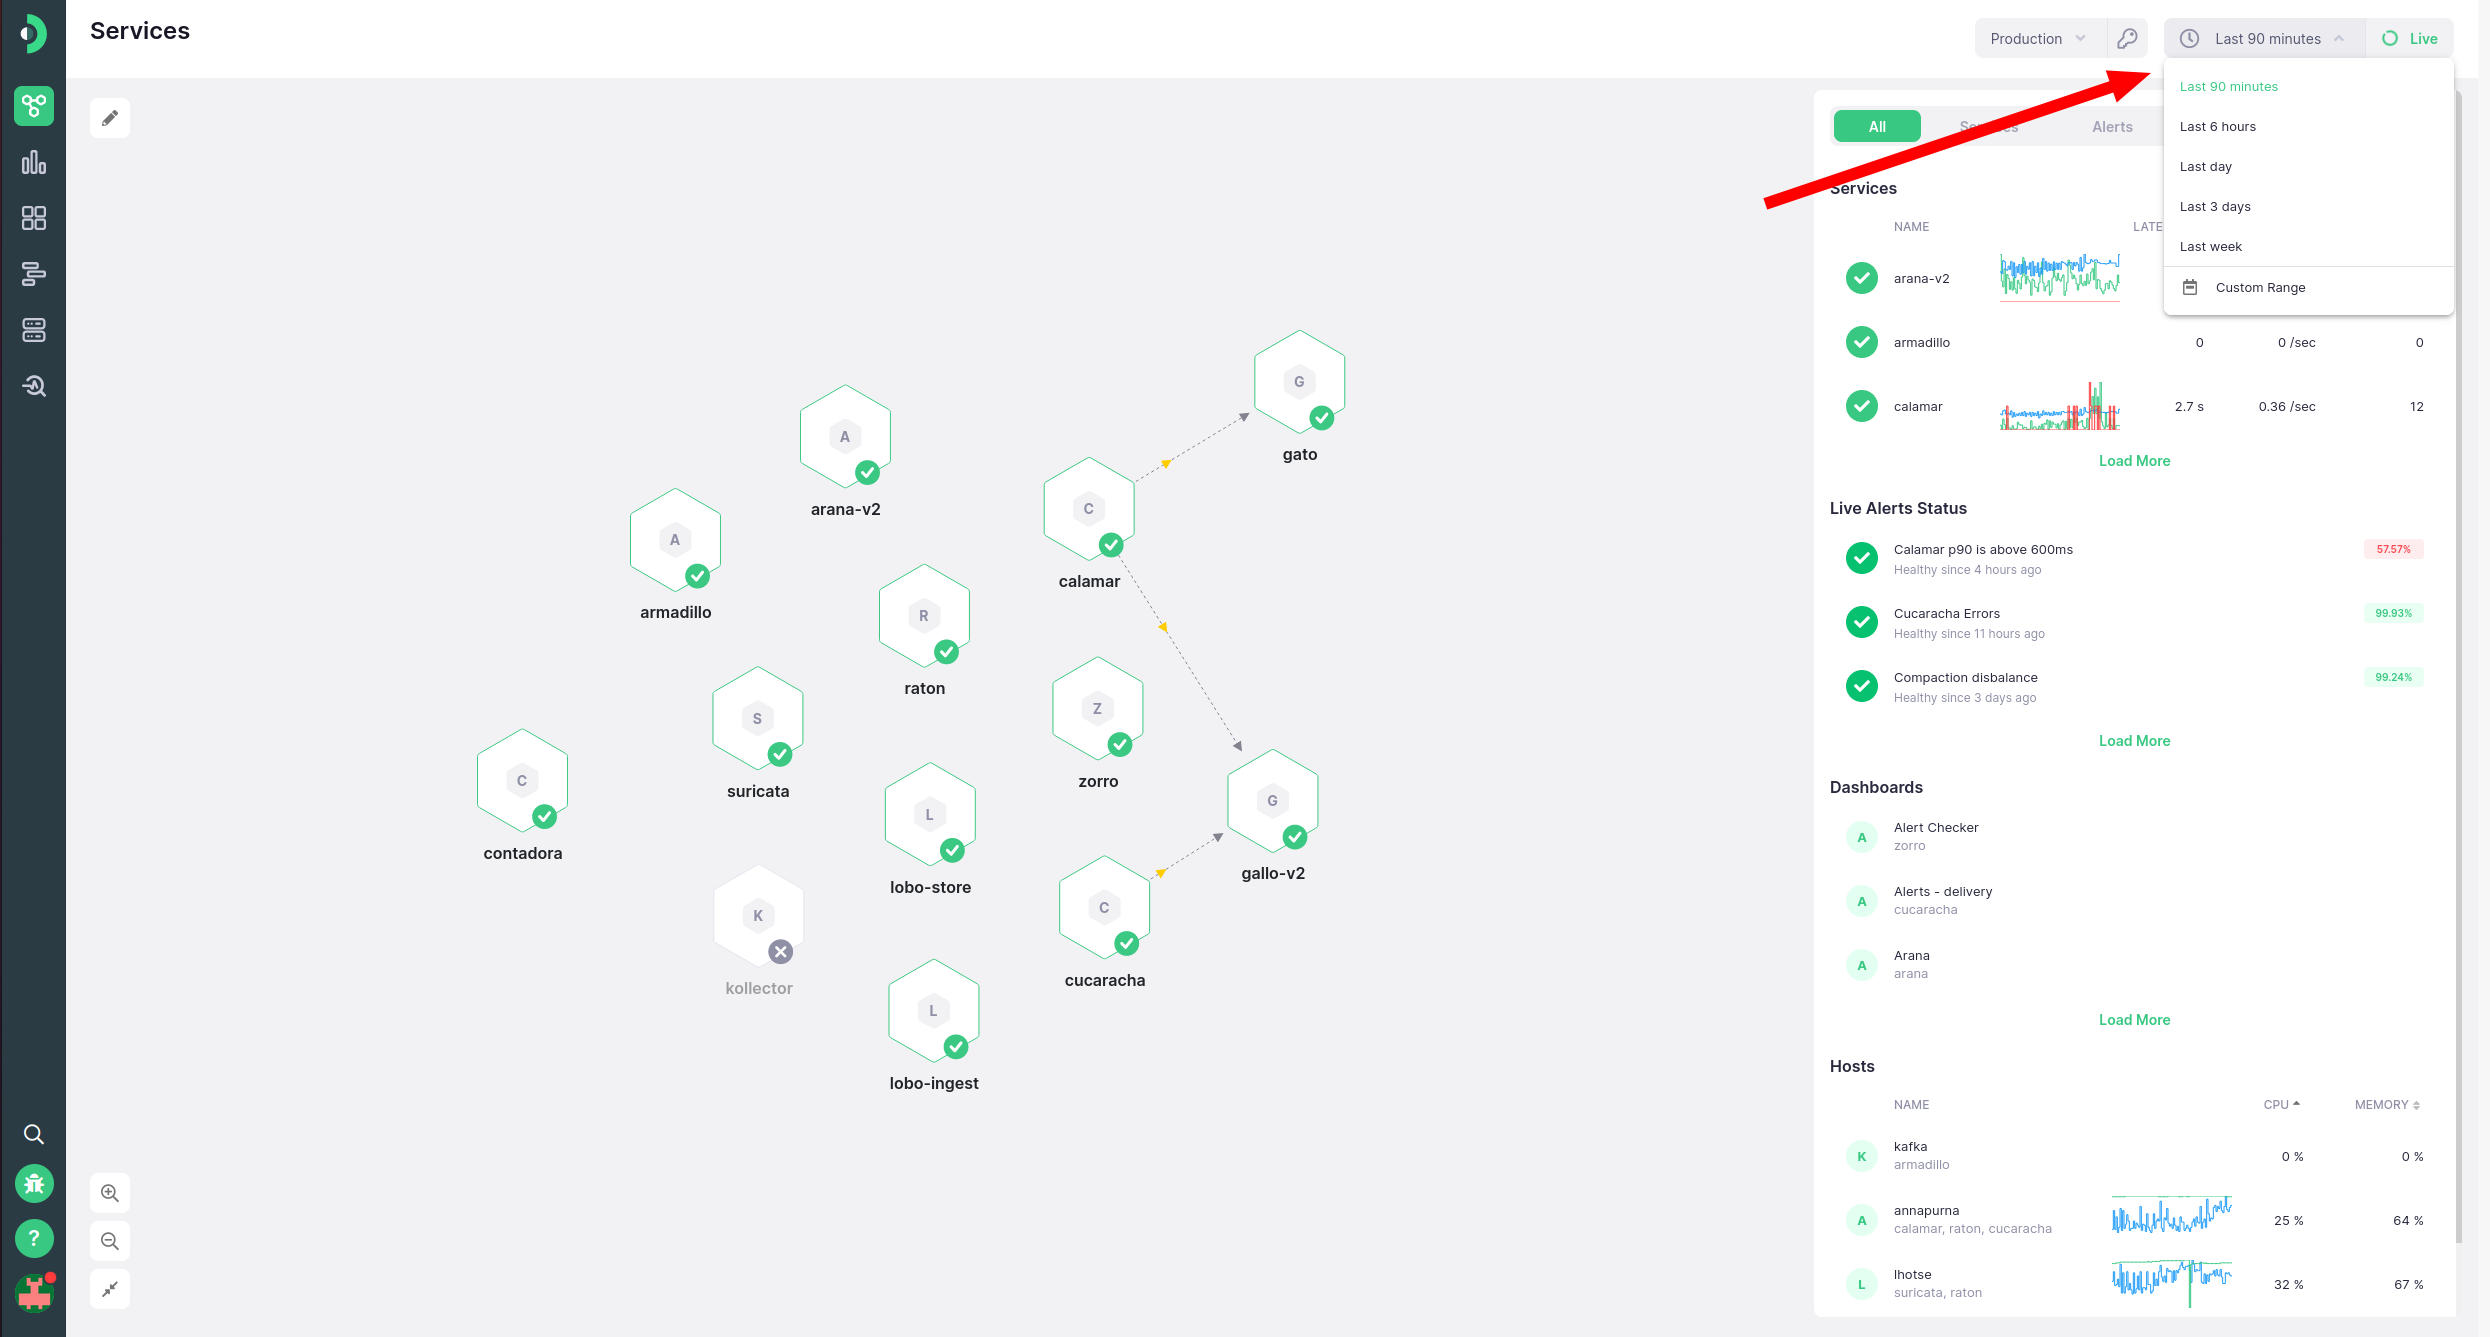
When looking at metrics and traces coming out of your monitored services or APIs, one of the important questions you need to ask is when. With the Time Picker, you can drill down into the exact time period you are interested in, or keep an eye on data inside a live sliding window as new information arrives. The time picker is located in the header, in the top right corner of the application. It has two modes of operations - Live and Fixed - and allows for switching between them.
Live Time #
In Live mode, all charts and traces in the application will be showing a sliding window, which will update with new information every minute. When you are in Live mode, the status indicator will be green, and will display a spinning icon. The text on the time picker will indicate which sliding window duration has been set.
Fixed Time #
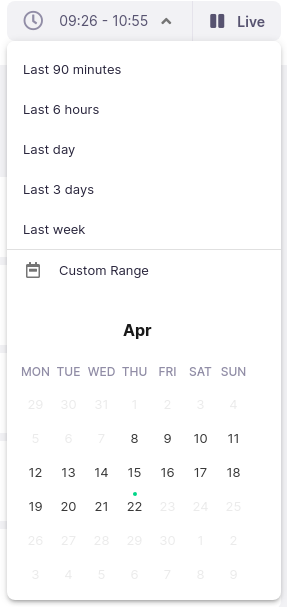
In Fixed mode, the time window will not update, and all metrics and traces will be constrained to that time window. In Fixed mode, you can debug past incidents and performance bottlenecks without risking your data updating while you’re analyzing it. When in Fixed mode, the time picker will show a pause icon in dark gray, and the selected time window boundaries will be shown.
When clicking on the time picker, it will expand to offer a number of useful pre-selected time periods. Selecting any of these periods will switch to using Live mode for the given period. It can be expanded further by clicking on the Custom Range button and selecting an exact range of dates to view in Fixed mode.
You can easily switch between Live and Fixed mode by clicking the Liveness indicator on the right of the Time Picker. When switching modes, the currently selected duration will be retained. For example, when switching from Last 1 day to Fixed mode, it will still show the last day, but will freeze the time frame. When switching from a Fixed period of one day to Live, it will now show the last 1 day, regardless of which range of a day was selected previously.
Available time periods in the Time Picker are constrained by your retention, which depend on your environment type and your plan. If you need longer retention, you can upgrade to one of the paid plans.
Time & Charts #
Charts and the time picker are connected in a two-way relationship. Charts will show the period of time selected in the time picker, but the time picker can also be updated by making a selection on any chart with a time axis. You can read more about this in the charts documentation.
Analyze Time Picker #
When entering the Analyze view, you will always automatically enter the Fixed mode, with the time period ranging the same time period you were viewing when you clicked the analyze button. Any changes you make to the time picker while in the Analyze view are local only, and will not be persisted once you exit the Analyze view.


