Alerts - Overview #
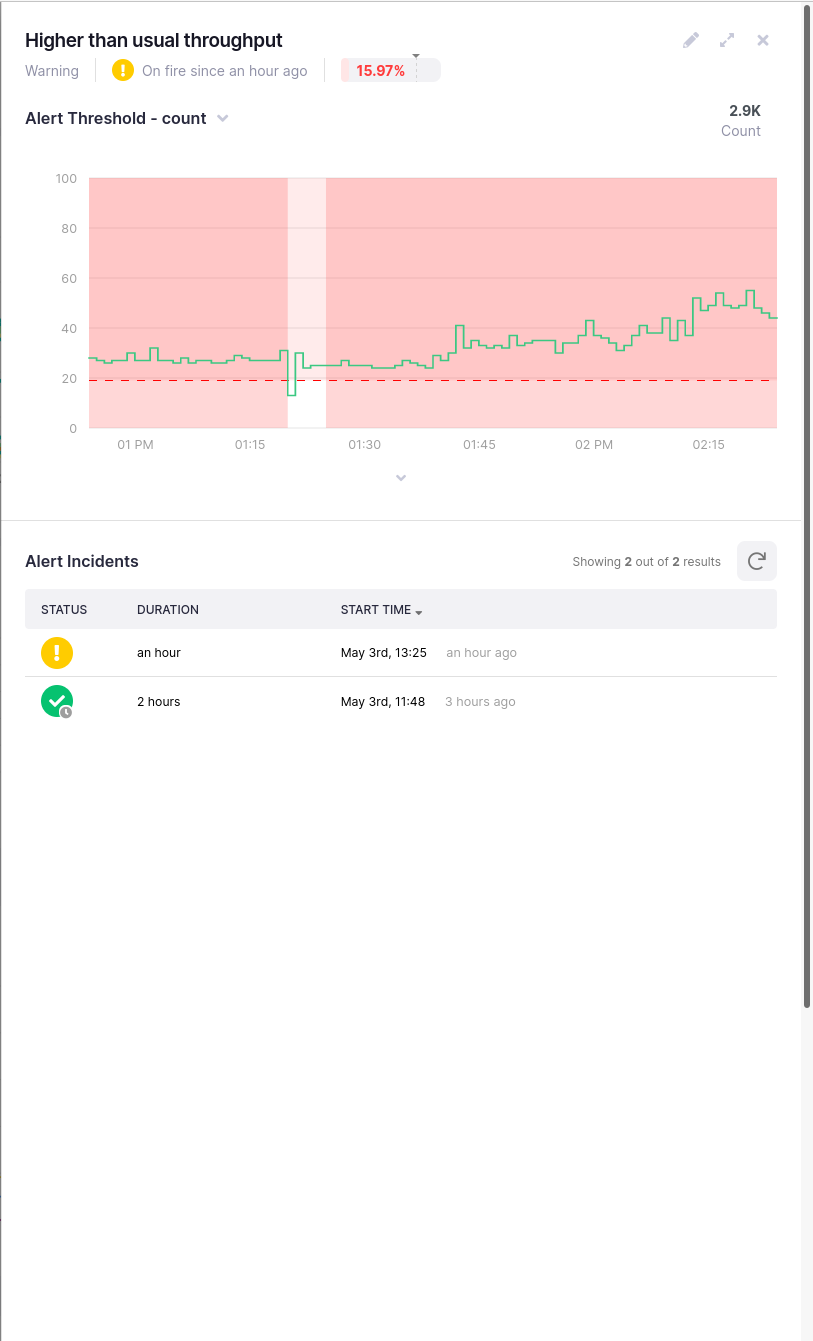
When something goes wrong in your system, you want to know! This is where Kamon APM alerts come in. The core concept of alerts is simple - you set up a metric and the aspect of it you want to keep track of, and you specify a threshold. If the threshold is crossed for a specified amount of time, the alert is triggered. From that point until the alert goes back past the threshold again is considered a single incident. Incidents are recorded even if they have not been resolved, and as marked as ongoing. An alert with an active incident is considered on fire.
Alerts are always linked to a data source. This data source is a metric, and it can be from either a service that sends data to Kamon APM, one of your hosts, or an internal metric of Kamon APM itself. You can read more about them in the chapter about creating alerts. These alerts determine the state of the data source they are connected to - if any of the alerts connected to a service has an ongoing incident (also known as on fire), the service has the severity state of that alert. If multiple alerts are on fire, the most severe alert is considered. If no alerts are specified, or none are on fire, the service is considered healthy.
Alert Triggers #
Alerts in Kamon APM have triggers, which are conditions under which an alert should be considered active. Triggers are defined as a combination of the following:
- A measure of the metric
- A comparison (one of
==,<,>,<=,>=) - A threshold to compare to
If the expression evaluates to true for a sufficiently long time period, the alert is considered to be active, its status changes, and notifications start getting sent out if the alert is configured to do so.
Measures #
A measure is a certain aspect, or aggregation, of a metric’s value. To configure alerts, we need data points through time. This is a simple matter of counters, but with other metric instruments Kamon APM allows you more flexibility. Depending on the instrument type you are dealing with, you can select one of the following measures for the metric:
| Counter | Gauge | Range Sampler | Timer | Histogram | |
|---|---|---|---|---|---|
| Count | ✔ | ✔ | ✔ | ✔ | ✔ |
| Throughput | ✔ | ✔ | ✔ | ✔ | ✔ |
| Sum | ✔ | ✔ | ✔ | ✔ | ✔ |
| Min | ❌ | ✔ | ✔ | ✔ | ✔ |
| Max | ❌ | ✔ | ✔ | ✔ | ✔ |
| Meadian | ❌ | ✔ | ✔ | ✔ | ✔ |
| Mean | ❌ | ✔ | ✔ | ✔ | ✔ |
| Percentile | ❌ | ✔ | ✔ | ✔ | ✔ |
Note: Any percentile can be chosen, as a number.
Alert Severity #
Alerts can have two different states of severity: Warning and Critical. Other than their relative importance, there is one more crucial difference. Critical alerts can trigger notifications to outside channels. Warnings will exclusively be visible inside of Kamon APM, and are not considered severe enough to wake you up in the middle of the night.
Alert Availability Target #
Alerts may have a certain availability target set up. An availability target is a constraint that the alert must be healhty for a certain percentage of time, inside a certain time window. For example, you may demand that an alert be healthy 99% of the time in every one week period. You can learn more about setting up availability targets in the chapter on creating alerts, and more about where you can see them in chapters about the alert drawer and alert lists.
Alert Evaluation Period #
All alerts need to specify an amount of time for which their condition needs to apply for the alert to be considered active and trigger a new incident. This evaluation period is always a positive integer and specified in minutes, with a minimum of one minute. The reasoning behind is that a small spike or drop might not be a real problem, but prolongued continuation of the same circumstances might be. With the evaluation period, you can configure the “sensitivity” of the alert to match only conditions that you need to react to.
The alerts you configure should always be actionable. If something does not merit attention or reaction for you or your team, it should probably not be an alert. Warnings can point out potential future issues or minor problems, while Critical alerts can send out notifications and should be something that merits instant attention.
