-
Core Concepts
-
Foundations
-
Advanced
-
-
Guides
-
First Steps
-
Frameworks
-
Migrations
-
-
Instrumentation
-
Available Instrumentation
-
-
Reporters
-
Combined Reporters
-
Metric Reporters
-
Span Reporters
-
You are viewing documentation for an outdated version. Do you wish to see documentation for the latest version?
Reporting Metrics to InfluxDB #
[InfluxDB] is an open-source time series database developed by InfluxData. It is written in Go and optimized for fast, high-availability storage and retrieval of time series data in fields such as operations monitoring, application metrics, Internet of Things sensor data, and real-time analytics.
Installation and Startup #
libraryDependencies += "io.kamon" %% "kamon-influxdb" % "1.0.2"
    <dependency>
      <groupId>io.kamon</groupId>
      <artifactId>kamon-influxdb_2.13</artifactId>
      <version>1.0.2</version>
    </dependency>
implementation 'io.kamon:kamon-influxdb_2.13:1.0.2'
Once you have the dependency on your classpath, start the reporter:
Kamon.addReporter(new InfluxDBReporter())
Integration Notes #
This module sends all the metrics data to InfluxDB over HTTP. Kamon metric names will become InfluxDB’s “measurement name”, all tags will be transmitted unchanged and depending on the metric type, the following fields will be added:
- Counters will be reported with a single
countfield. - Gauges will be reported with a single
valuefield. - Histograms and Range Samplers will be reported with
count,sum,min,maxandpXXfields, where each of thepXXfields represent a percentile for the given distribution of values. These percentiles can be configured using thekamon.influxdb.percentilessetting.
The following settings are available:
kamon.influxdb {

  # Hostname and port in which your InfluxDB is running
  hostname = "127.0.0.1"
  port = 8086

  # The database where to write in InfluxDB.
  database = "mydb"

  # For histograms, which percentiles to count
  percentiles = [50.0, 70.0, 90.0, 95.0, 99.0, 99.9]

  # Allow including environment information as tags on all reported metrics.
  additional-tags {

    # Define whether specific environment settings will be included as tags in all exposed metrics. When enabled,
    # the service, host and instance tags will be added using the values from Kamon.environment().
    service = yes
    host = yes
    instance = yes

    # Specifies which Kamon environment tags should be ignored. All unmatched tags will be always added to al metrics.
    blacklisted-tags = []
  }
}
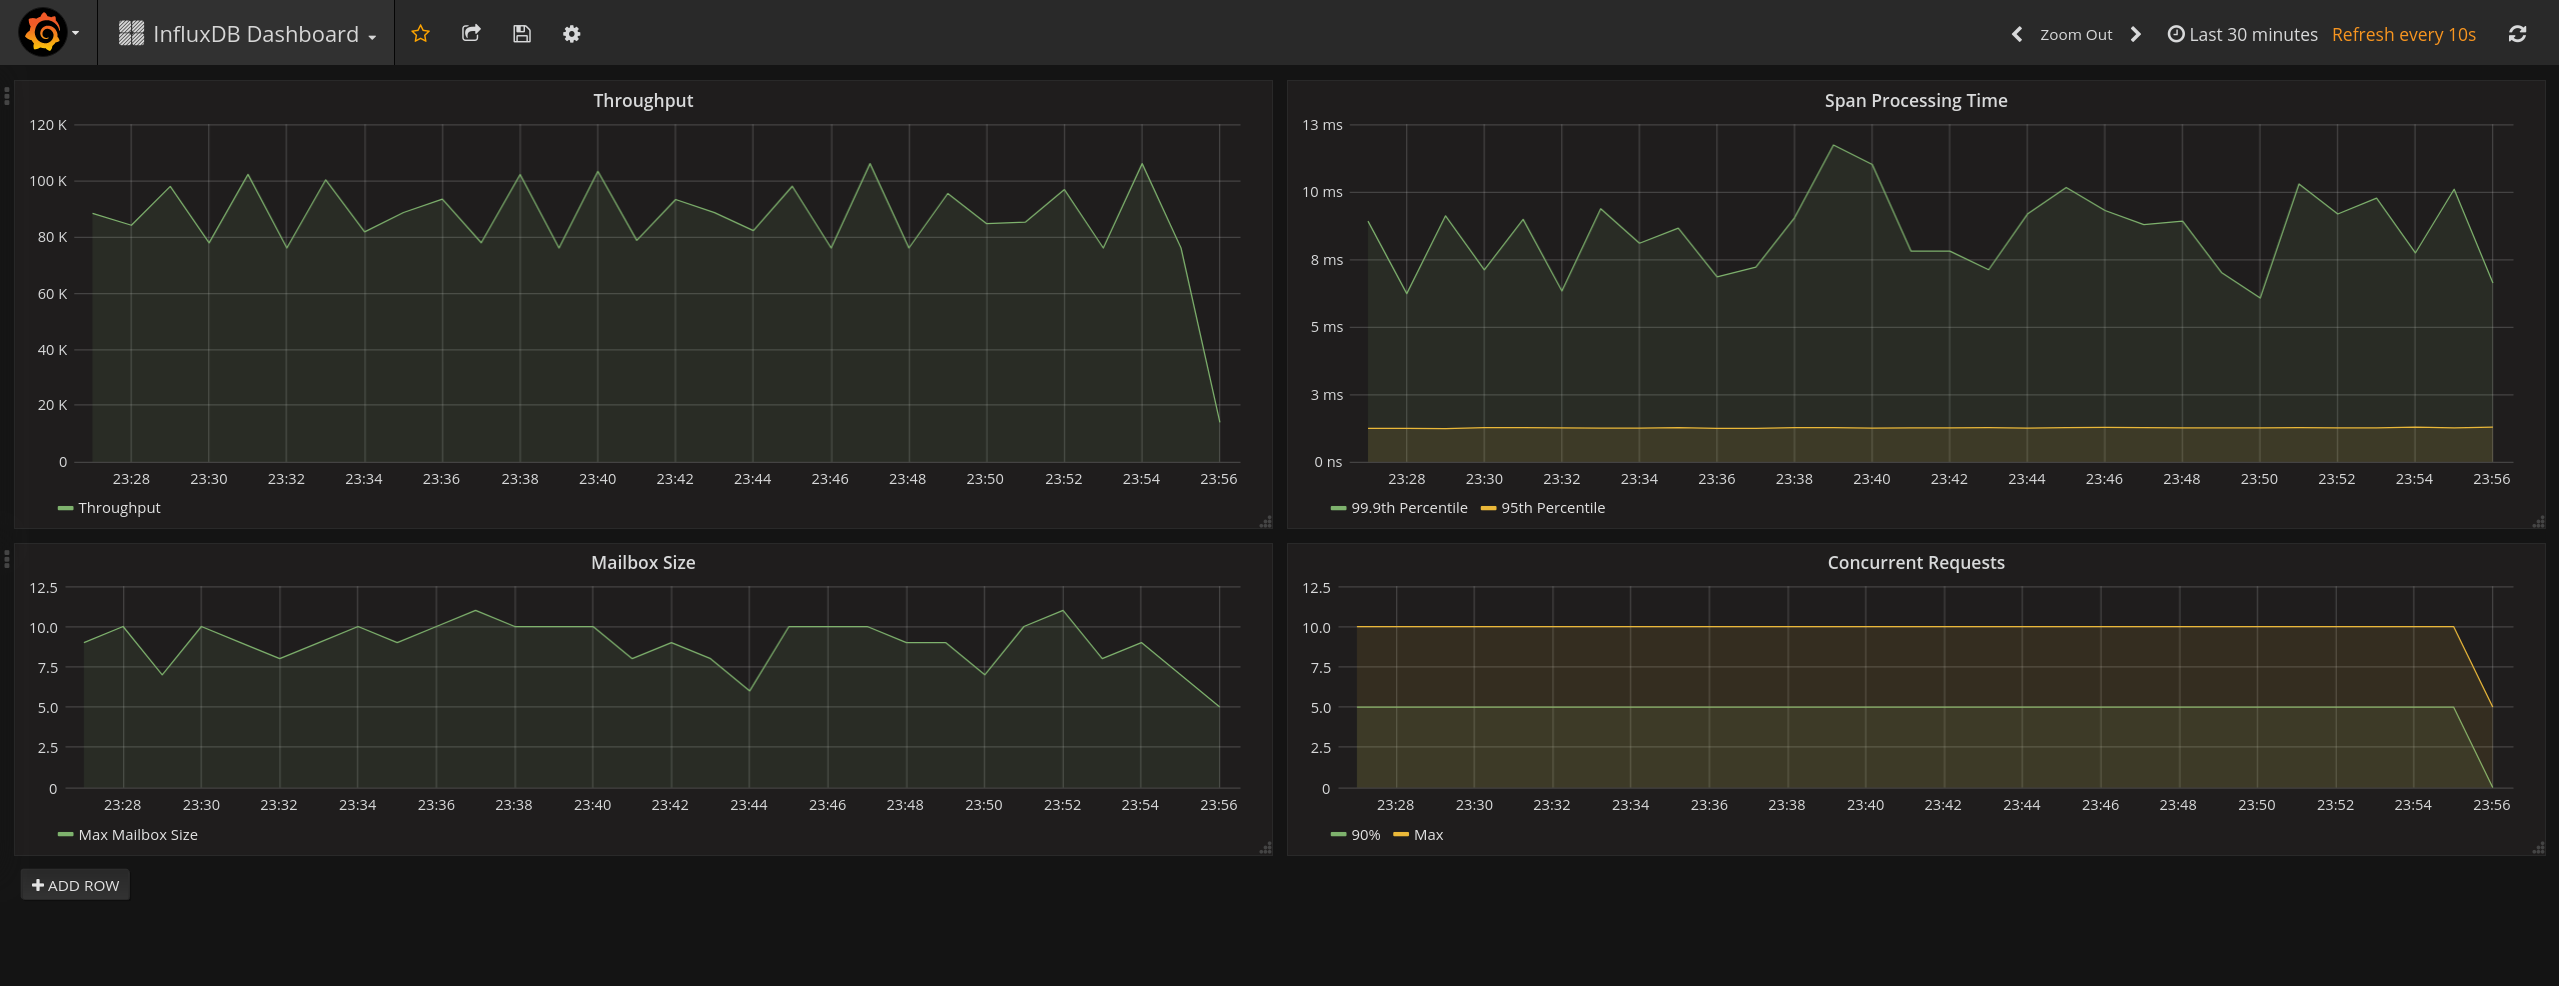
Visualization and Fun #
Here is a simple example showing some Actor and Span metrics using InfluxDB and Grafana together: