-
Core Concepts
-
Foundations
-
Advanced
-
-
Guides
-
First Steps
-
Frameworks
-
Migrations
-
-
Instrumentation
-
Available Instrumentation
-
-
Reporters
-
Combined Reporters
-
Metric Reporters
-
Span Reporters
-
You are viewing documentation for an outdated version. Do you wish to see documentation for the latest version?
Elementary Akka Setup #
This recipe will guide you through the process of monitoring the Akka Quickstart example application, one of the most basic and common examples you can find on the internet when learning how to use Akka. There is a guide explaining exactly what it does so it would be nice if you take a look there first to understand what the application does. We had a small change to the application, though: in order to make things more interesting we added a loop that randomly selects a greeter and sends a message to it, it looks like this:
  val allGreeters = Vector(howdyGreeter, helloGreeter, goodDayGreeter)
  def randomGreeter = allGreeters(Random.nextInt(allGreeters.length))

  while(true) {
    randomGreeter ! Greet
    Thread.sleep(100)
  }
Other than that, the application is roughly the same. We will take this application, add Kamon to it, publish metrics to that can be scraped with Prometheus and send trace data to Zipkin. Let’s get started!
Add the Kamon Libraries #
This example is using Akka 2.5, we will need to add kamon-akka-2.5 to our build as shown here:
libraryDependencies ++= Seq(
  "io.kamon" %% "kamon-core" % "1.1.0",
  "io.kamon" %% "kamon-logback" % "1.0.0",
  "io.kamon" %% "kamon-akka-2.5" % "1.0.1",
  "io.kamon" %% "kamon-prometheus" % "1.0.0",
  "io.kamon" %% "kamon-zipkin" % "1.0.0"
)
Setting up the Agent #
There are several ways to set up the AspectJ Weaver, we even wrote a guide specifically dedicated to it. Here we
will be running from SBT and just adding the sbt-aspectj-runner plugin to the build is enough to get it
working.
resolvers += Resolver.bintrayIvyRepo("kamon-io", "sbt-plugins")
addSbtPlugin("io.kamon" % "sbt-aspectj-runner" % "1.1.0")
Configure the Akka Filters #
You will need to explicitly tell Kamon which actors, routers, dispatchers and groups you would like to monitor and trace.
This application will start 4 different actors: helloGreeter, howdyGreeter, goodDayGreeter and printerActor. Now
imagine that your monitoring requirements include:
- Metrics on all actors, except for
howdyGreeter. - Metrics on all dispatchers.
- Message tracing for all actor messages.
All that can be achieved by simply providing the right filters under kamon.util.filters in your application.conf file
as shown below:
kamon.util.filters {
  "akka.tracked-actor" {
    includes = [ "**" ]
    excludes = [ "helloAkka/user/howdyGreeter" ]
  }

  "akka.tracked-dispatcher" {
    includes = [ "**" ]
  }

  "akka.traced-actor" {
    includes = [ "**" ]
  }

  "test" {
    includes = [ "**" ]
  }
}
Start Reporting your Data #
The last step in the process: start reporting your data! You can register as many reporters as you want by using the
Kamon.addReporter(...) function:
  Kamon.addReporter(new PrometheusReporter())
  Kamon.addReporter(new ZipkinReporter())
That’s it! Now you can simply sbt run the application and after a few seconds you will get the Prometheus metrics
exposed on http://localhost:9095/ and message traces sent to Zipkin! The default configuration publishes the Prometheus
endpoint on port 9095 and assumes that you have a Zipkin instance running locally on port 9411 but you can change these
values under the kamon.prometheus and kamon.zipkin configuration keys, respectively.
Metrics #
Once you got it running and got to http://localhost:9095/, something like this will show up:
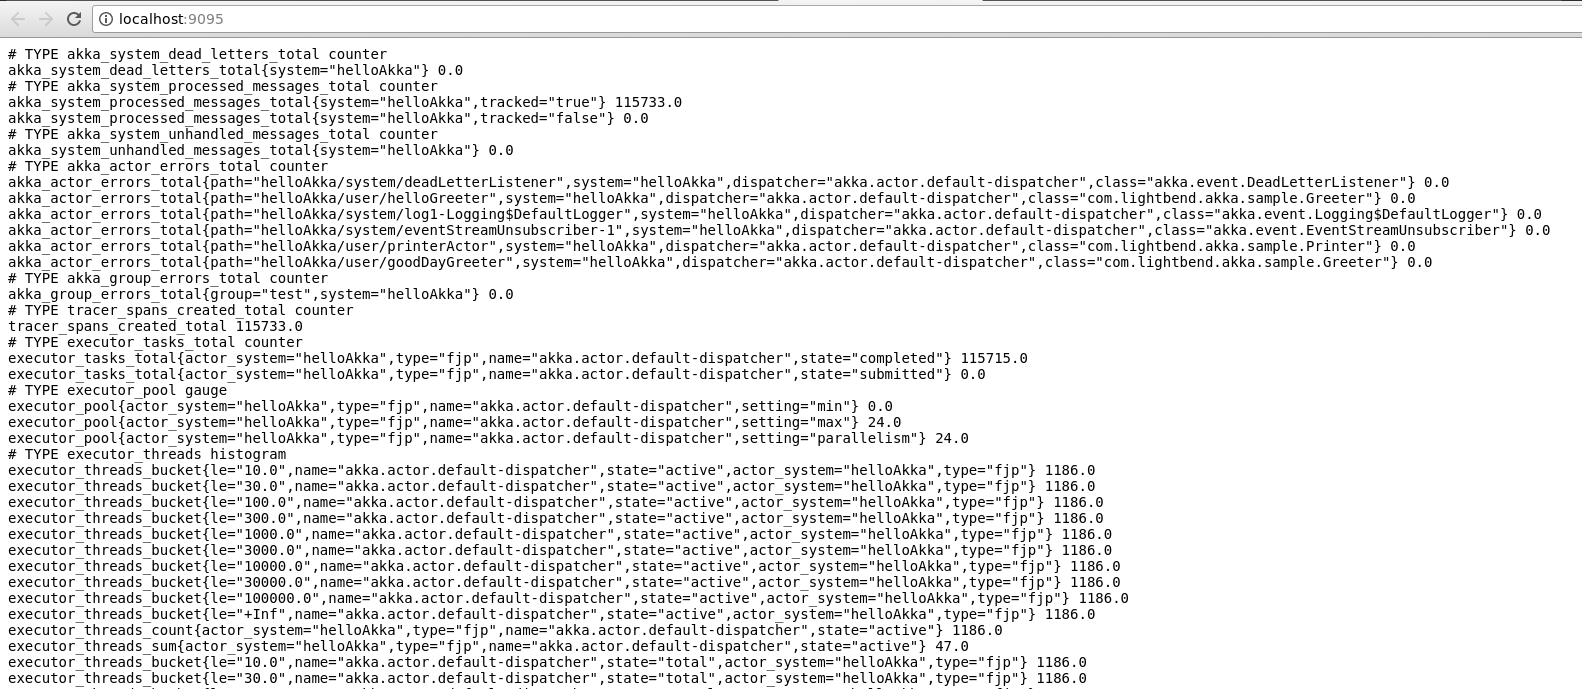
That means that your data is ready to be scraped by Prometheus! Once you configure this target in Prometheus you are ready to run some queries like this:
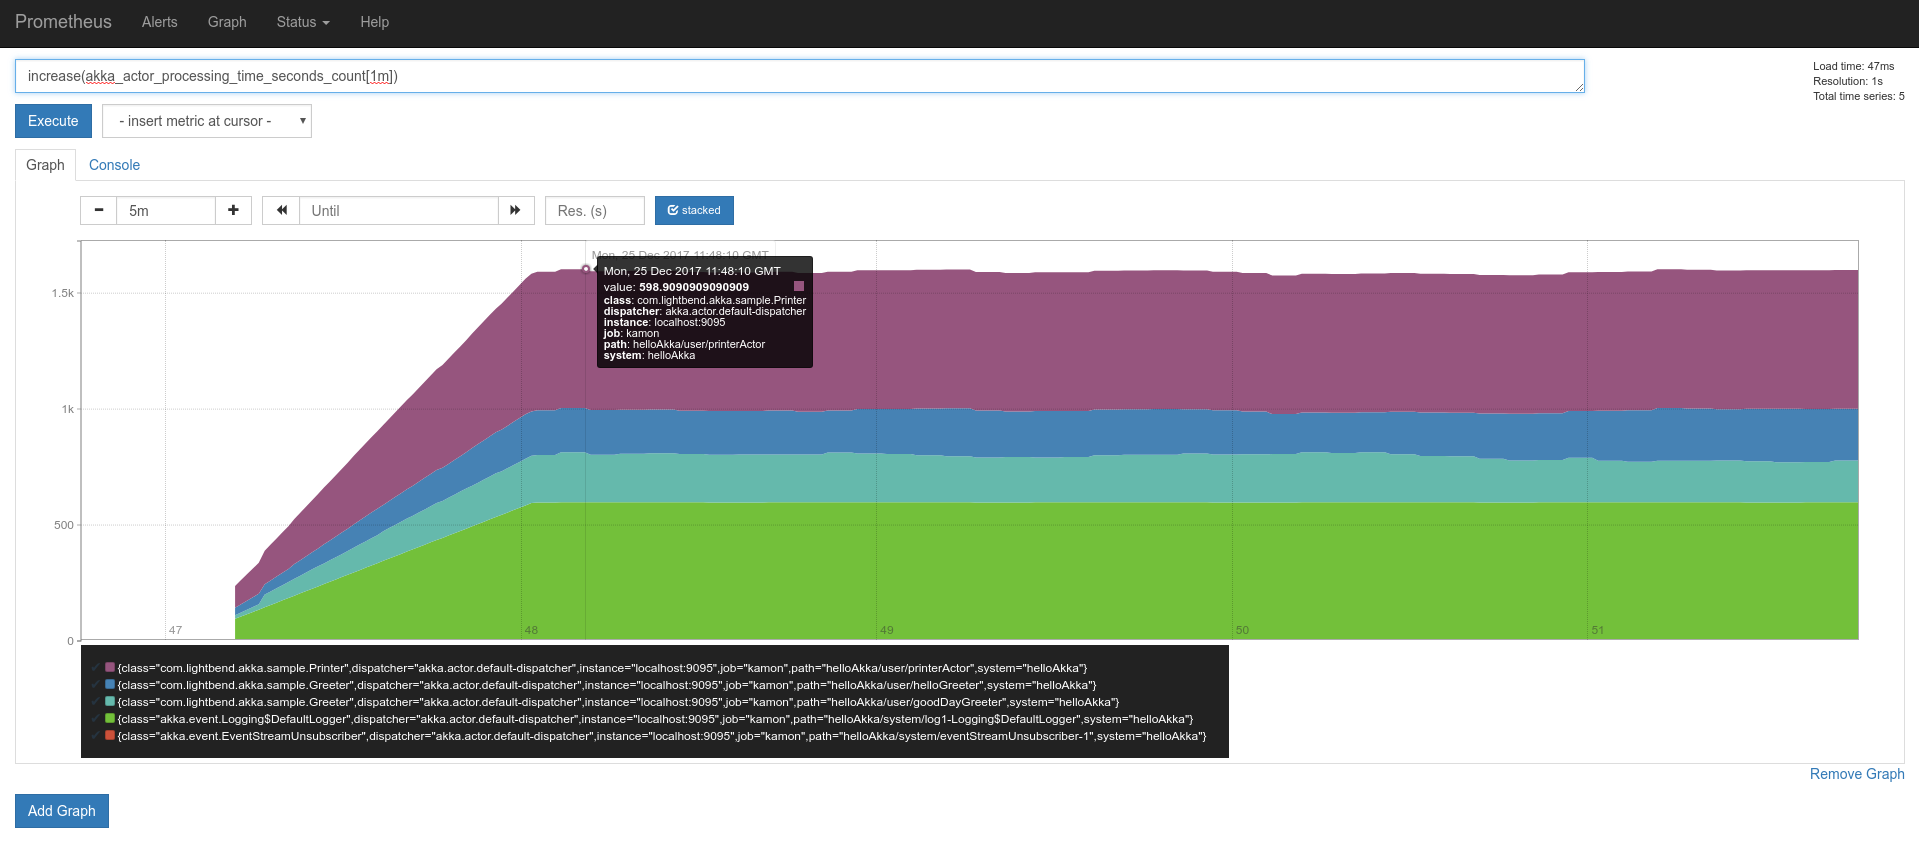
Those are the actor metrics that we configured Kamon to record. Notice how there are no metrics for the howdyActor.
Now you can go ahead, explore the available metrics and create your own dashboards!
Traces #
Assuming that you have a Zipkin instance running locally with the default ports, you can go to http://localhost:9411 and start investigating traces for this application. Once you find a trace you are interested in you will see something like this:
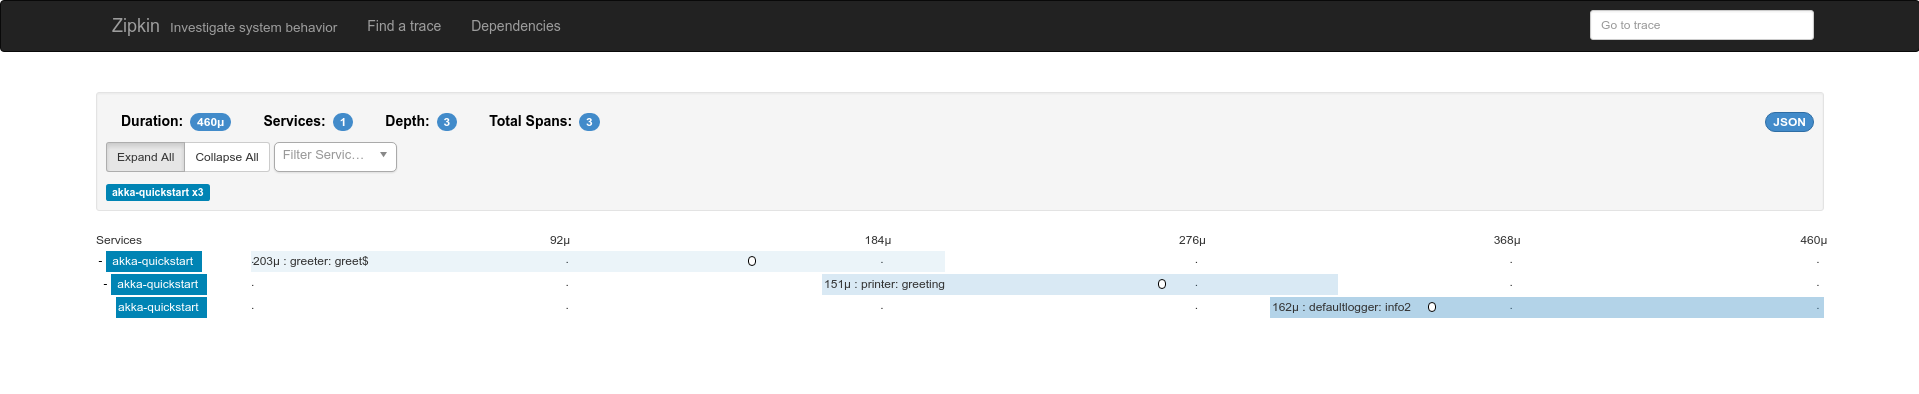
There are the Greet and Greeting messages going between actors, and a third message which is actually a log event
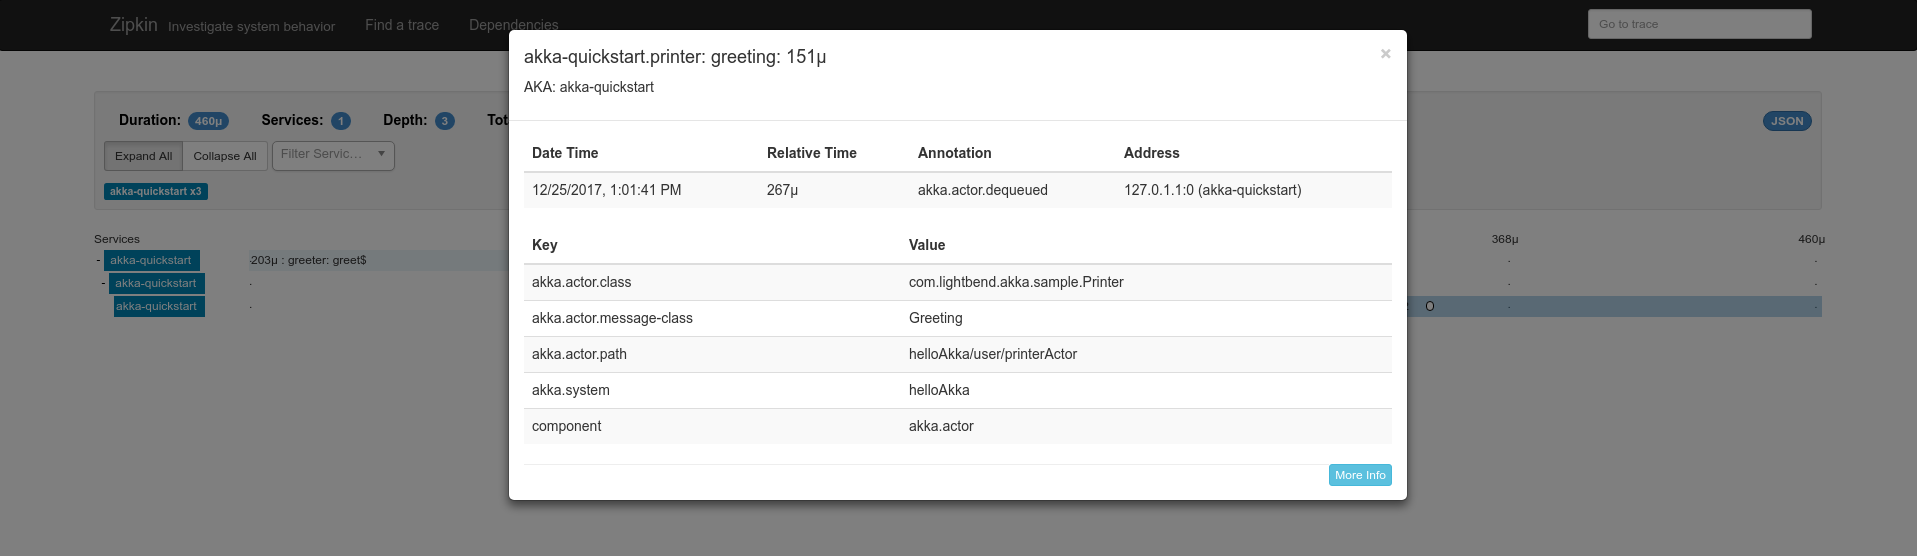
that gets executed asynchronously (you didn’t see that coming, right?). Clicking on a span will bring up a details view
where you can see all tags for the span and also you can see the akka.actor.dequeued mark (annotation in Zipkin’s
terms) which tells you at which point the message was dequeued from mailbox to start processing:
You made it! #
That’s it, you are now collecting metrics and tracing information from an Akka application. Next step: try it on your own application, have fun and let us know if anything goes wrong!