-
Core Concepts
-
Foundations
-
Advanced
-
-
Guides
-
First Steps
-
Frameworks
-
Migrations
-
-
Instrumentation
-
Available Instrumentation
-
-
Reporters
-
Combined Reporters
-
Metric Reporters
-
Span Reporters
-
You are viewing documentation for an outdated version. Do you wish to see documentation for the latest version?
Metric Instruments #
Kamon provides five different metric recording instruments in its core metrics API. Each instrument might be slightly different in implementation than what other metrics libraries offer so we recommend to take a bit of time to understand how each instrument works and how they might differ from what you have seen before.
One important differentiator is that all Kamon instruments are write-only. You can dump data on all of them but the only way to read the recorded information is to have a registered reporter that will process the metrics data upon every tick.
Counters #
The counter is the simplest one, it just counts how many times it was incremented during a reporting period. Some other libraries allow counters to increment and decrement but we only allow them to increment. They are ideal for counting errors or occurrences of specific events in your service.
Gauges #
Gauges track a single value that can be incremented, decremented or explicitly set. Once a gauge is set to a value it will always report the same value in subsequent reporting periods until its value is changed or the application shuts down. Gauges are good for slow moving variables, like available memory and disk usage.
Histograms #
Histograms track the entire value distribution of a given metric. When measuring value distributions (like latency) it is hard to know upfront what information is important for you - is it the median? the average? (hell no!), the maximum? the standard deviation? percentiles? what percentiles? 95%? 98%? 99%? 99.99%?. Kamon doesn’t take that decision for you, instead it stores all measurements taken from your application and lets the reporting modules decide what’s the best that can be done with the data.
Some applications process millions of events per second, meaning that millions of measurements will be taken every second. You might be asking yourself: is it possible to store millions of measurements efficiently without incurring in significant memory and CPU overhead? Yes, it is possible, thanks to the HdrHistogram developed by Gil Tene and that is what powers Kamon’s histogram.
The HdrHistogram mixes linear and exponential bucket systems to produce a unique data structure capable of recording
measurements with configurable precision and fixed memory and CPU costs, regardless of the number of measurements
recorded. Under the hood, the HdrHistogram stores all the data in a single array of longs as occurrences of a given value,
adjusted with the precision configuration provided when creating the HdrHistogram. For example, if we were to store a
recording of 10 units in an HdrHistogram with an underlying array similar to the one shown in the diagram below, all
that’s needed is to add one to the value in the ninth bucket.
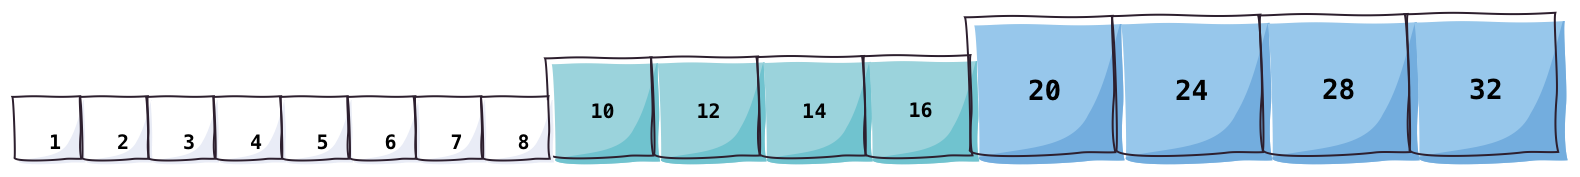
If you need to store a recording of 19 units, then the lower closest bucket is used, in this case the thirteenth bucket corresponding to the value 20 is used. The actual number of buckets necessary for a HdrHistogram is calculated based on two values passed upon creation:
-
number of significant value digits: Gives you control over the precision with which values are recorded in the HdrHistogram. If you create a HdrHistogram tracking values with three significant value digits of precision, then the required number of buckets is calculated to ensure that all recordings fall into buckets that do not differ by more than 0.1% from the original value. Two significant value digits give you 1% precision and one significant value digit gives you 10% precision. Kamon always uses two significant value digits by default.
-
maximum trackable value: Gives you control over the range of values that can be covered by the HdrHistogram. Kamon uses 3.600.000.000.000 (one hour in nanoseconds) by default.
The underlying data structure (the array of longs) is allocated only once when the HdrHistogram is created and it is reused
during the lifetime of the monitored entity.
This is just a high level overview, we highly encourage you to read the documentation available in the HdrHistogram site to get a better understanding of how it works.
Timers #
A timer isn’t much than a simple wrapper for a histogram, but with a bit of extra API surface that allows you to start()
the timer and later stop() the StartedTimer instance that you get back. Timers produce a value distribution with all
recorded latencies on every reporting period.
Range Samplers #
Range samplers are an unusual type of instrument, only seen so far in Kamon. When monitoring queues, like we do for actor mailboxes, just having a number going up and down (like a traditional gauge) that is collected once at a reporting tick isn’t enough. Many things can happen to a queue between recordings, such as you could get a million messages in a queue and process them all before the next recording, seeing a value of 0 that does not reflect the fact that the queue had a million elements just a few seconds ago.
When monitoring a queue size it is not just about knowing where it is at a given moment because that number is probably incorrect right after reading it, but knowing where it was is of great help. The range sampler internally tracks three variables: the current value, the minimum and the maximum observed value. These three values are read and stored in a histogram every 200 milliseconds (by default) and produce a value distribution on each reporting interval.
After each observation, the minimum and maximum tracking variables are reset to the current value, meaning that if no changes occur then the three of them will have the same value when the next observation happens.