You are viewing documentation for an outdated version. Do you wish to see documentation for the latest version?
Reporting Metrics to StatsD #
StatsD is a simple network daemon that continuously receives metrics over UDP and periodically sends aggregate metrics to upstream services like (but not limited to) Graphite. Because it uses UDP, sending metrics data to StatsD is very fast with little to no overhead.
Installation and Startup #
libraryDependencies += "io.kamon" %% "kamon-statsd" % "1.0.0"
    <dependency>
      <groupId>io.kamon</groupId>
      <artifactId>kamon-statsd_2.13</artifactId>
      <version>1.0.0</version>
    </dependency>
implementation 'io.kamon:kamon-statsd_2.13:1.0.0'
Once you have the dependency on your classpath, start the reporter:
Kamon.addReporter(new StatsDReporter())
Network Settings #
At the very basic level, you will certainly want to use the kamon.statsd.hostname and kamon.statsd.port configuration
keys to ensure your data is being sent to wherever your StatsD instance is running.
Metric Names #
Since StatsD has a hierarchical metrics model this module has to apply special rules to convert Kamon’s metric name + tags into a single metric name that contains all this information. By default the following format will be used:
[service-name].[hostname].[metric-name].[tag[0].name].[tag[0].value].[tag[1].name].[tag[1].value]...
Where tags are ordered alphabetically before being added to the metric name. If you wish to change the way metric
keys are generated you can supply your own implementation of kamon.statsd.MetricKeyGenerator using the
kamon.statsd.metric-key-generator setting.
Metric Units #
Kamon keeps all timing measurements in nanoseconds and memory measurements in bytes. In order to scale those to other
units before sending to StatsD, set time-units and memory-units config keys to desired units. Supported units are:
n  - nanoseconds
µs - microseconds
ms - milliseconds
s  - seconds

b  - bytes
kb - kilobytes
mb - megabytes
gb - gigabytes
For example, the following setting:
kamon.statsd.time-units = "ms"
will make the kamon-statsd module scale all timing measurements to milliseconds right before sending to StatsD.
Visualization and Fun #
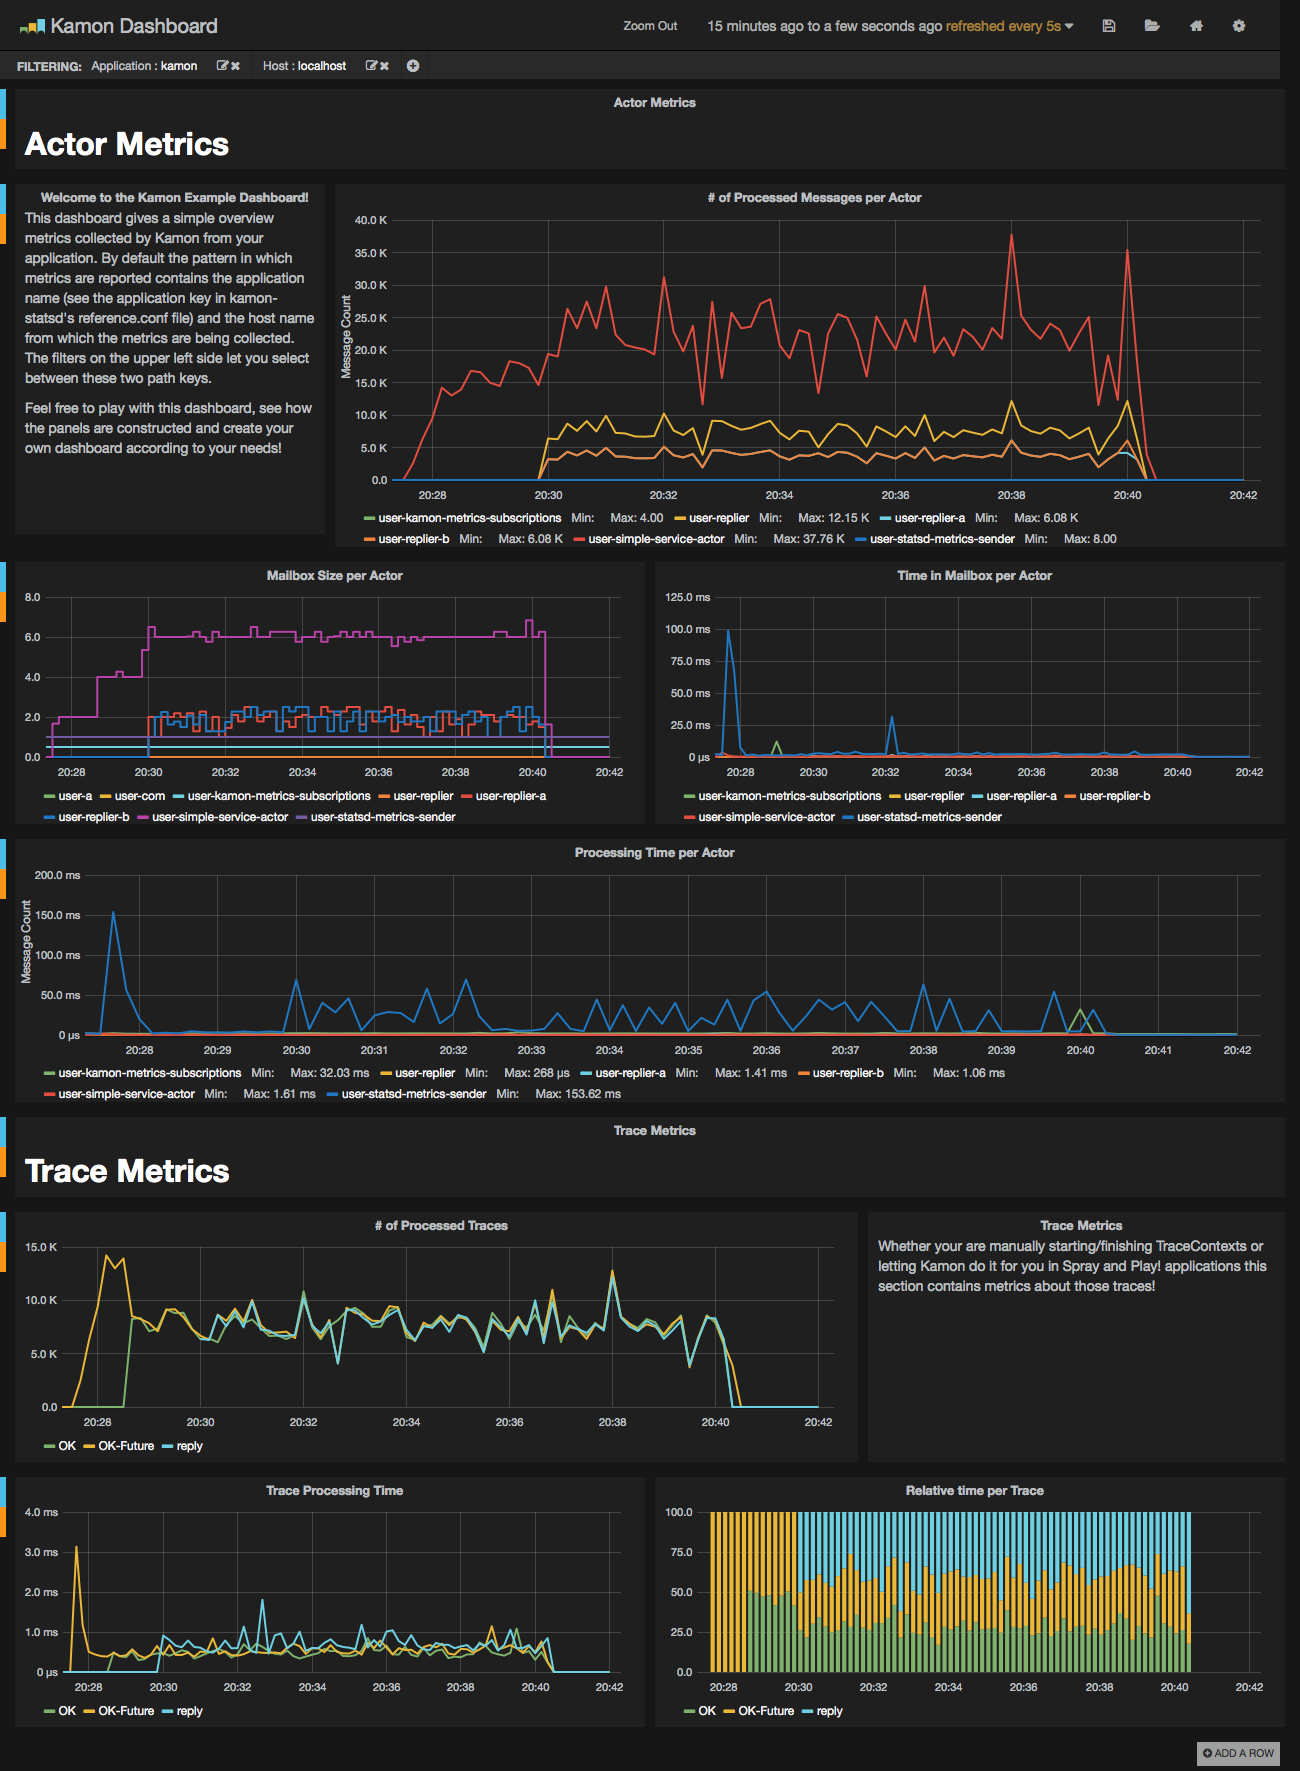
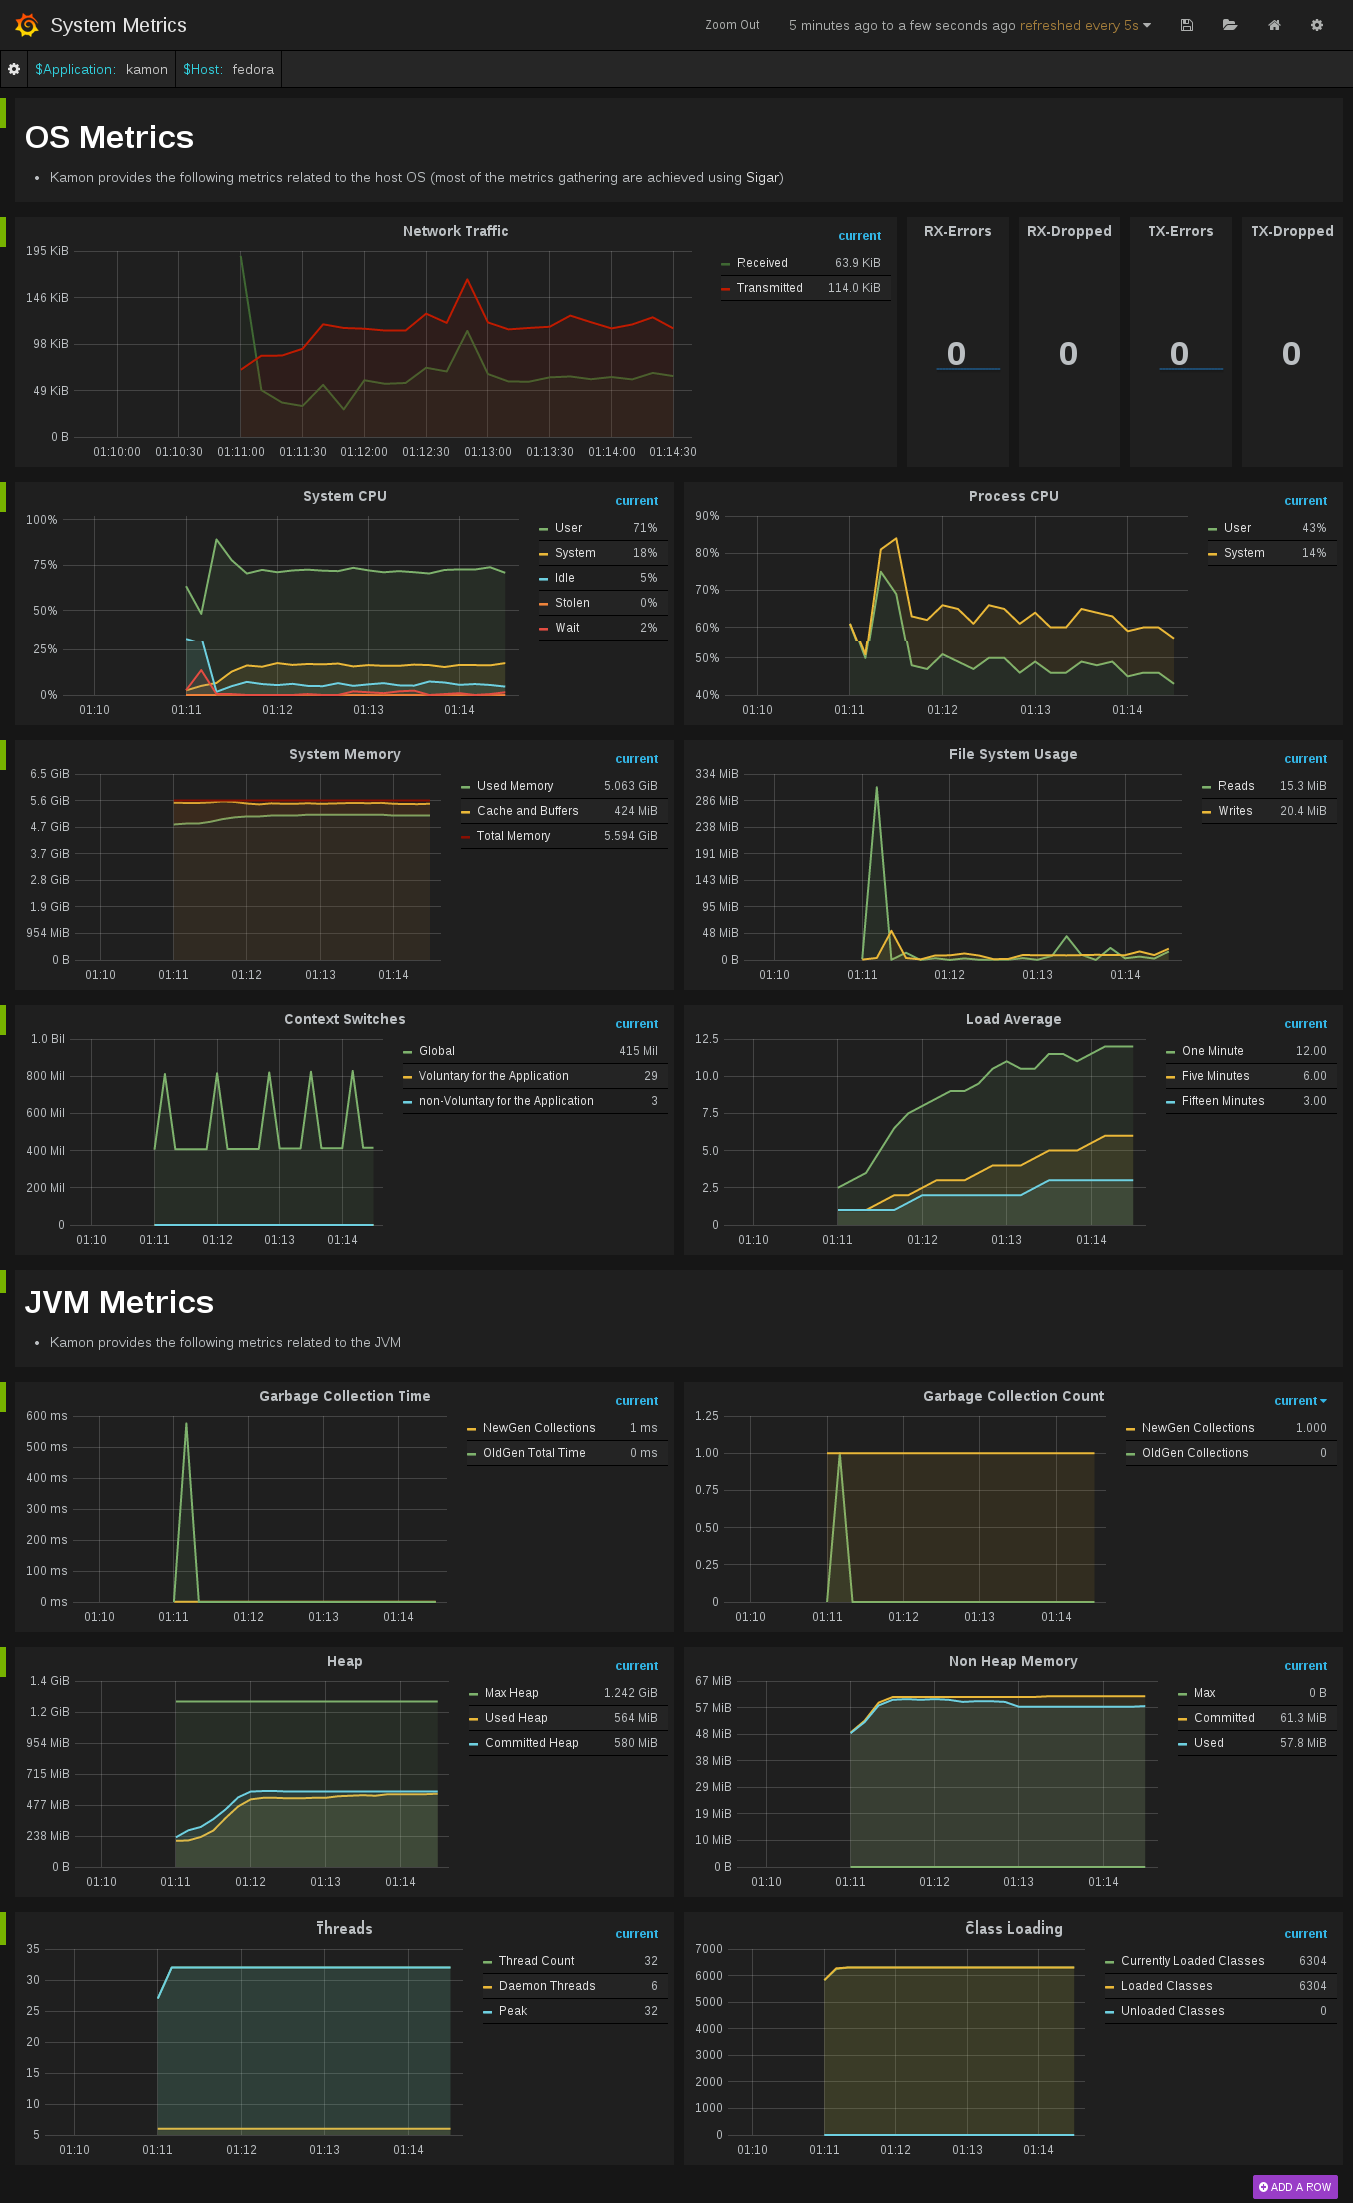
StatsD is widely used and there are many integrations available, even alternative implementations that can receive UDP messages with the StatsD protocol, you just have to pick the option that best suits you. For our internal testing we choose to use Graphite as the StatsD backend and Grafana to create beautiful dashboards with very useful metrics. Have an idea of how your metrics data might look like in Grafana with the screenshot below or use our docker image to get up and running in a few minutes and see it with your own metrics!
TODO: Update the dashboards and images.

