In this post we’ll show how to collect system metrics from Docker containers, making use of a very simple application that relies on Akka Streams/HTTP and all the benefits of Kamon’s machinery.
Unless you were living under a rock and that rock is under the Titanic, then you must have heard about Docker. Nowadays Docker is everywhere and all sorts of things can run in a container. You might already be using Docker for CI purposes or even in production and when you do so, well, monitoring needs to be there too! We did a bit of exploration on monitoring the very basic metrics we would like to get out of a container:
- CPU usage
- Memory usage
- IO usage
- Network usage
How do we get these Metrics?
If you feel like complicating your life with this, you can use the container ID to fetch CPU, Memory and IO metrics from
/sys/fs/cgroup/... but then there is one missing thing: Network usage metrics. As it turns out, the Docker network
interfaces only exist under a network namespace, which we didn’t want to investigate further as recent versions of
Docker provide a much better and cool alternative for this: the Docker Remote API.
The Docker Remote API is very easy to use, you just send a GET request to /container/${container-id}/stats and
you will get back a live stream of events with all the desired metrics for such container. A live Stream, by now you
should clearly see where this is going :).
Preparing your Docker Host
You will need to do a little change to your /etc/default/docker file, setting the DOCKER_OPTS variable to the
following:
DOCKER_OPTS='-H tcp://0.0.0.0:4243 -H unix:///var/run/docker.sock'That configuration change will make Docker bind to port 4243 and there is where the Remote API will be available. Save
your changes, restart the docker service via service docker restart and then we are good to go. When you hit the
Remote API endpoint for a given container you will get one event per second containing the container stats.
Setting up the Project
This test application is being written in Scala, with SBT as the build tool, so we will start by adding the following dependencies:
"io.kamon"    	      %% "kamon-core"             	        % "0.5.1",
"io.kamon"            %% "kamon-statsd"                     % "0.5.1",
"com.typesafe.akka"   %% "akka-stream-experimental"         % "1.0.0",
"com.typesafe.akka"   %% "akka-http-core-experimental"      % "1.0.0",
"com.typesafe.akka"   %% "akka-http-experimental"           % "1.0.0"
As we mentioned above, the Docker Remote API gives you a live stream of events with the container stats and, of course, we will use Akka Streams to consume and transform such stream. Our intention here is not to make a formal introduction to Akka Streams but rather to show how it can help us consume these events in combination with Kamon, but, if you feel like reading then we would like to recommend reading Mark Hamrah’s Introduction to Streams.
Let’s skim through some of the code:
implicit val system = ActorSystem() // (1)
implicit val materializer = ActorMaterializer()

...
val network = Flow[ContainerStats].map(stats => (stats \ "network").extract[NetworkStats]) // (2)
val memory = Flow[ContainerStats].map(stats => (stats \ "memory_stats").extract[MemoryStats])
val cpu = Flow[ContainerStats].map(stats => (stats \ "cpu_stats").extract[CpuStats])
...- (1) The
ActorSystemandActorMaterializerare the basic infrastructure needed so that our streams can actually get materialized and executed. - (2) A Flow has exactly one input and one output. In our code above, the flows consume a
ContainerStatsmessage (with all stats) and produce an entity with Network, Memory or Cpu stats.
Stats Flow
...
def flowWriter(...) = {
  Sink[ContainerStats]() { implicit builder =>
    import FlowGraph.Implicits._

    val stats = builder.add(Broadcast[ContainerStats](3))

    stats ~> network ~> networkSink
    stats ~> memory ~> memorySink
    stats ~> cpu ~> cpuSink
    stats.in
  }
}
...
We want to record the stats in different Kamon entity recorders for each metric type, that is why we are broadcasting
the incoming “fat” ContainerStats message into several flows, so that each one can take whatever it finds interesting.
The Broadcast element simply emits elements from its input port to all of its output ports.
The most important part are the last couple lines of the above code. Here we draw a graph that defines how messages flow through the stream. The high level overview would be: get the stream, broadcast it to the network, memory and cpu smaller flows and let them record the stats into Kamon recorders independently.
Stats Sinks
A Sink is the endpoint for the stream. The data from the stream will eventually find it’s way to a Sink.
def chunkConsumer(...) = Sink.foreach[HttpResponse] { response =>
    ...
    val networkSink = Sink.foreach(NetworkMetrics(...))
    val memorySink = Sink.foreach(MemoryMetrics(...))
    val cpuSink = Sink.foreach(CpuMetrics(...))
    ...
}
The sinks we have here are very simple as they just grab the correspondent stats type and consume it by recording into the desired entity recorder. Take a look at how NetworkMetrics, MemoryMetrics and CpuMetrics are implemented.
Selecting the Containers
For this application we went with a very simple and fixed approach, just set the container names you want in the configuration file and metrics for them will be fetched upon startup.
...
docker {
  # The Docker Host.
  host = "127.0.0.1"

  # The Docker TCP port.
  port = 2375

  # List of images they need to be monitored.
  # For convenience must provide an alias in order to facilitate the visualization
  # [{"container-id","container-alias"}]
  containers = [{"container-1":"awesome-container-1"},{"container-2":"awesome-container-2"}]
}
...
Visualization and Fun!
By default the application is configured to use with StatsD through Kamon. The only thing we need to start visualizing
this stats is our Docker-Grafana-Graphite image that comes bundled with StatsD, Graphite and Grafana. After starting up this application
and playing a bit with a Grafana dashboard you can start getting something like this:
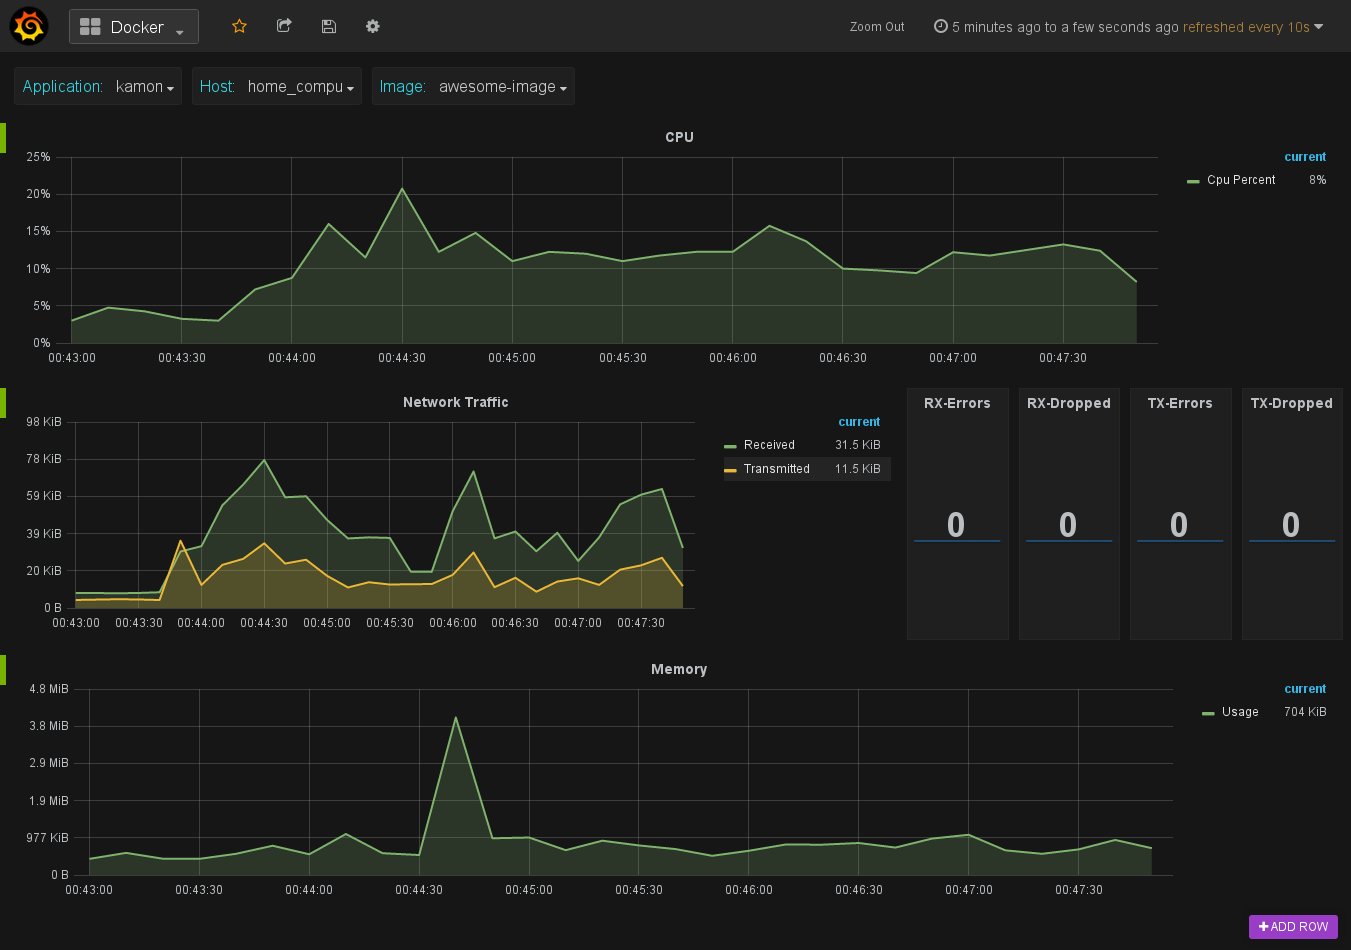
Cool, isn’t it? just a few lines of code, mostly dealing with the streams and bum! Metrics for your Docker containers! Of course, the full code is available at the Github Domino Repo, don’t hesitate to clone, fork and start experimenting yourself!
Future Work
Here are a few things we would like to add in the future:
- Include
Disk Utilizationmetrics. - Pack this into a container that can be easily fired on any Docker host.
- Be more flexible about which containers are monitored, probably following the same filters approach we have in Kamon for other modules such as the Akka module.
And of course, your ideas can help improve this project too. Feel free to leave comments, suggestions and maybe even some pull request. That’s all for today, enjoy!