
Observability Tools for
Developers, not DevOps/SRE
Monitor your backend applications, fix performance issues, and get alerted when problems happen. All without being a monitoring expert.
Start with a FREE accountyou already use


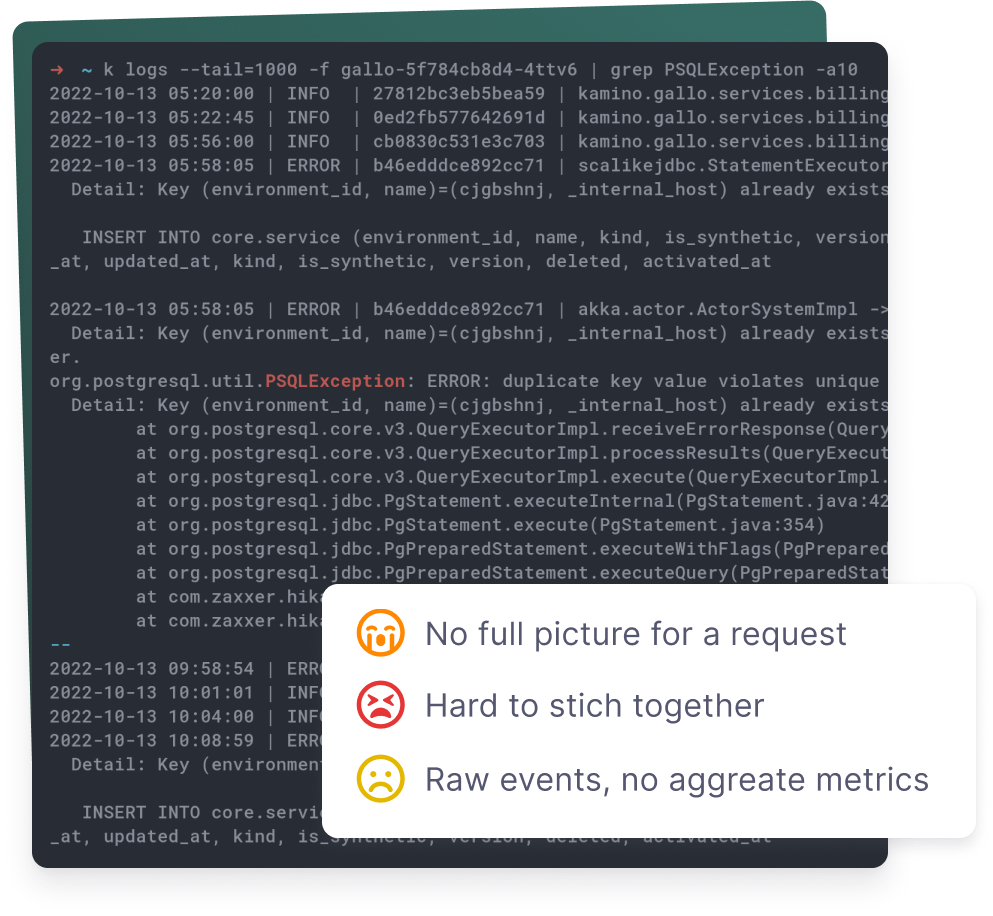
Tailing the logs is not enough
Everybody starts monitoring with logs because they are there by default. Just connect to your server and start tailing.
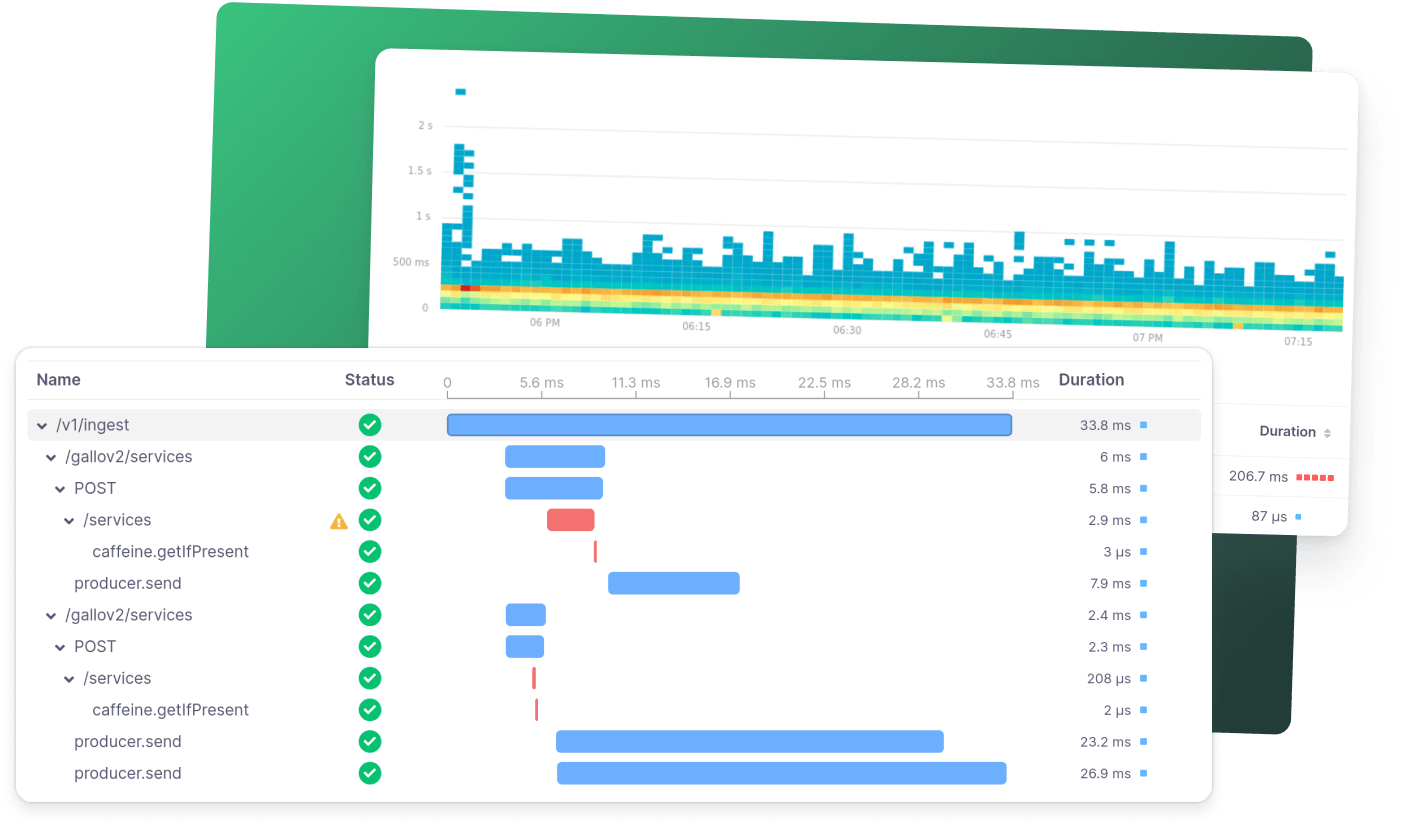
But logs have a hard time showing you the overall response times for your application, or whether certain calls to the database are happening in sequence or parallel (among a million other things).
The solution is not to ditch logging, though. You get the best troubleshooting powers by complementing your logs with application-level metrics and traces, and that's what we help you achieve.
companies of all sizes love, including:


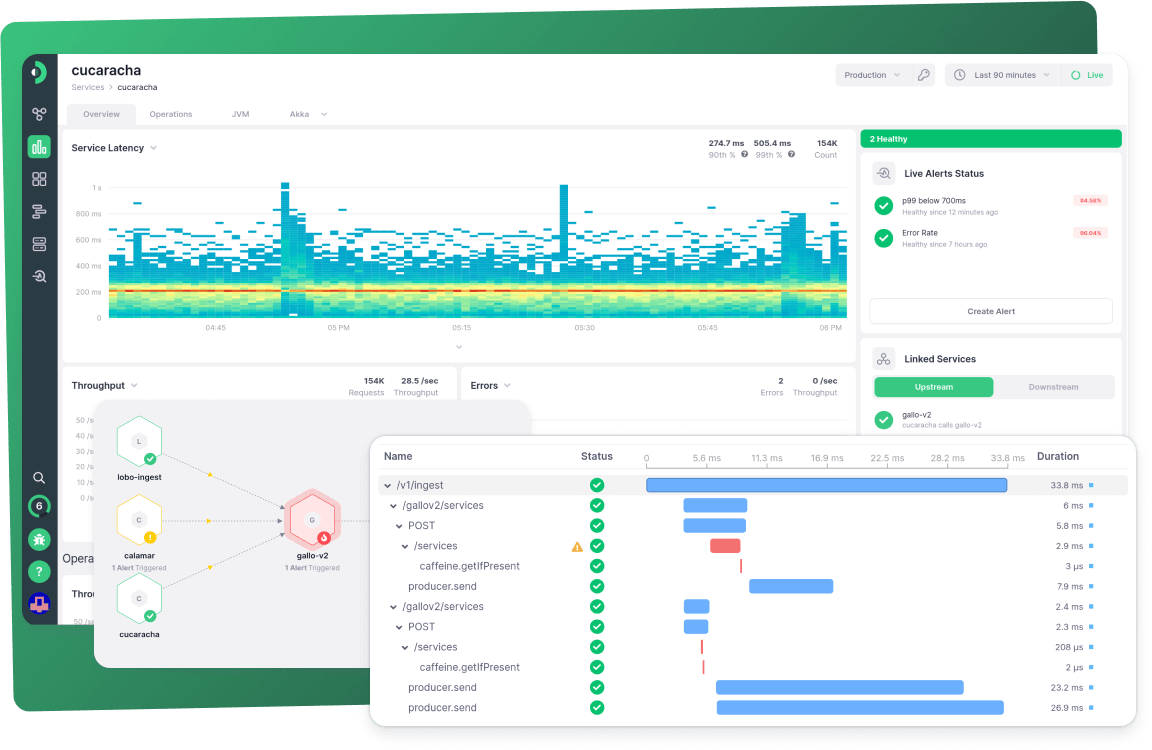
Monitor your backend applications, fix performance issues, and get alerted when problems happen. All without being a monitoring expert.
- Integrates with all major platforms
- Curated and ready-to-use automatic dashboards
- Correlated high-fidelity metrics and traces
- No complicated setups or infrastructure to maintain. Get started in 10 minutes or less
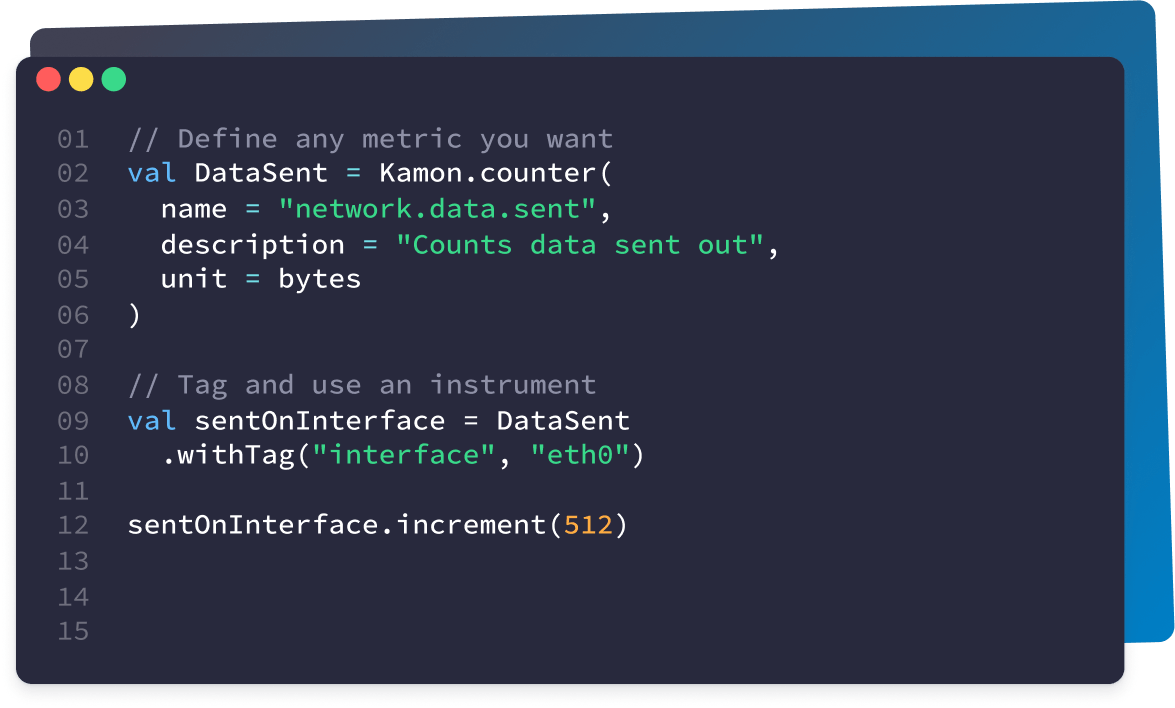
Instrument Scala applications to generate metrics, traces, and correlated logs
- Works with Akka, Play Framework, Cats Effect, and many more libraries
- Manual and Automatic instrumentation for code-free observability
- Integrates with Kamon APM, Prometheus, Jaeger, Datadog, and many more
- Free and Open Source