Live Kamon Installation Walkthrough
Learn how to install and use Kamon to generate the metrics and traces that every microservice should expose
On this Webinar
You'll learn how to use Kamon to instrument an Akka HTTP application and generate the basic telemetry data every microservice should expose:
- Throughput, latency, and error metrics from your HTTP server
- JVM metrics to track memory usage and garbage collection times
- Instrument client calls to other microservices, databases, and external APIs
- Include trace ids and other context information in your logs
The live walkthrough is based on Akka HTTP, but roughly the same steps will work out with Play and Lagom Framework applications so feel free to join and learn!
Date and Time
Our next session is on September 15th, at 13:00 UTC
About the Speaker

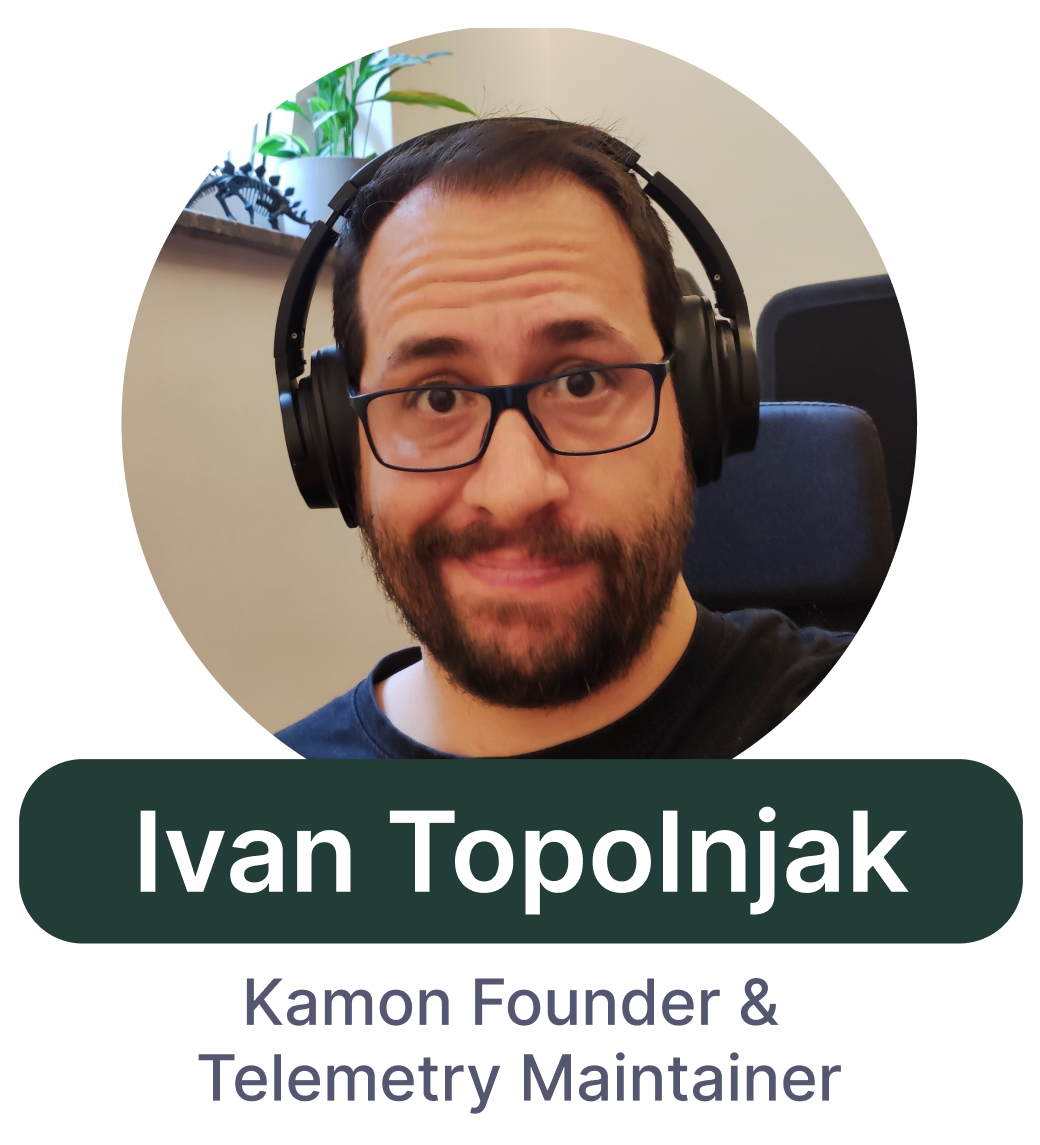
Ivan will be doing the live walkthough and answering any questions you might have. Ivan is the founder @ Kamon, where he has poured almost a decade of efforts into instrumenting and monitoring applications built with Akka, Play Framework, and the JVM in general.
As part of the Kamon team, Ivan works closely with developers to go from zero to production-ready observability with Kamon