Generate metrics and traces
with minimal code changes
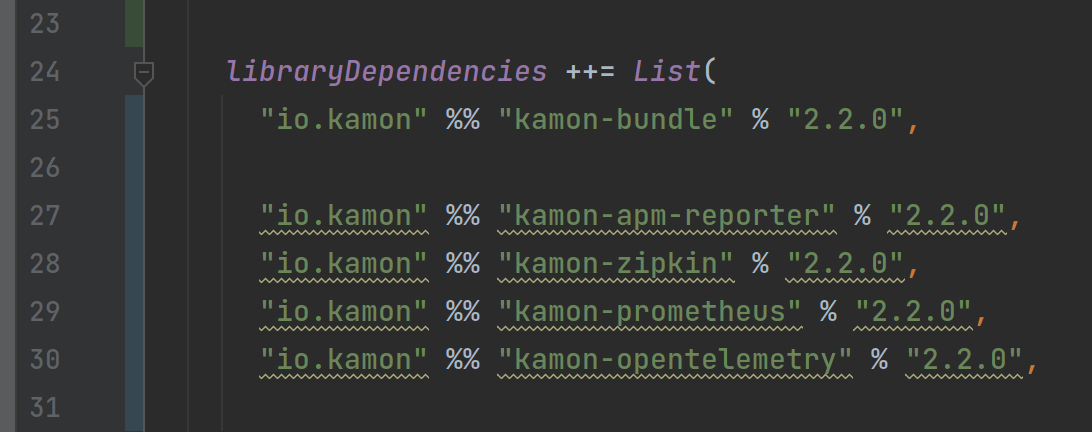
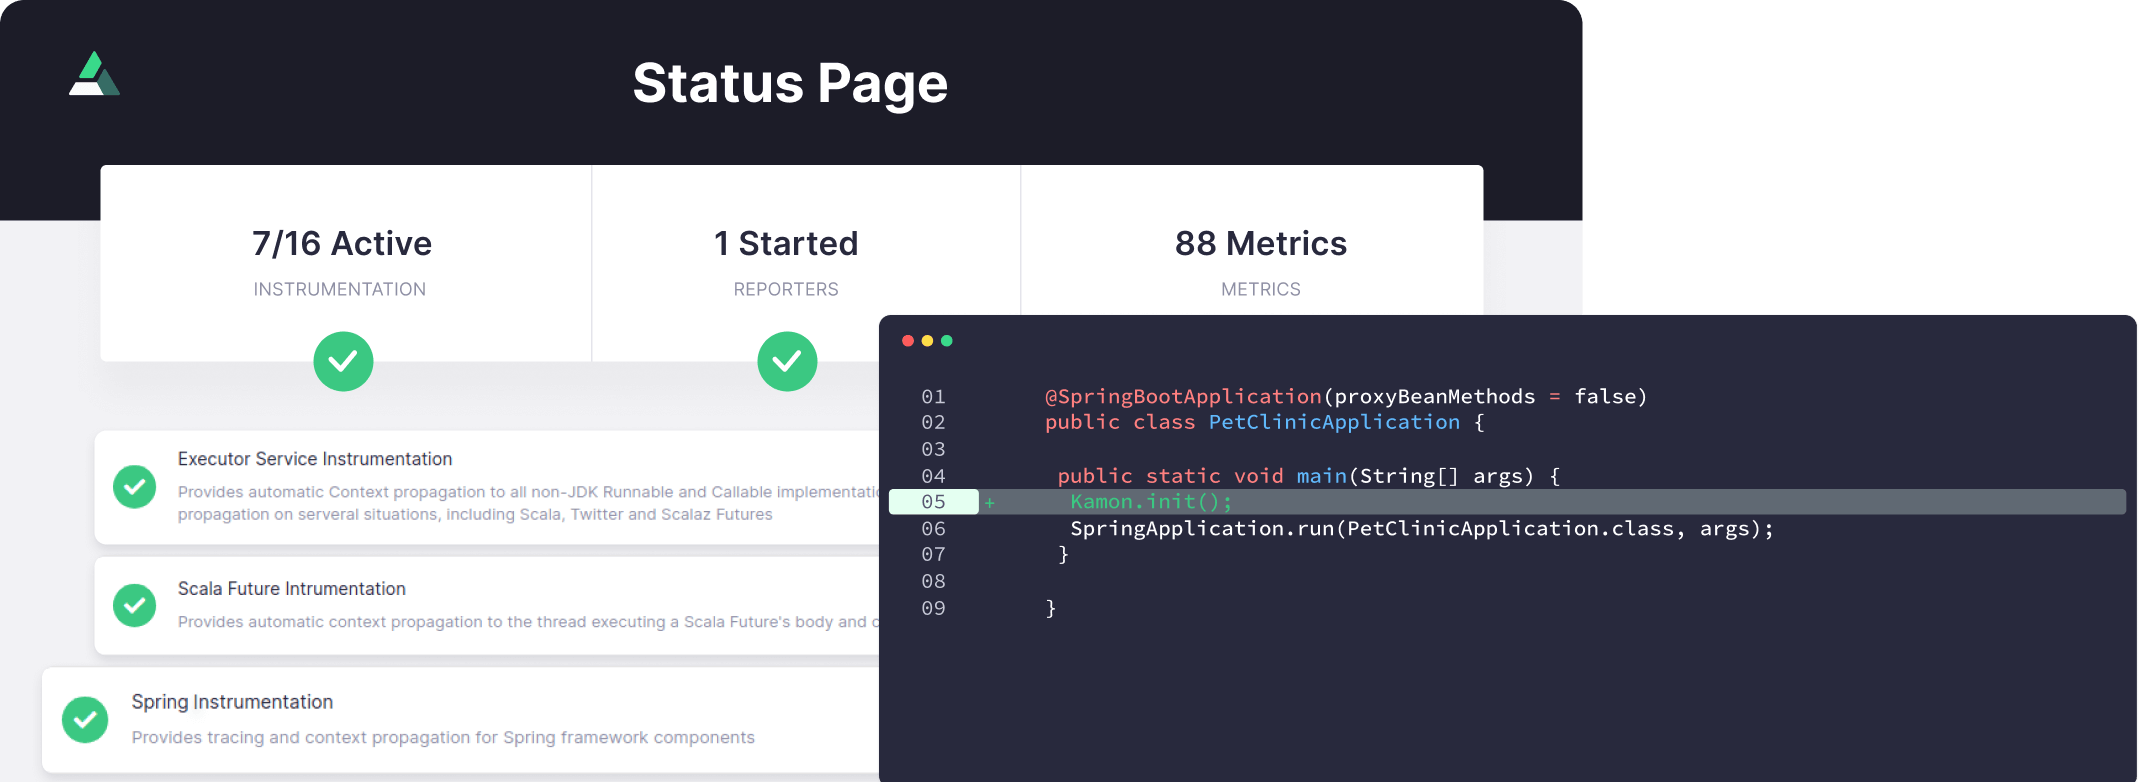
Add a few lines of code and generate the metrics & traces you
need to troubleshoot production issues in Java, Scala, and Kotlin applications
Instrument your platform from end to end, automatically
Metrics are great for monitoring. Traces are great for debugging. You need both. Get a ton of insights out of the box with automatic instrumentation, then enrich them with your own tags and custom metrics
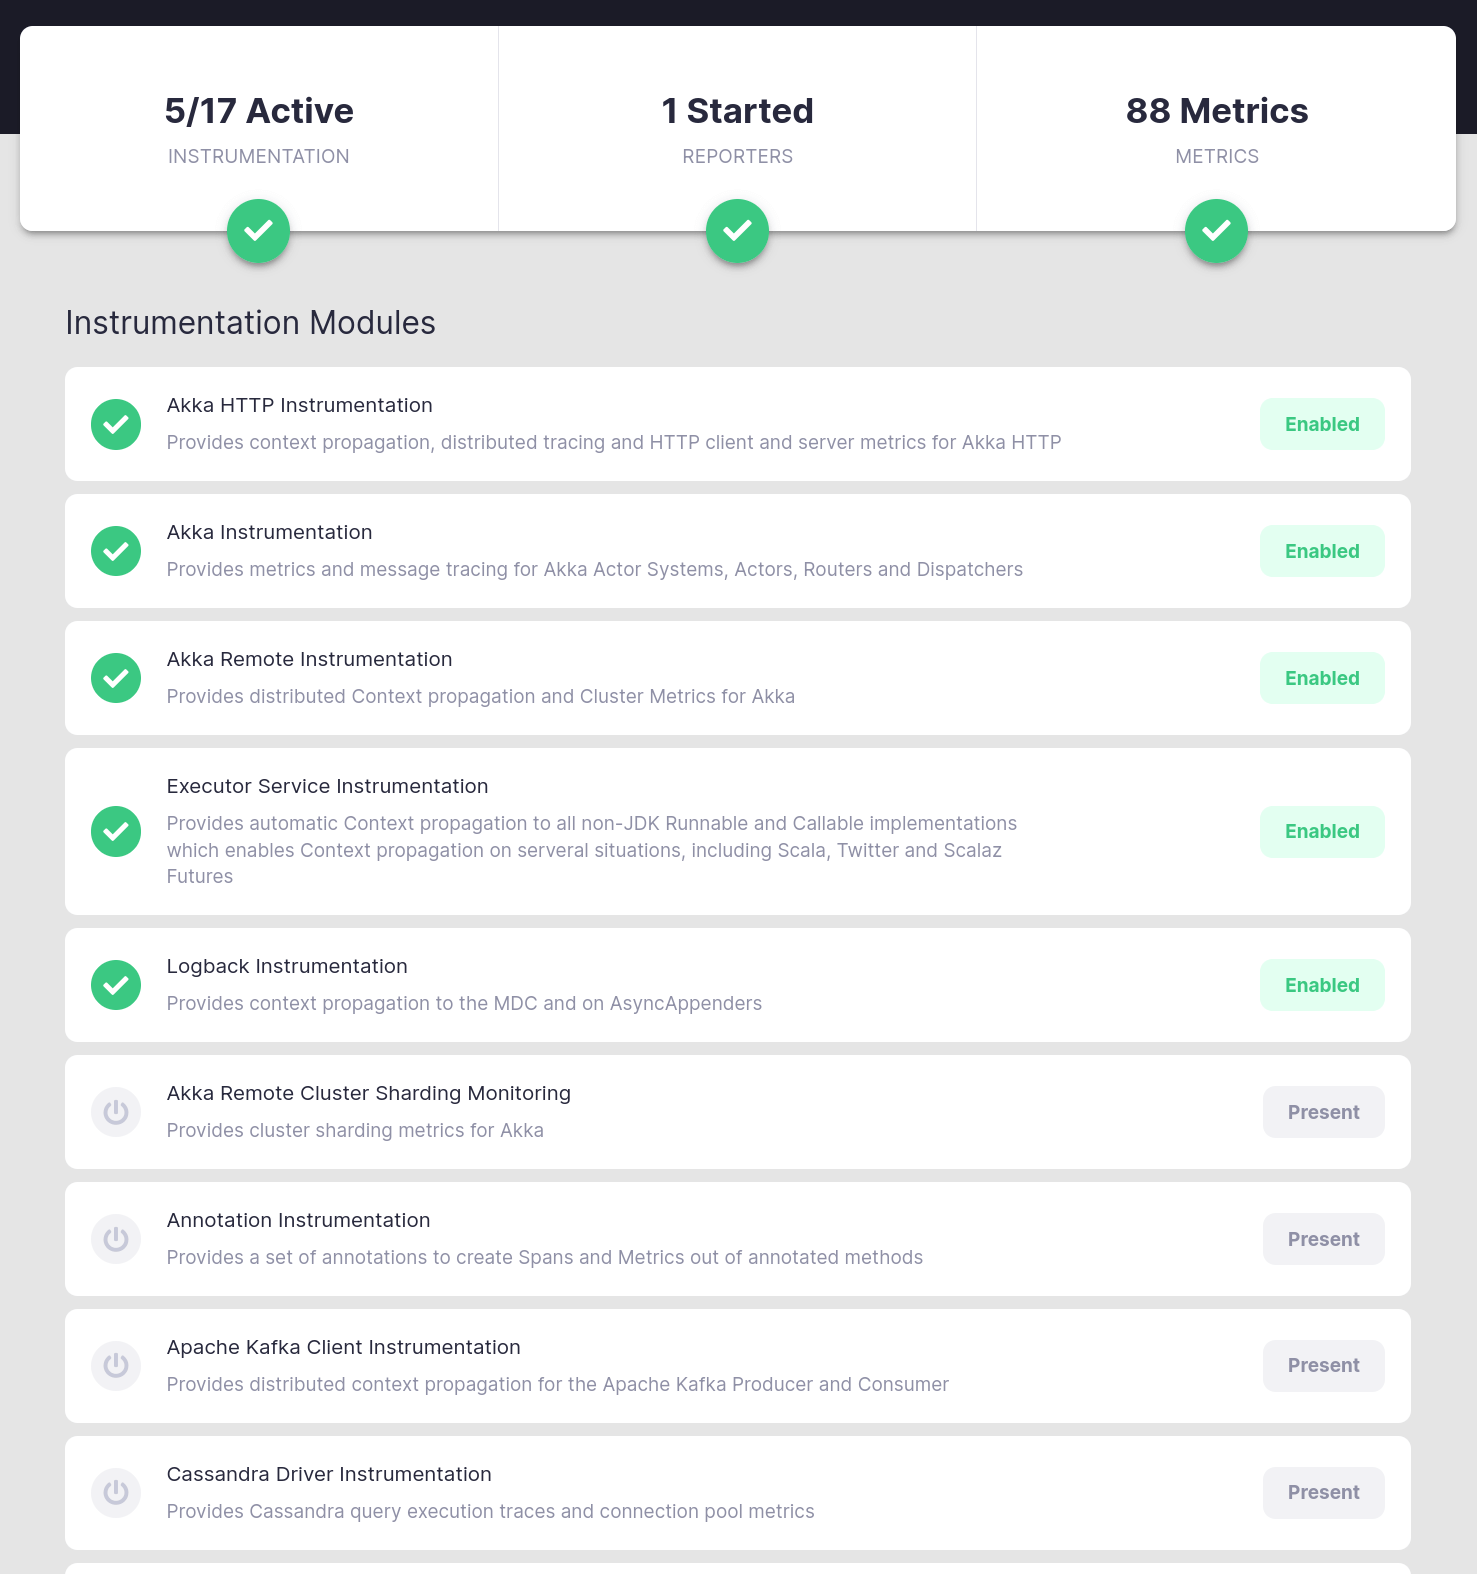
Get immediate insights into common libraries and frameworks
Understanding how certain frameworks work under the hood can be really challenging, but we already did that for you
Leverage automatic instrumentation to get started, and save your energy for enriching the default integrations
Kamon Telemetry has built-in support for Spring, Play Framework, Akka, and a lot more

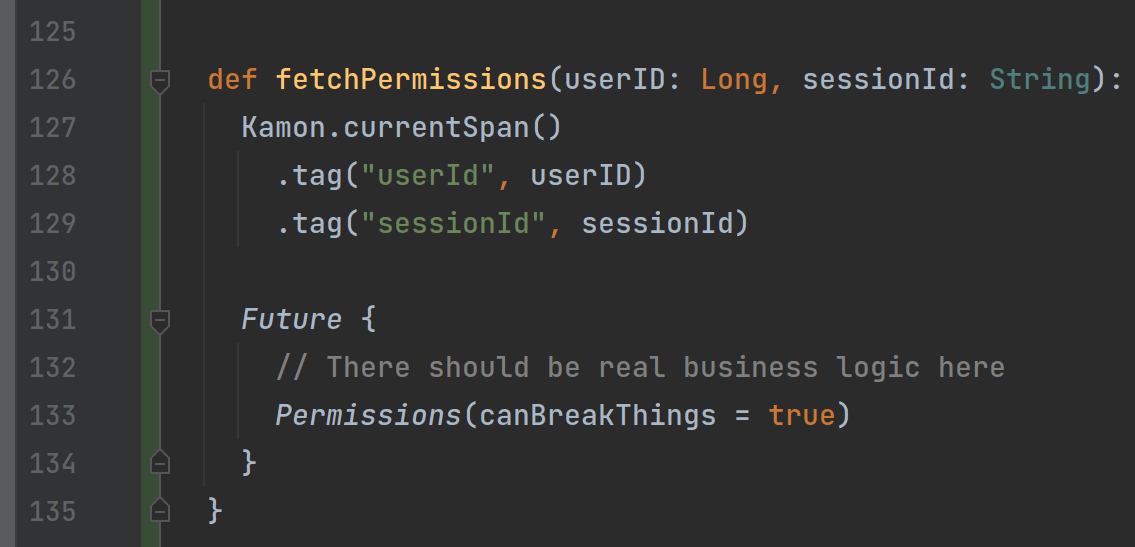
Add your own tags to automatic traces
Adding tags like appVersion, userId, or request-specific data can help you narrow down issues when investigating
Enrich the automatic instrumentation with your own tags and make it easier to troubleshoot issues later
Get full control over the instrumentation, if you want to
Want to do everything by hand? You got it
Kamon separates the core instrumentation libraries from the automatic instrumentation, so you can use the metrics and tracing APIs alone, and still be able to send data to any vendor
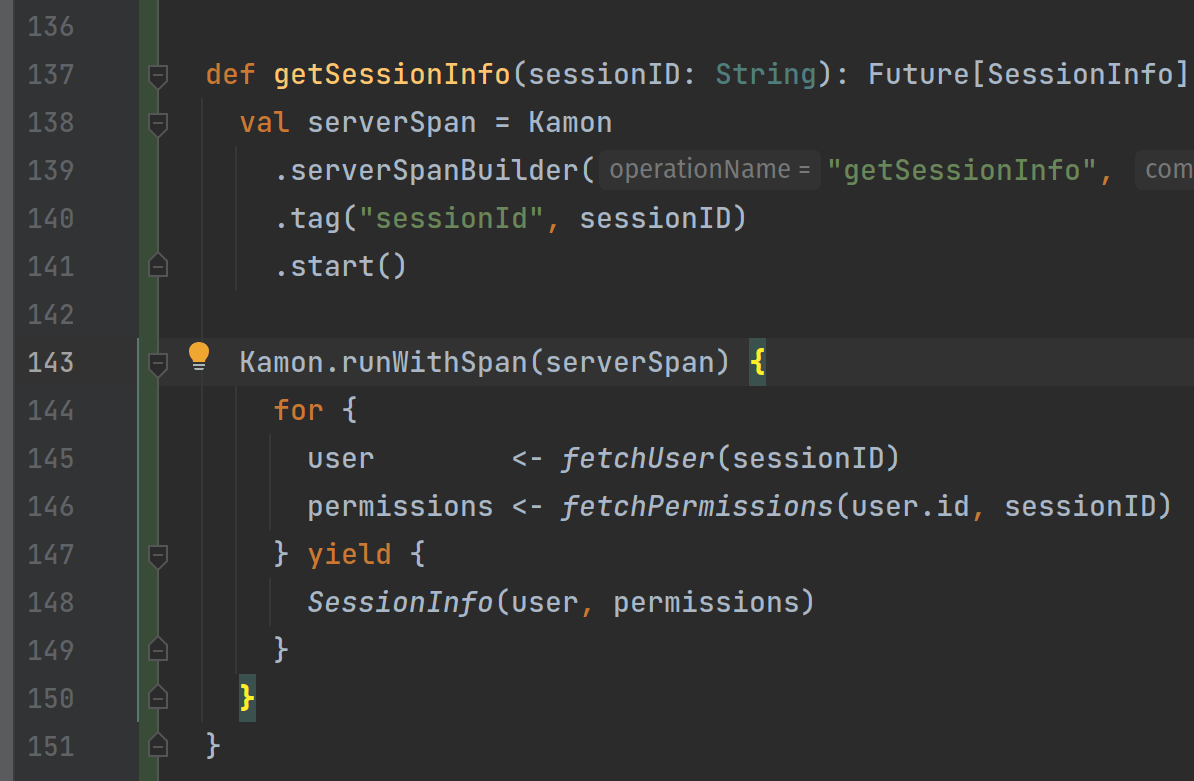
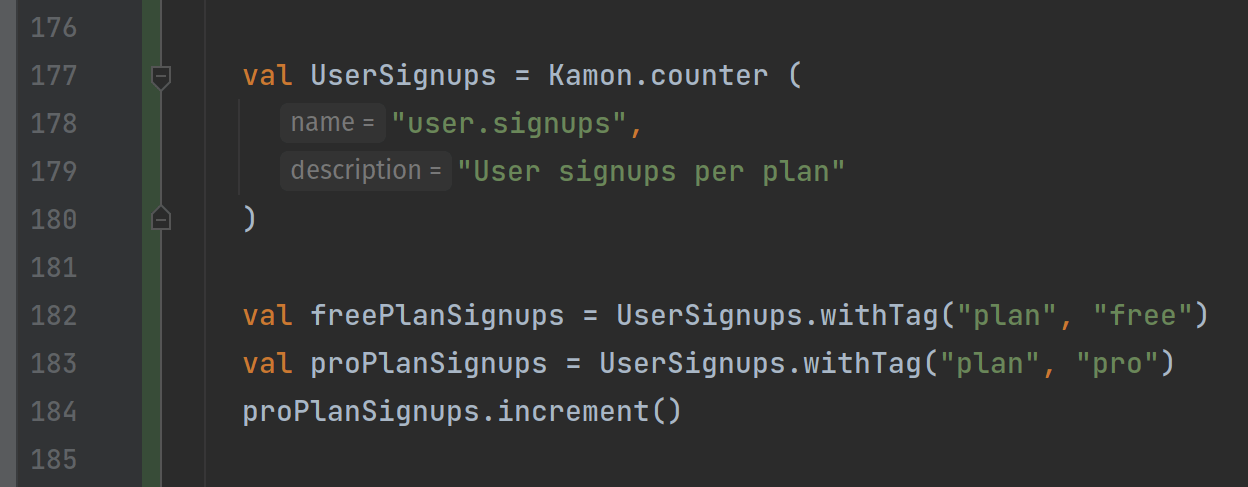
Measure the signals and metrics that matter to you
Getting latency and error metrics out of the box is nice, but what about the other things you care about?
Create your own metrics and track anything that is important to monitor your application’s health
Correlate requests across services and logs
When your logs are flooded with tons of requests, you need a consistent identifier to filter the logs and investigate a single request. Correlate requests with log statements, and across service calls automatically with Kamon
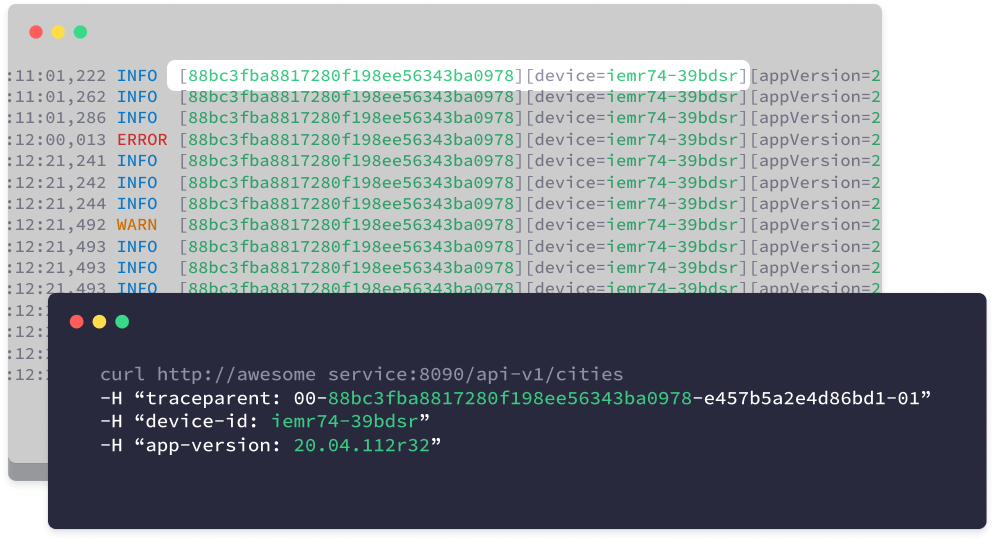
Propagate request-specific data across services
If you include tags like userId and requestId in your logs, you probably want those tags to propagate across services
Kamon propagates context tags automatically with its own propagation protocol, and is compatible with W3C Trace Context, B3, and Uber-trace-id
Correlated your logs with the right request
When you combine asynchronous actions and jump across threads, correlating requests becomes harder than usual
Ensure that log statements are connected to the right traceId and context, regardless of your threading model
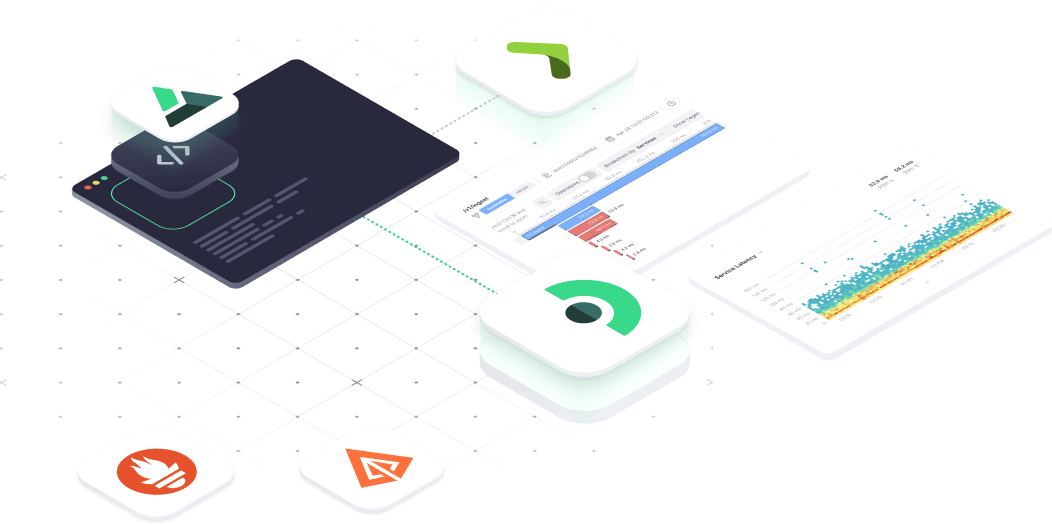
Visualize metrics and traces anywhere you want
Getting metrics and traces out of your services is only half the battle. You still need to send your telemetry data to a tool where you can visualize and analyze it
Use the platform designed for Kamon Telemetry
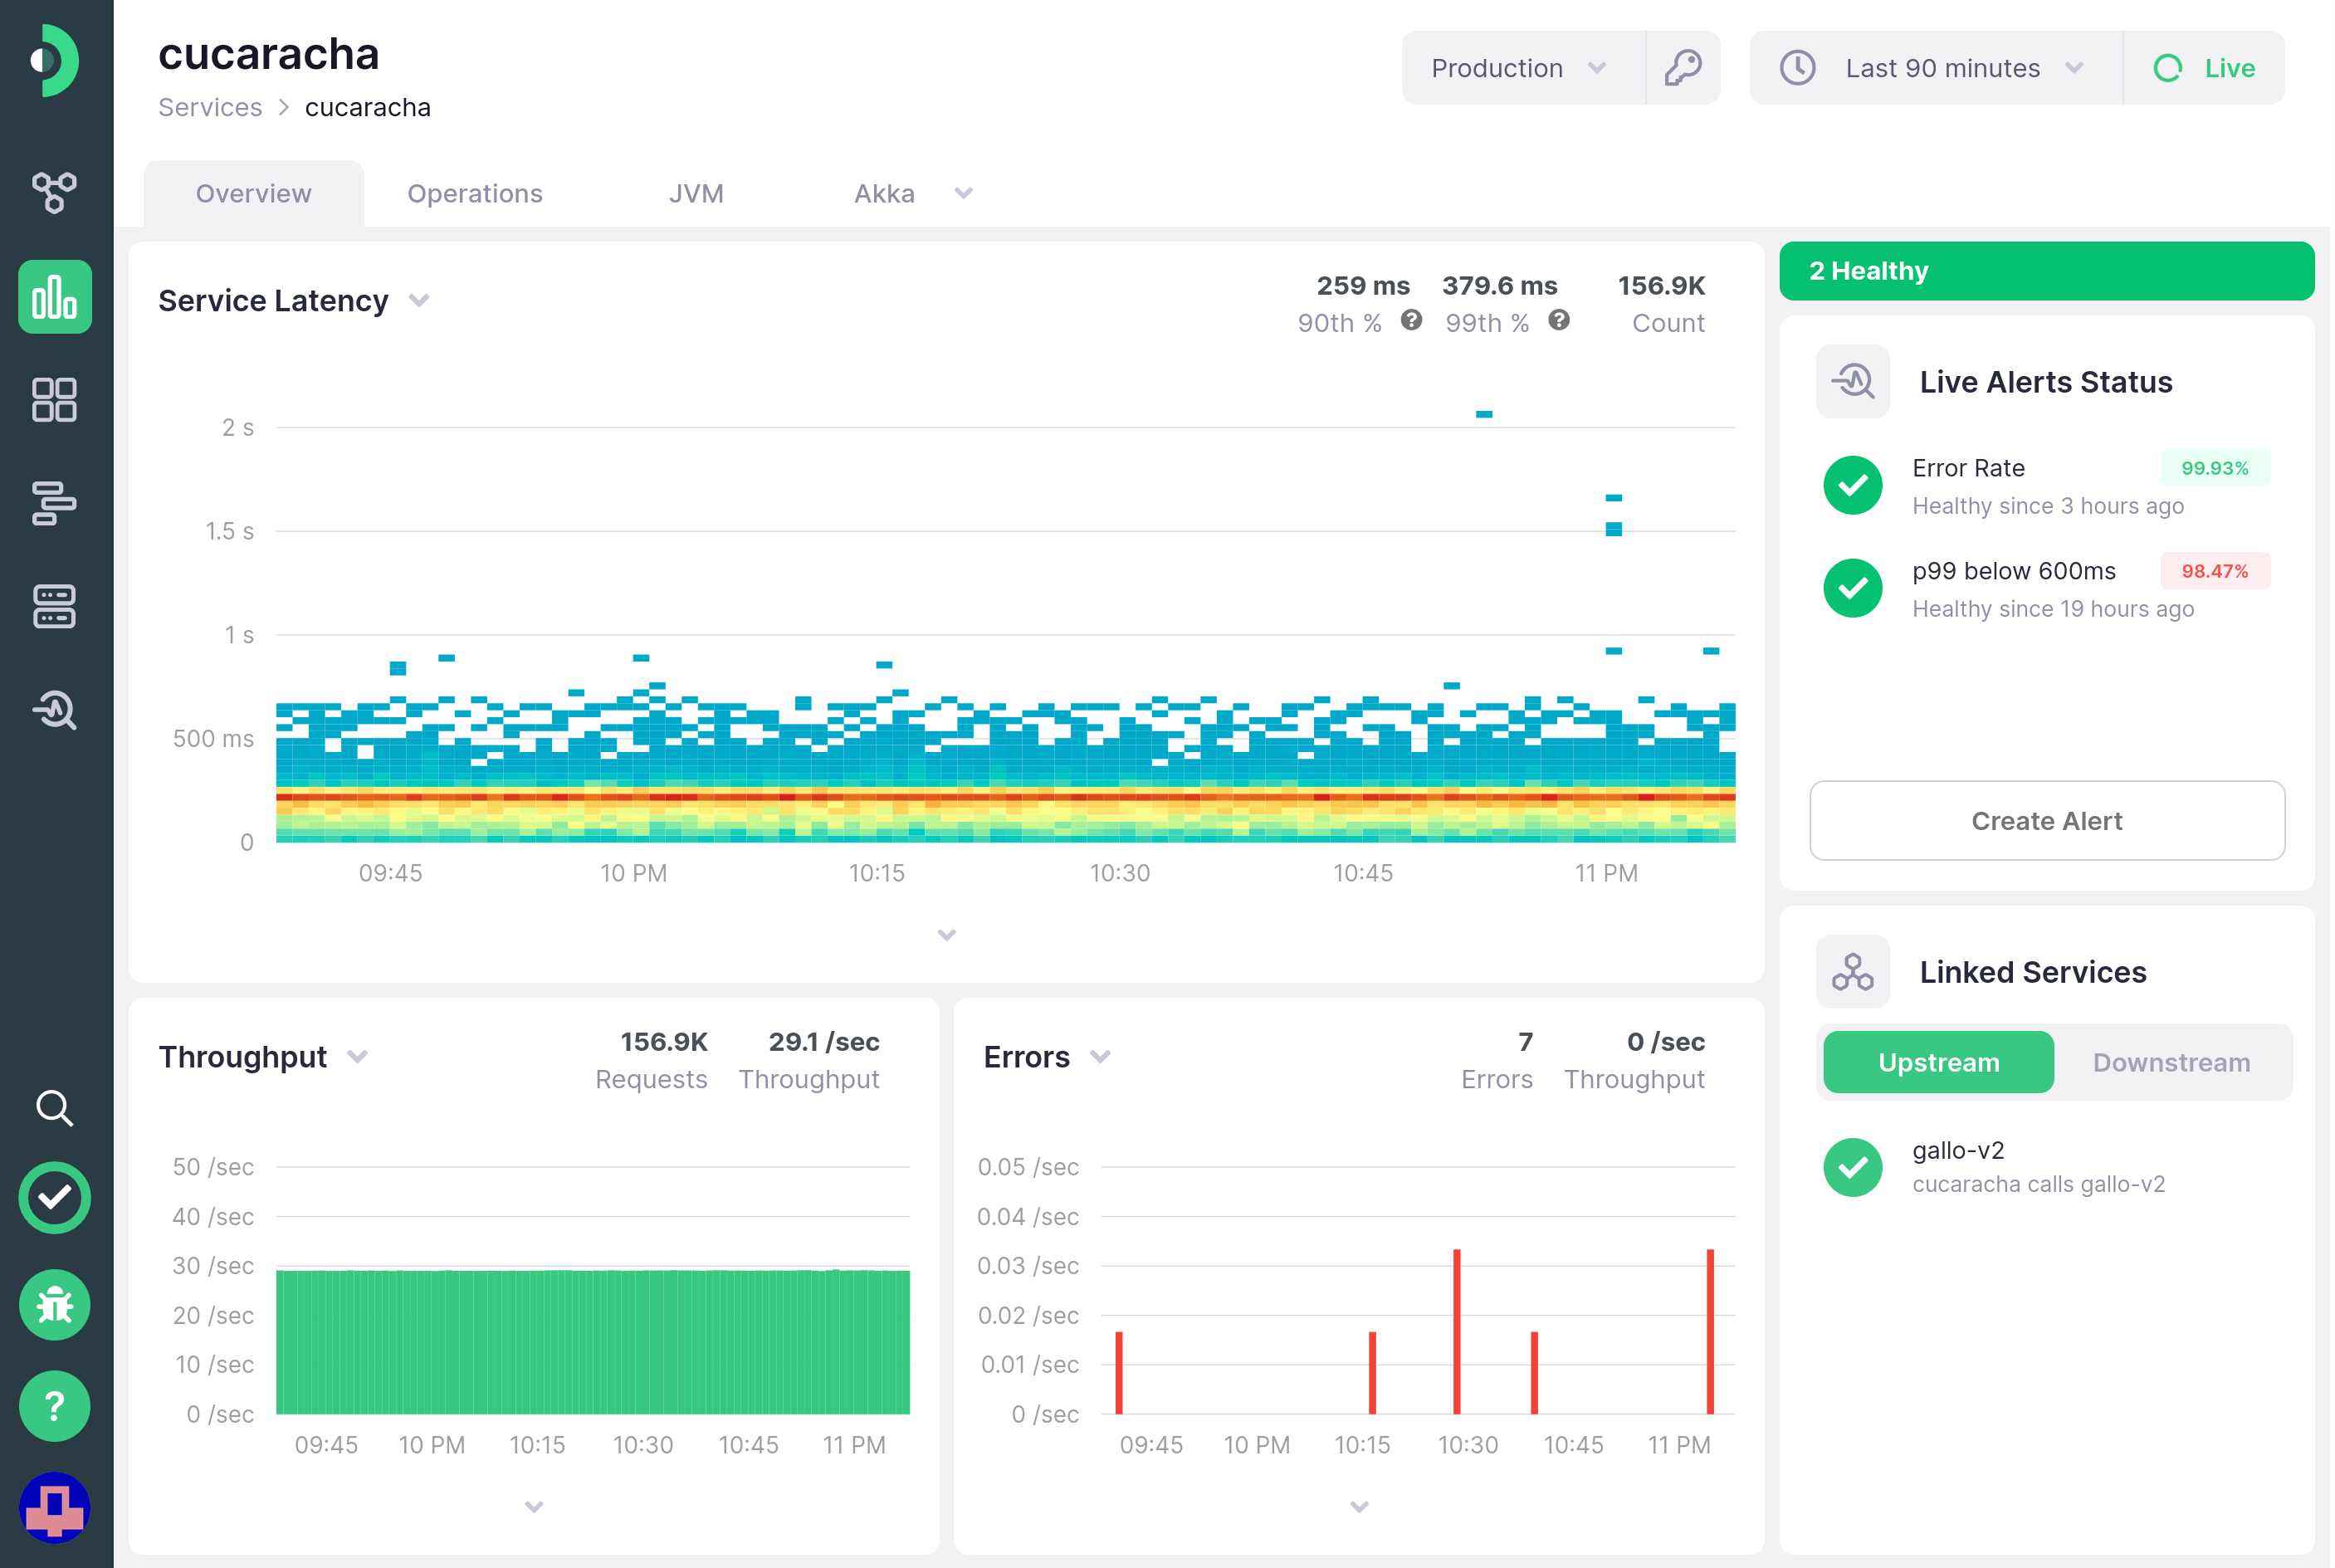
We created Kamon APM as the perfect tool to visualize the high-fidelity metrics generated with Kamon Telemetry
Don’t waste time setting up your own infrastructure and give Kamon APM a try. You'll thank us later
Use any vendor without changing instrumentation
All Kamon instrumentation is independent from the components that send data to external systems
You can send your data to Prometheus, Zipkin, OpenTelemetry-compatible endpoints, and more without changing the instrumentation