If you already had some experience with Kamon, you probably saw Kamon create Spans automatically for a lot of stuff, including HTTP server requests, database calls, actor messages, and more.
But what happens when you want to create Spans for methods or code blocks that Kamon doesn’t instrument automatically?
Let’s look at the two simplest ways to create Spans programmatically with Kamon:
Using the Kamon.span Function
Since Kamon 2.1.21 you can use the Kamon.span function to
wrap a code block and create a Span out of it:
import kamon.Kamon.span

span("myOperationName") {
  // Do your stuff here
}
The span function creates a new Span with the operation name you passed as argument, and additionally it will:
- Store the Span in the current
Contextwhile the wrapped code block executes. This ensures that other Spans you create later on will be connected to the same trace as the current Span. - Fail the Span with any exception thrown by the wrapped code block.
- Finish the Span when the wrapped code block finishes executing. With a little twist: if the wrapped code block
returns a Scala
Futureor aCompletionStage, then the Span will be finished when the asynchronous computation finishes.
Using the @Trace Annotation
If you are into annotations, you are going to like @Trace.
import kamon.annotation.api.Trace

@Trace
def fetch(...): Future[] = {
  // Do your stuff here
}
The @Trace annotation takes care of creating the new Span, storing it in the current Context, failing it if the
method throws an exception, and finishing it when it returns. If you don’t provide any operation name to @Trace then
Kamon will generate one using the class and method names.
And, if the annotated method returns a Scala Future or a CompletionStage, then the created Span will be
finished when the asynchronous computation finishes, just like with the span function from above.
Configuring Annotation Scanning
There is one configuration requirement for using the @Trace annotation: you must tell Kamon which packages to scan for
annotated methods. Include the lines below in your application.conf file, pointing to the packages you want Kamon to
scan and you are good to go:
kanela.modules.annotation {
  within += "my.company.*"
}
See it in Action
Let’s try out these options with a short, but real example.
Imagine you are working on a service that handles user sessions. To get a session’s info the service needs to send requests to two other services: one to get the user details, and another to get the user permissions.
The business logic might look similar to this:
/**
  * This is what gets called from our HTTP handler, and
  * delegates part of the business logic to other helper
  * methods like `fetchUser` and `fetchPermissions`.
  */
def getSessionInfo(sessionID: String): Future[SessionInfo] = {
  for {
    user        <- fetchUser(sessionID)
    permissions <- fetchPermissions(user.id)
  } yield {
    SessionInfo(user, permissions)
  }
}


def fetchUser(sessionID: String): Future[User] =
  Future {
    // There should be a HTTP / Database call here
    User(1, "@kamonteam")
  }


def fetchPermissions(userID: Long): Future[Permissions] =
  Future {
    // There should be a HTTP / Database call here
    Permissions(canBreakThings = true)
  }
The getSessionInfo method is called from the HTTP Server logic, then it calls fetchUser and fetchPermissions.
The actual business logic doesn’t matter a lot. What really matters is the use case: a piece of business logic that requires responses from two other services to process a request.
Creating a Span for the Main Logic
At first, we want to figure out how long does it takes to execute the entire getSessionInfo logic. We can go ahead and
wrap the getSessionInfo method with a span:
/**
* This is what gets called from our HTTP handler, and
* delegates part of the business logic to other helper
* methods like `fetchUser` and `fetchPermissions`.
*/
def getSessionInfo(sessionID: String): Future[SessionInfo] = {
span("getSessionInfo") { // <- This creates the Span
for {
user <- fetchUser(sessionID)
permissions <- fetchPermissions(user.id)
} yield {
SessionInfo(user, permissions)
}
}
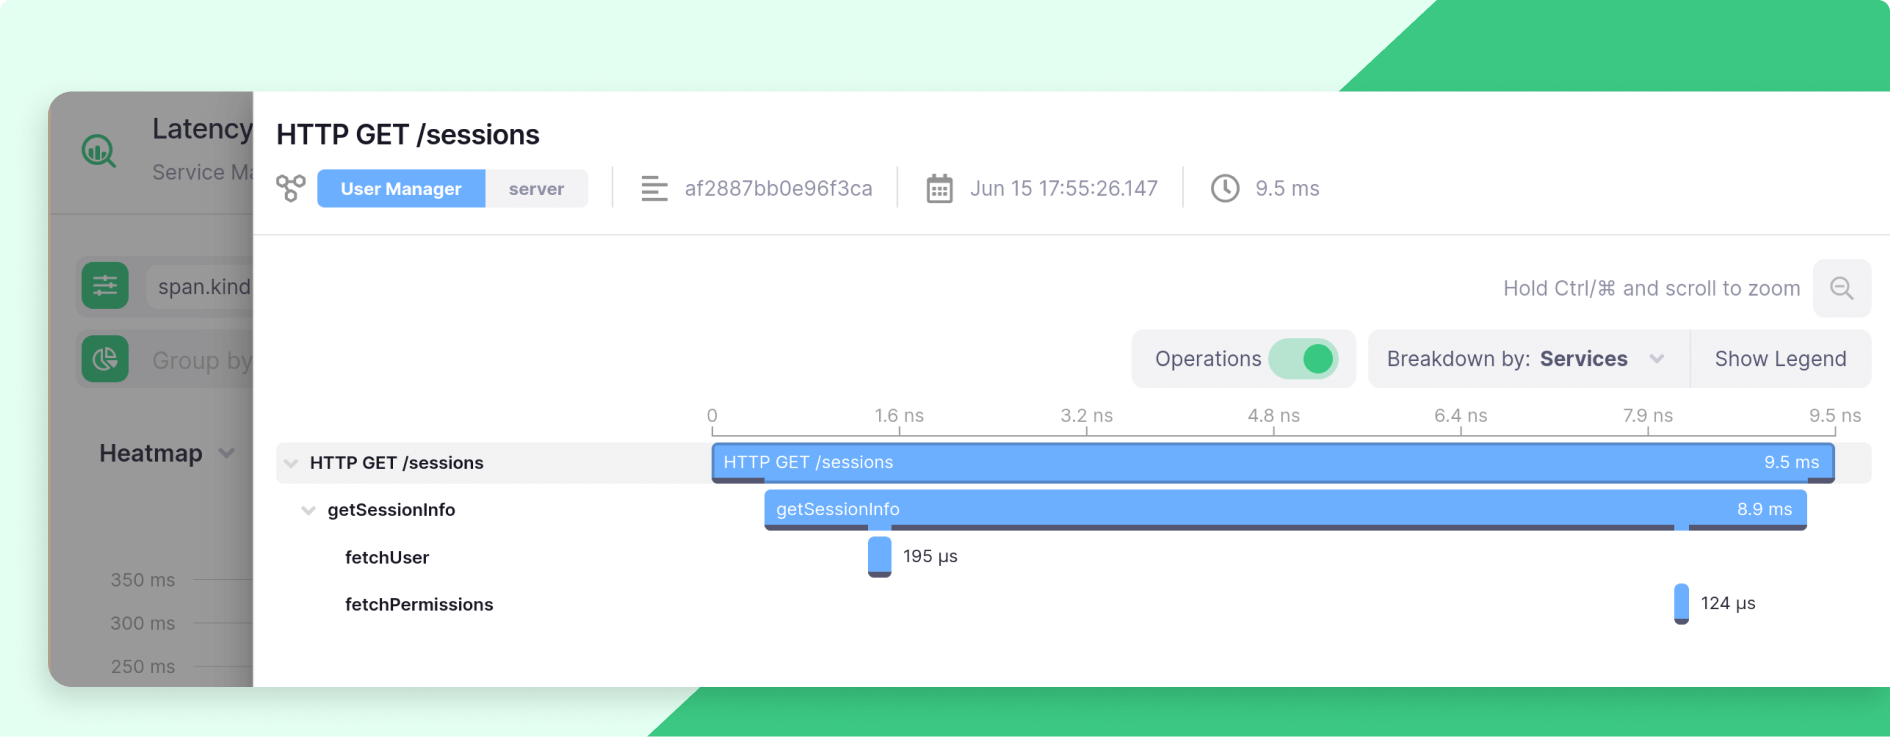
}We put the example code from above behind a /sessions endpoint in a tiny Akka HTTP application, just so that we can
send requests and visualize the full trace:
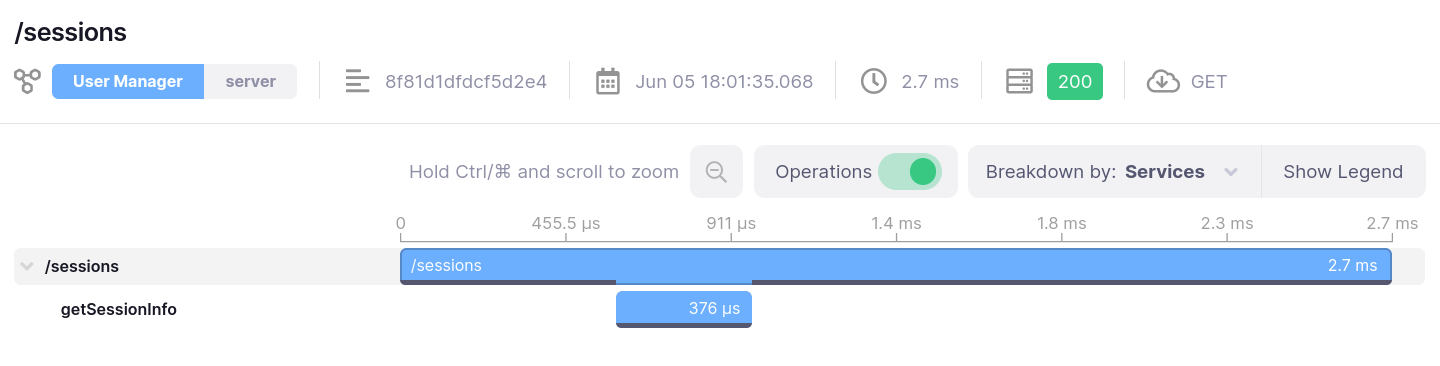
There are two Spans in this trace:
- The
/sessionsSpan, created automatically by Kamon’s Akka HTTP instrumentation. - the
getSessionInfoSpan, created with our little code from above.
Not only did we create a custom Span with a single line of code, we got that Span to join the same trace that Kamon had already running with the automatic instrumentation!
Creating Spans for Additional Logic
For debugging purposes, it would be interesting to add another level of detail to this trace: tracking how long it takes
for fetchUser and fetchPermissions to complete.
Let’s make two changes to the example code:
- Add the
@Traceannotation to thefetchUsermethod. - Wrap the body of
fetchPermissionswith aspanblock, same as we did getgetSessionInfobefore.
The updated code should look like this:
@Trace(operationName = "fetchUser")
def fetchUser(sessionID: String): Future[User] =
Future {
// There should be a HTTP / Database call here
User(1, "@kamonteam")
}
def fetchPermissions(userID: Long): Future[Permissions] =
span("permissions) {
Future {
// There should be a HTTP / Database call here
Permissions(canBreakThings = true)
}
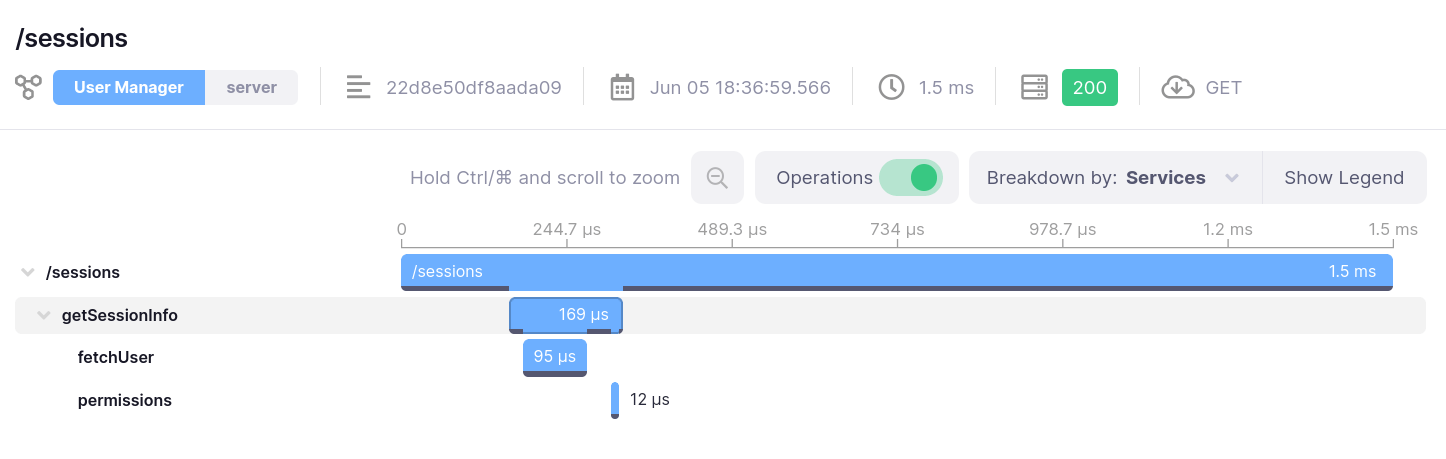
}And there they are, two new Spans for these two methods:
Adding Tags to Spans
You can always access the Spans created with the span function or the @Trace annotation by calling
Kamon.currentSpan in the wrapped code block. For example, if you wanted to add the session id as a tag to the
fetchUser Span, you can write something like this:
import kamon.Kamon.currentSpan
@Trace(operationName = "fetchUser")
def fetchUser(sessionID: String): Future[User] =
Future {
// Adding a tag to the current Span
currentSpan().tag("sessionID", sessionID)
// There should be a HTTP / Database call here
User(1, "@kamonteam")
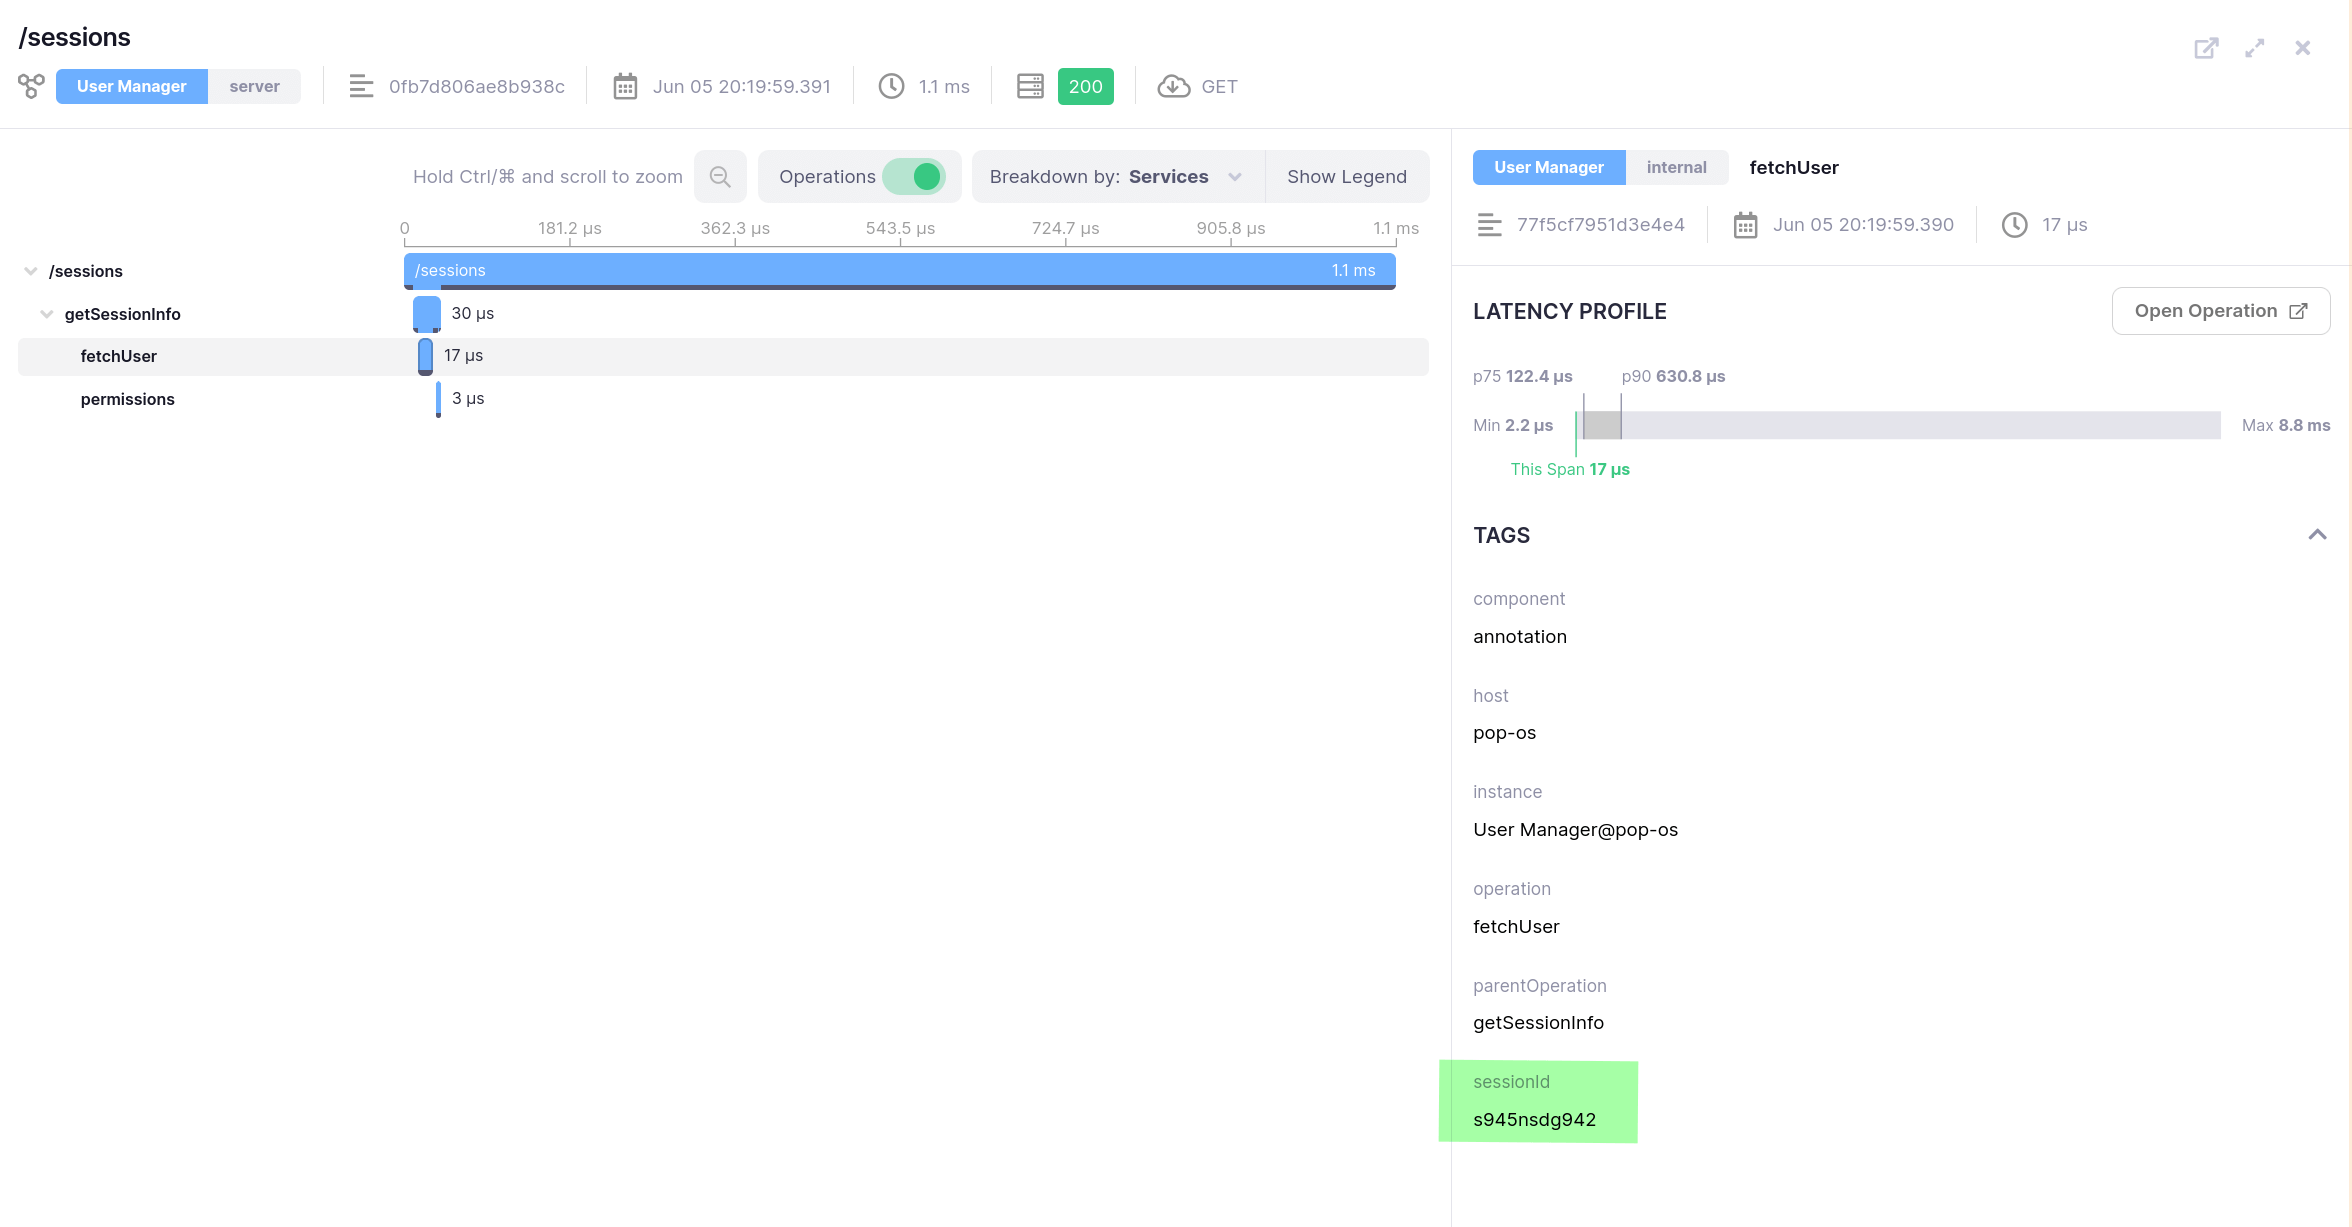
}And sure enough, the new tag is going to show up in your traces (see the gree highlight at the bottom-right):
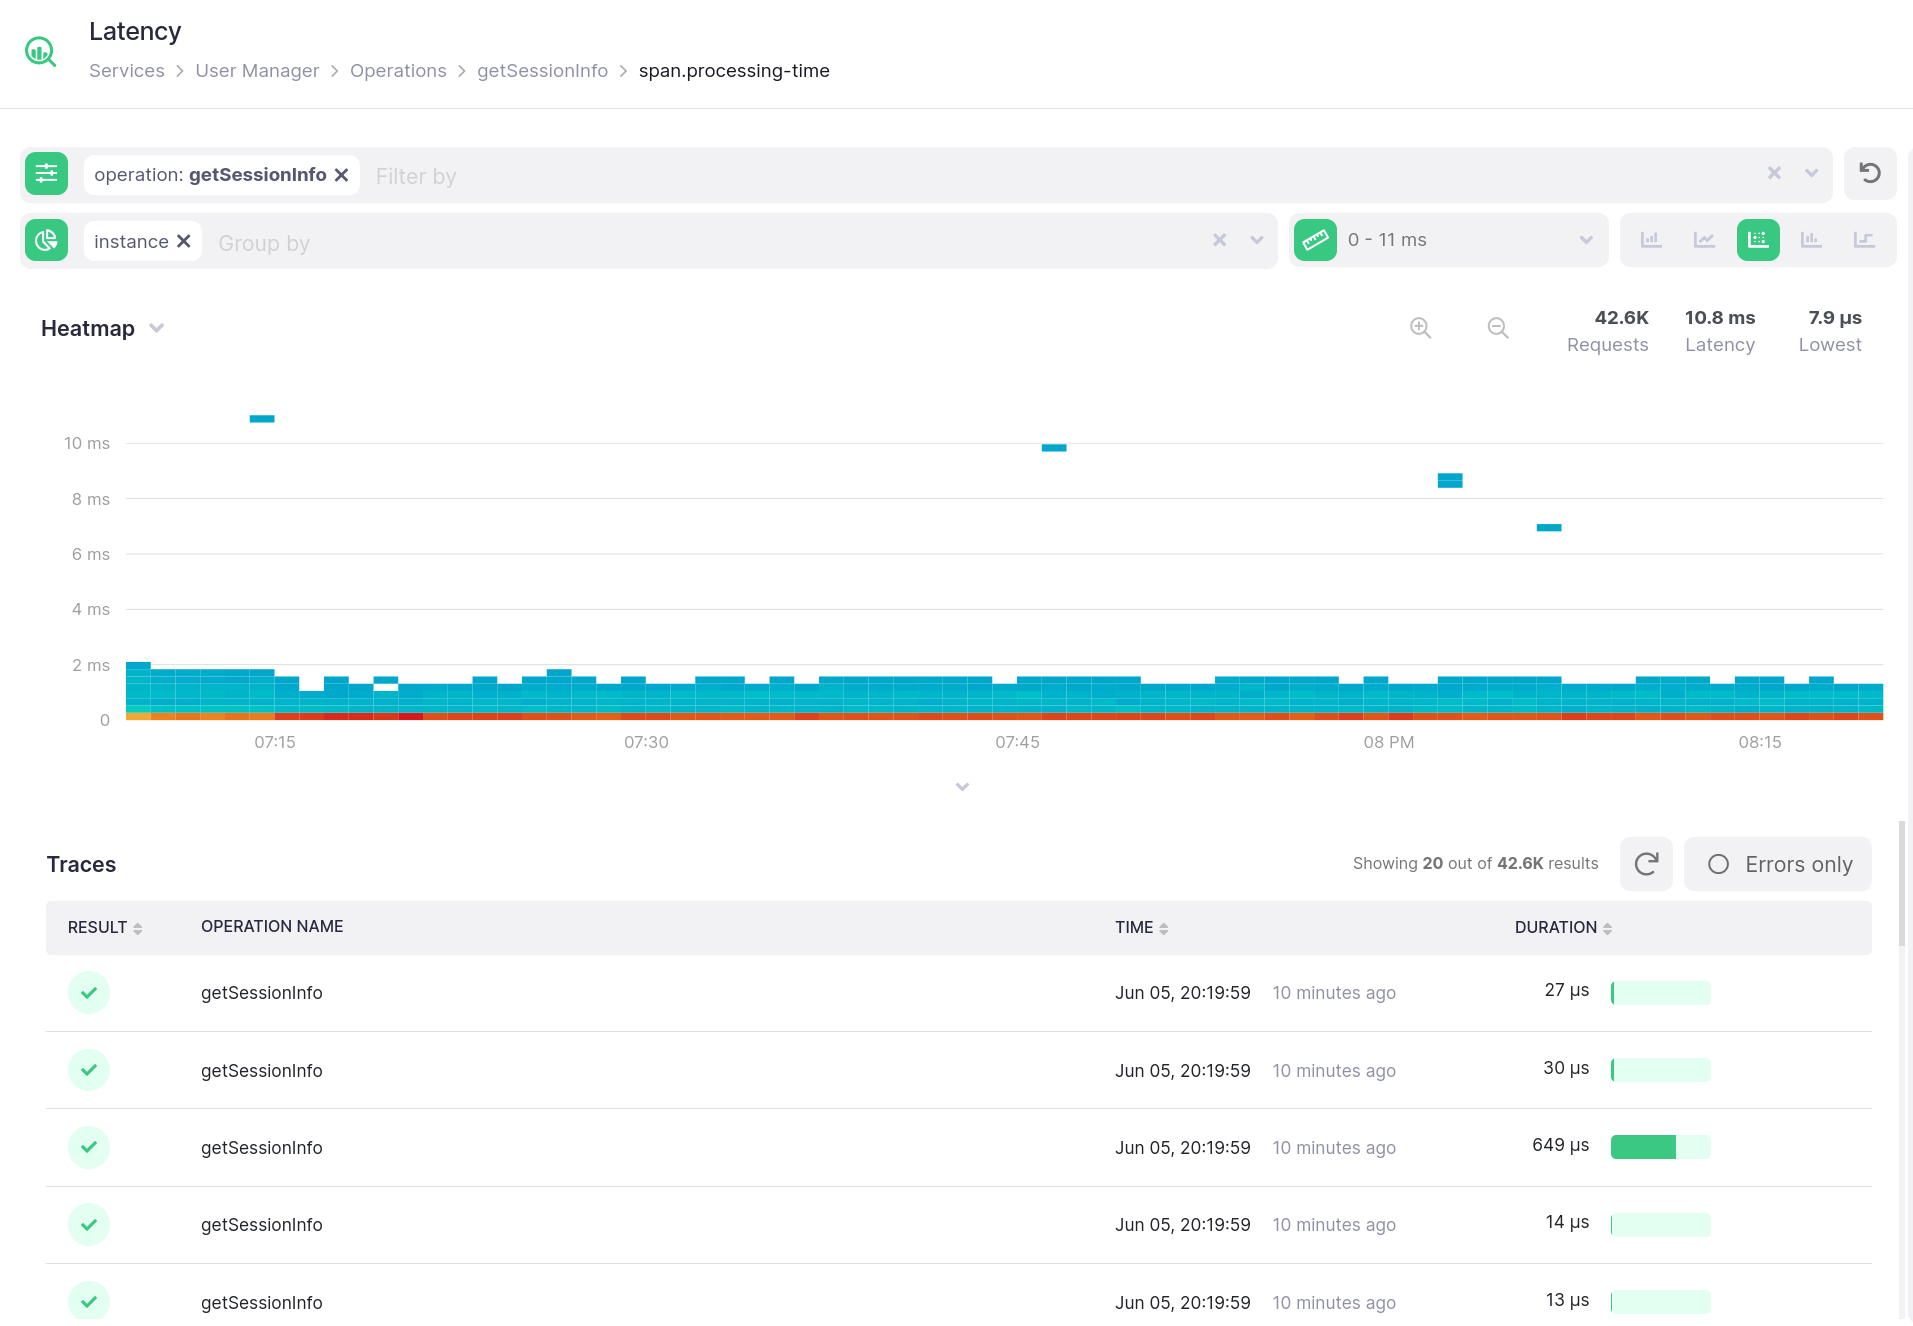
Bonus: Latency Metrics for Spans
Kamon does a little bit more under the hood than just creating the Spans. By default, Kamon records the latency for all
finished Spans in the span.processing-time metric, so that you don’t need to repeat instrumentation for metrics and
traces.
The span.processing-time metric will always have at least these tags:
-
operationwith the operation name you assigned when creating the Span. -
errorwith either true or false, depending on whether the Span finished successfully or not. - Any tags you added programmatically by calling
currentSpan().tagMetric(...).
To summarize, the few lines of code we added on this post brought us more detailed traces, and metrics for our custom Spans.
And there is more! Even though some Spans will be dropped because of trace sampling, Kamon will always record the Span’s
duration on the span.processing-time metric, so you will always get accurate latency histograms from all your Spans!
By the way, we are working on a piece about how trace sampling works in Kamon. Stay tuned for more!
Ready to Create your own Spans?
The two methods we described on this post are part of Kamon Telemetry, and you can use them regardless of what tool you use to visualize and analyze your traces. So, if you haven’t done it already, jump to the installation guides and Start Monitoring with Kamon right away.
If you don’t have a home for your Spans yet, then check out Kamon APM! You can get a fully managed solution to visualize your Spans, along with metrics, alerts, and a bunch more, starting Free! Sign Up for Kamon APM and see for yourself.