Observability in Practice
After years of helping developers monitor and debug their production systems, we couldn’t help but notice a pattern across many of them: they roughly know that metrics and traces should help them get the answers they need, but they are unfamiliar with how metrics and traces work, and how they fit into the bigger observability world.
This post is an introduction to how we see observability in practice, and a loose roadmap for exploring observability concepts in the posts to come. We are not going to dive deep into any specifics here, but rather give you an overview of the landscape so that you are not lost the next time people are talking about observability.
Welcome aboard and we hope you enjoy it!
A Word on Prior Works
Before we go anywhere, it seems logical to start with a definition of observability. We found a lot of content out there trying to define what observability is (and what it isn’t). Throughout our reading, we noticed a few topics coming up over and over again:
- Wikipedia’s definition of observability and its origin in control theory
- The three pillars of observability: logs, metrics, and traces
- The “unknown unknowns”
- Comparisons of observability vs monitoring (spoiler: monitoring loses. Every. Single. Time.)
It is mostly interesting and useful content (often covered with “we are observability too” fluff, of course). Still, seeing the way some articles are comparing observability versus monitoring triggered us a little bit.
It feels like observability is being portrayed as a new shiny kind of tool that came to replace monitoring, almost as if monitoring was a bad thing of the past that we need to get rid of.
We couldn’t disagree more. In fact, we see monitoring as one of the three jobs to be done by any observability platform!
Now, this is not the time and place to rant (even more) about the difference in opinions and definitions (you can hit me up via @ivantopo for that :D). For now, let’s avoid coming up with yet another definition of observability and show you how observability looks like in practice. Later on, you can pick whatever definition makes sense for you.
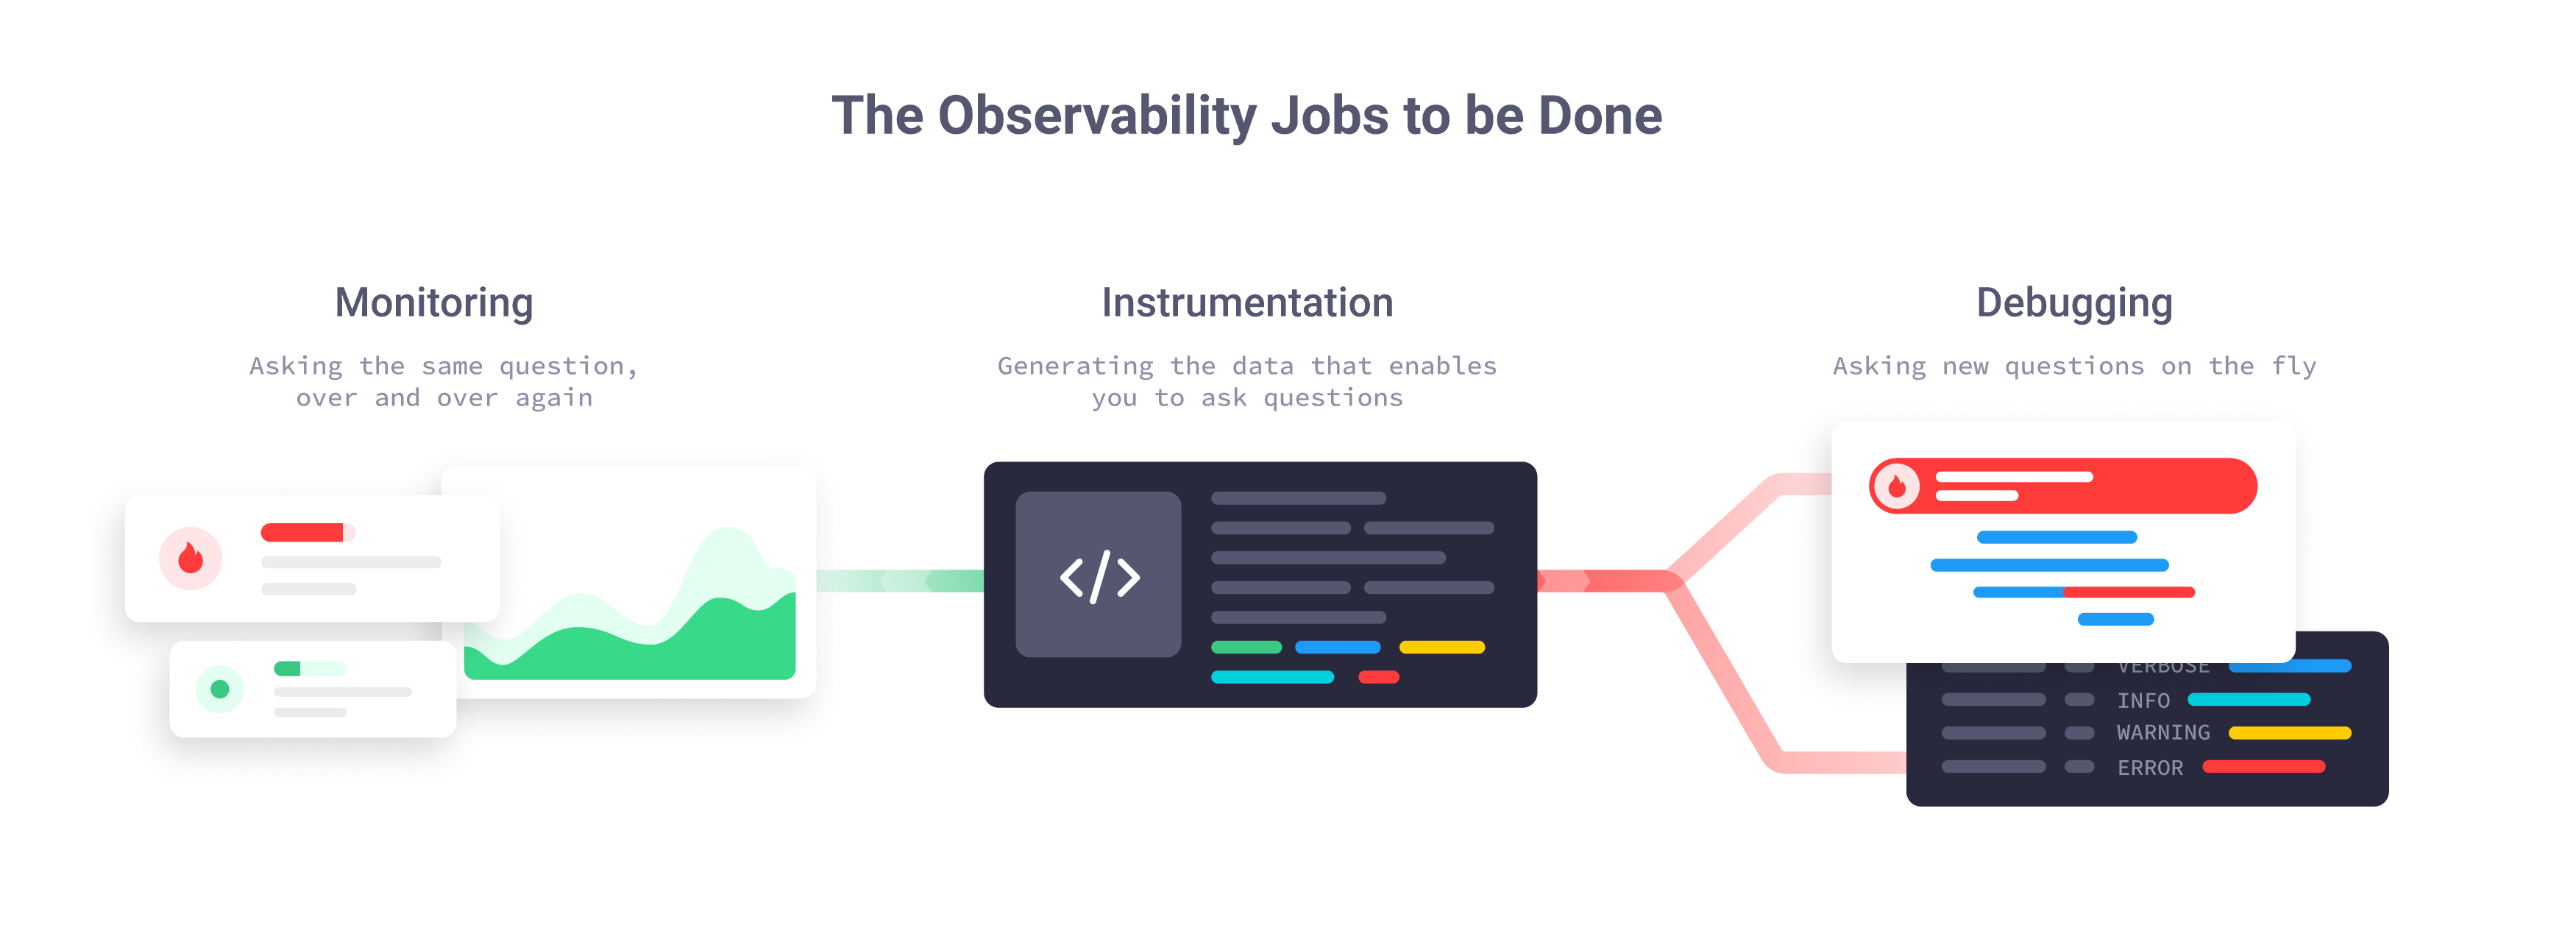
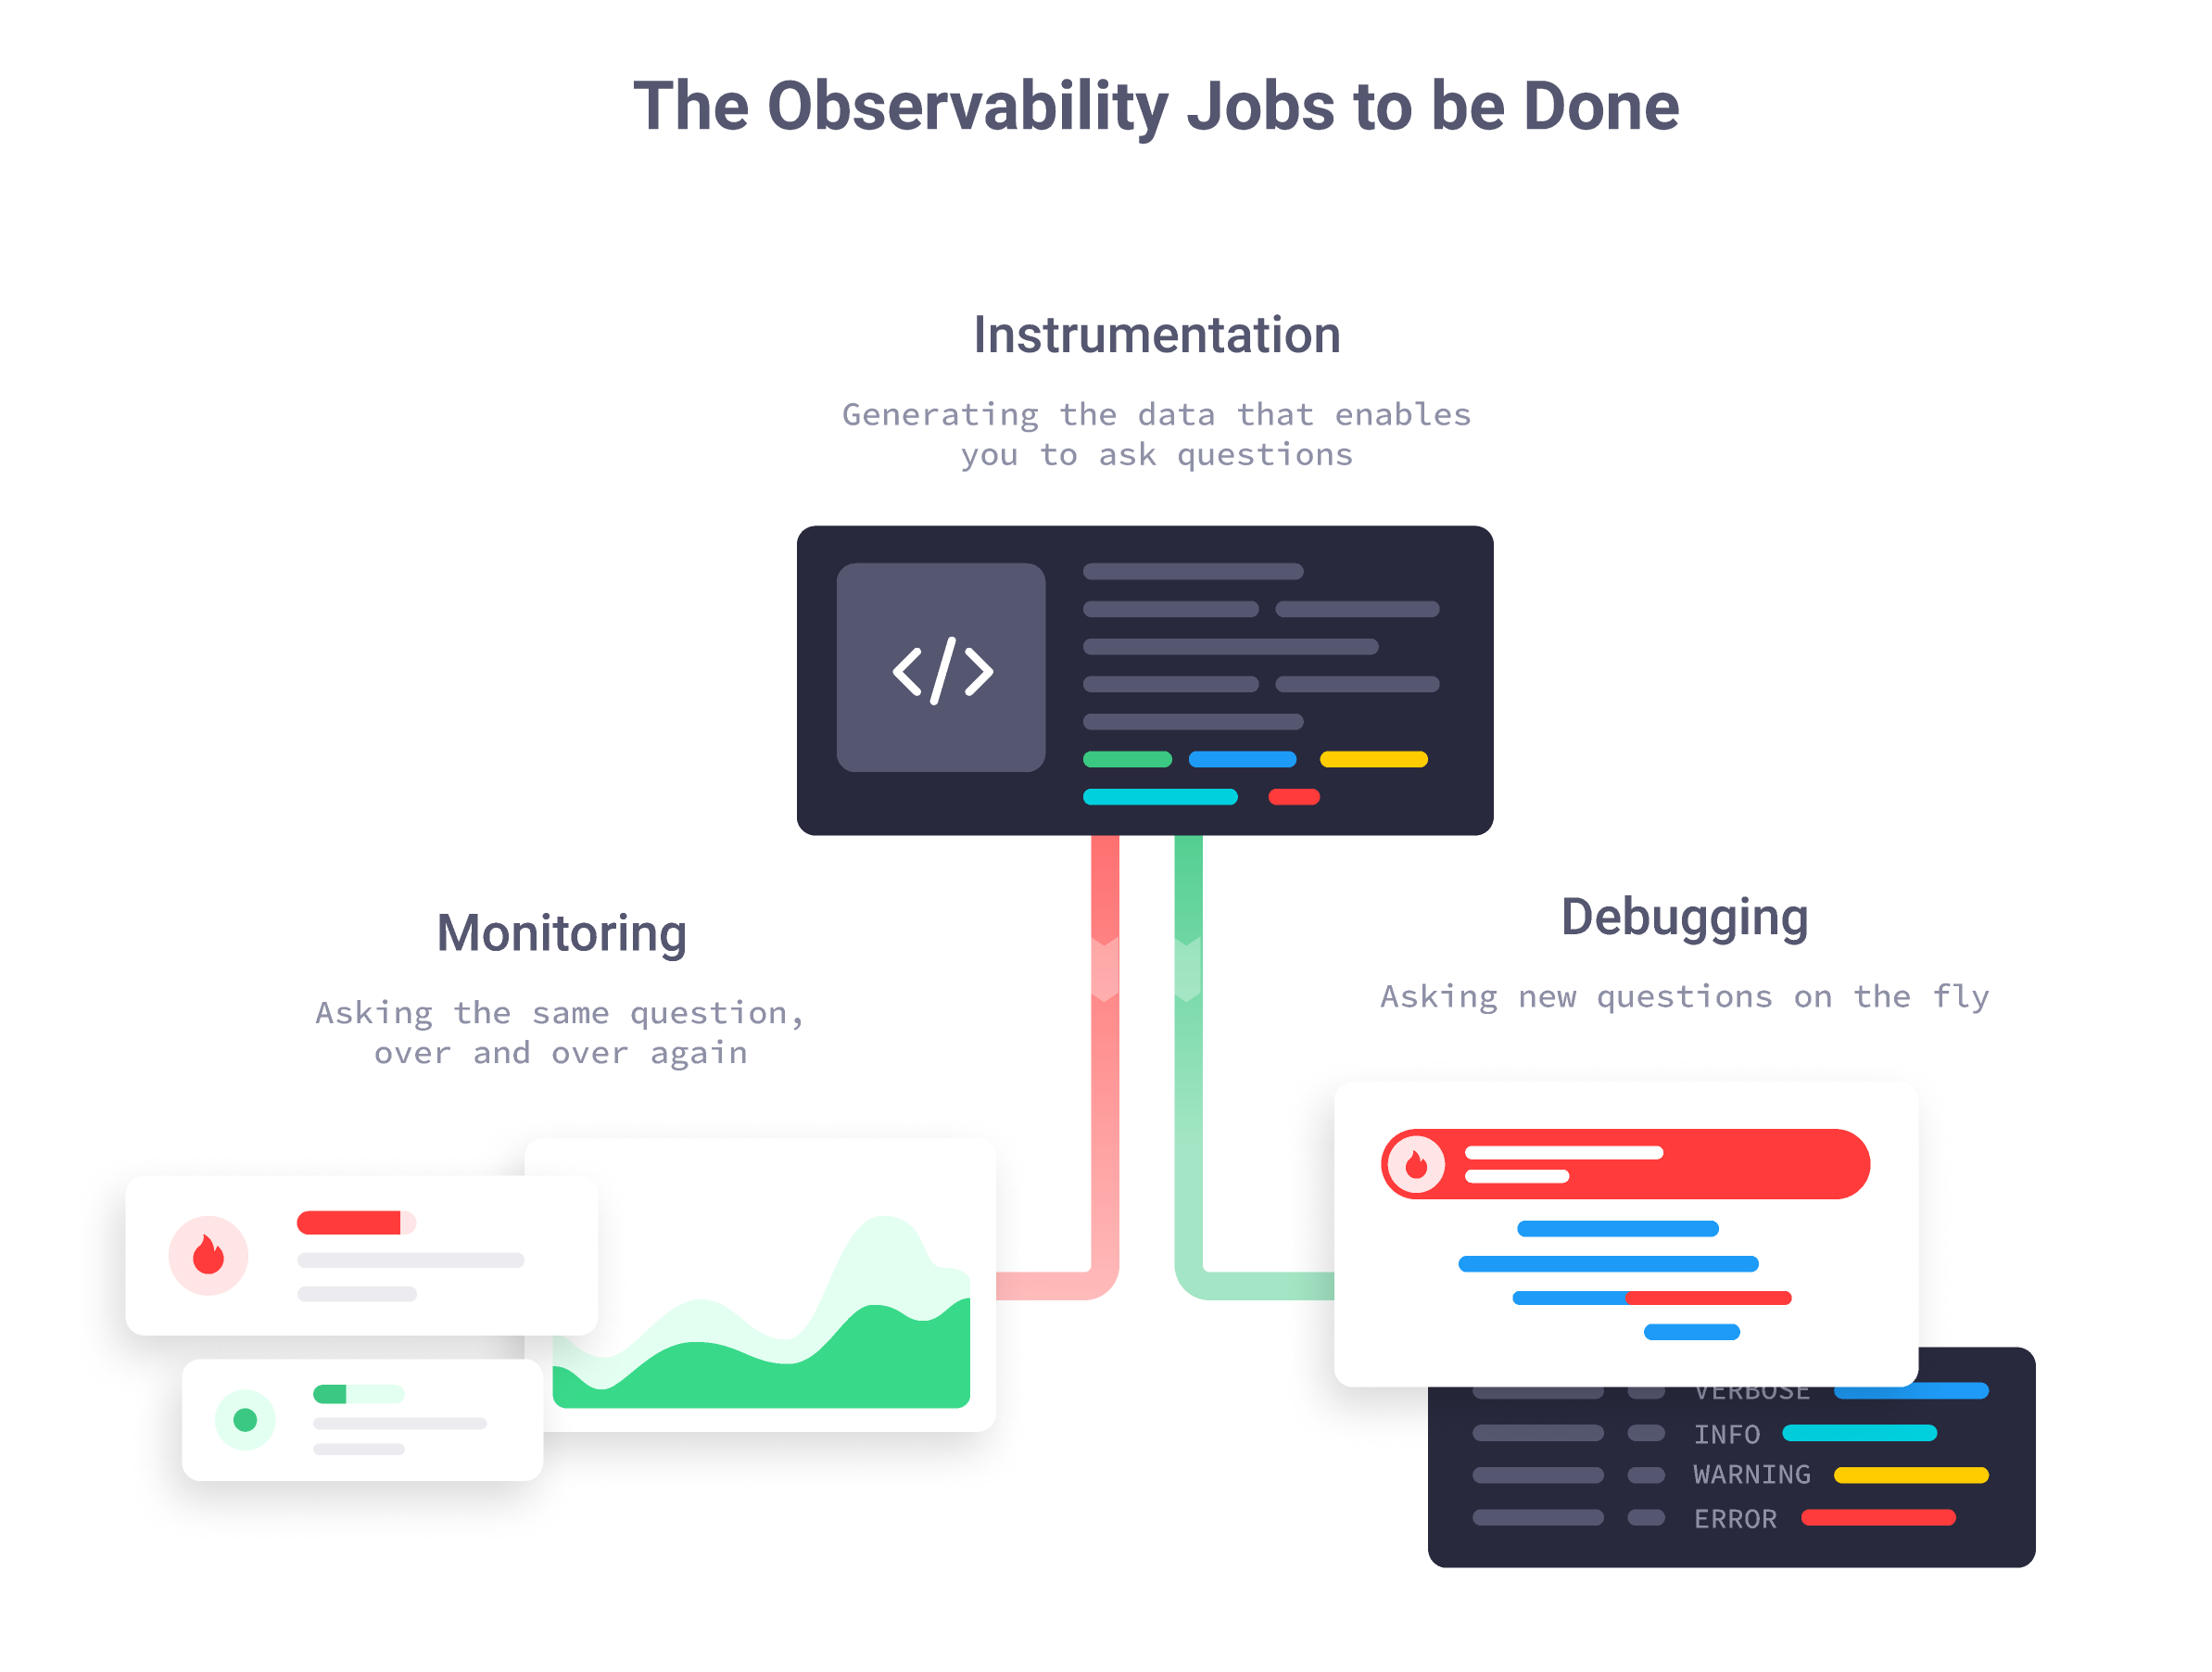
The Observability Jobs to be Done
When talking about real world systems running in production, there are three jobs that any observability platform must help you get done:
- Confirm that your systems are running as expected (monitoring)
- Find the cause of undesired behavior (debugging)
- Gather the data that allows you to do monitoring and debugging in the first place (instrumentation)
In our world view, anything that helps you instrument, monitor, and debug production systems falls under the umbrella of observability. Starting with log lines that tell whether a request succeeded or failed, and all the way up to distributed traces and AI-powered insights. If it helps you understand your systems’ state and behavior, it is part of our observability world.
Let’s unpack these three jobs with a quick example:
Imagine a system where the only definition of “good” behavior is that all requests are processed in less than one second. How do instrumentation, monitoring, and debugging look like in that system?
Let’s start with the simplest part: monitoring. To monitor this system, you need to ask the same question over and over again: did any request take longer than one second? Whenever you get a yes, you switch into “debugging mode” and try to figure out why.
Debugging on the other hand, is about asking new questions that help you figure out why those requests took longer than a second, so you can go and fix them.
Sometimes the answers to your monitoring questions point right at the source of problems, and you kind of kill two birds with one shot. Some other times you need to get very creative to come up with hypotheses of what is wrong, and craft the specific questions that can prove those hypotheses right or wrong.
Finally, there is instrumentation. Instrumentation is about generating the data you will use for asking monitoring and debugging questions. Interestingly enough, the type of data you generate, and level of detail you include on it depends on the purpose you have in mind.
Instrumentation for monitoring tends to be very straight forward, mostly because you already know the questions you need to ask. In this example, having a metric that counts how many requests took longer than a second is enough to answer our monitoring questions. Sounds simplistic, but it is actually enough.
Instrumentation for debugging is a different story. You have no idea of what kind of questions you will need to ask until you get to the point where you need to ask them. That means, you will end up saving as much information as you can, just in case it will be useful later on for debugging. This includes saving things like who sent the request, how many times did you go to the database to serve the request, how long it took each time, and so on. You never know when it will be useful.
By now, you may realize that the common theme underneath instrumentation, monitoring, and debugging is enabling you to ask questions about your systems’ state and behavior. The better your instrumentation, the better monitoring and debugging questions you will be able to ask, and, as a consequence, the easier it will be for you to investigate whatever happens in your production systems.
Let’s go back to the real world and explore how applications get instrumented, monitored, and debugged in practice.
Instrumenting Applications
Instrumentation is mostly going to be about generating logs, metrics, and traces that describe your application’s state and behavior. We usually refer to logs, metrics, and traces together as telemetry data.
Later on, you will use the telemetry data generated by your instrumentation to ask monitoring and debugging questions (maybe that’s why logs, metrics, and traces got labeled as the “pillars of observability”? ¯\(ツ)/¯)
We will discuss each telemetry data type in depth on separate posts, but let’s do a quick overview in case you are not familiar with them:
Logs
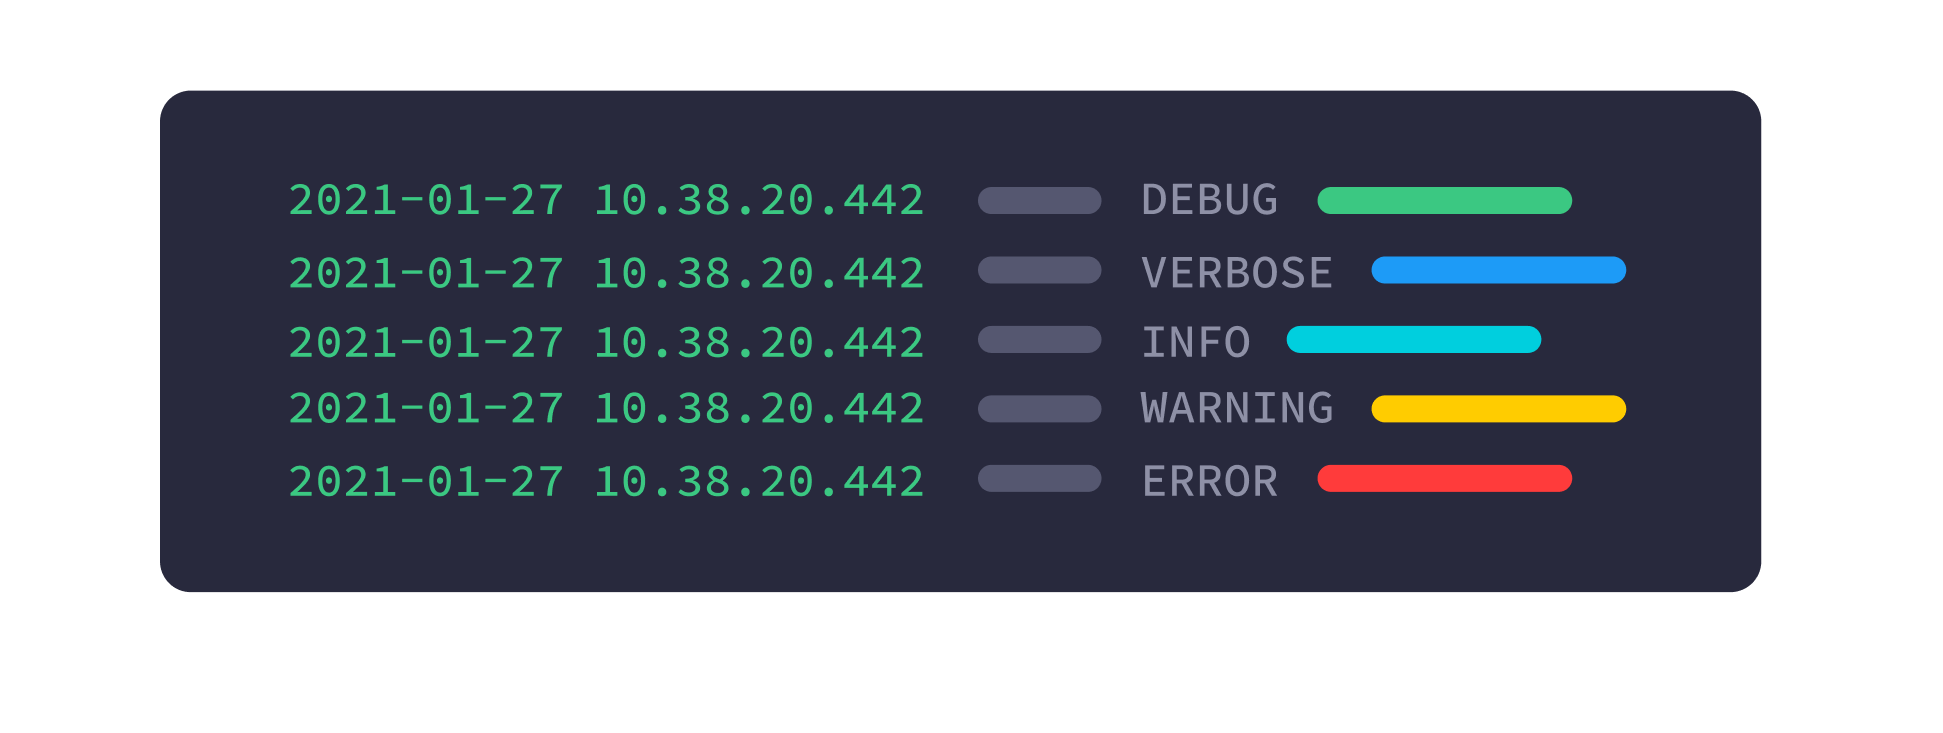
Logs are text-based evidence that something happened in your system. Most of the time logs have a timestamp, a severity indicator (something like info, warning, error, and so on), and a message that explains what actually happened. If you are lucky, you will stumble upon logs with a clear structure that makes it easy to extract data from them (a.k.a. structured logging), although that is not as common as it should be.
Almost every application framework out there has built-in integration with logging libraries, and will likely log something automatically when your application starts and processes requests. So, in a way, your applications might already have a very basic level of instrumentation in them!
Metrics
Metrics are numeric measures of your system’s state and behavior.
You can cover a lot of ground with metrics, from basic infrastructure measures like how much memory is used, and all the way up to application-specific measures like how long does it take to process requests or how big is your connection pool to the database.
Something that differentiates metrics from logs and traces is that metrics always describe what happened over a period of time (e.g. in 60-second intervals), while logs and traces can tell you exactly when something happened (e.g. started at 12:03:47.326 and finished at 12:03:47.811). On the other hand, metrics tend to be a lot cheaper to collect and analyze than logs and traces, but we will explore those trade-offs in a separate post.
Distributed Traces
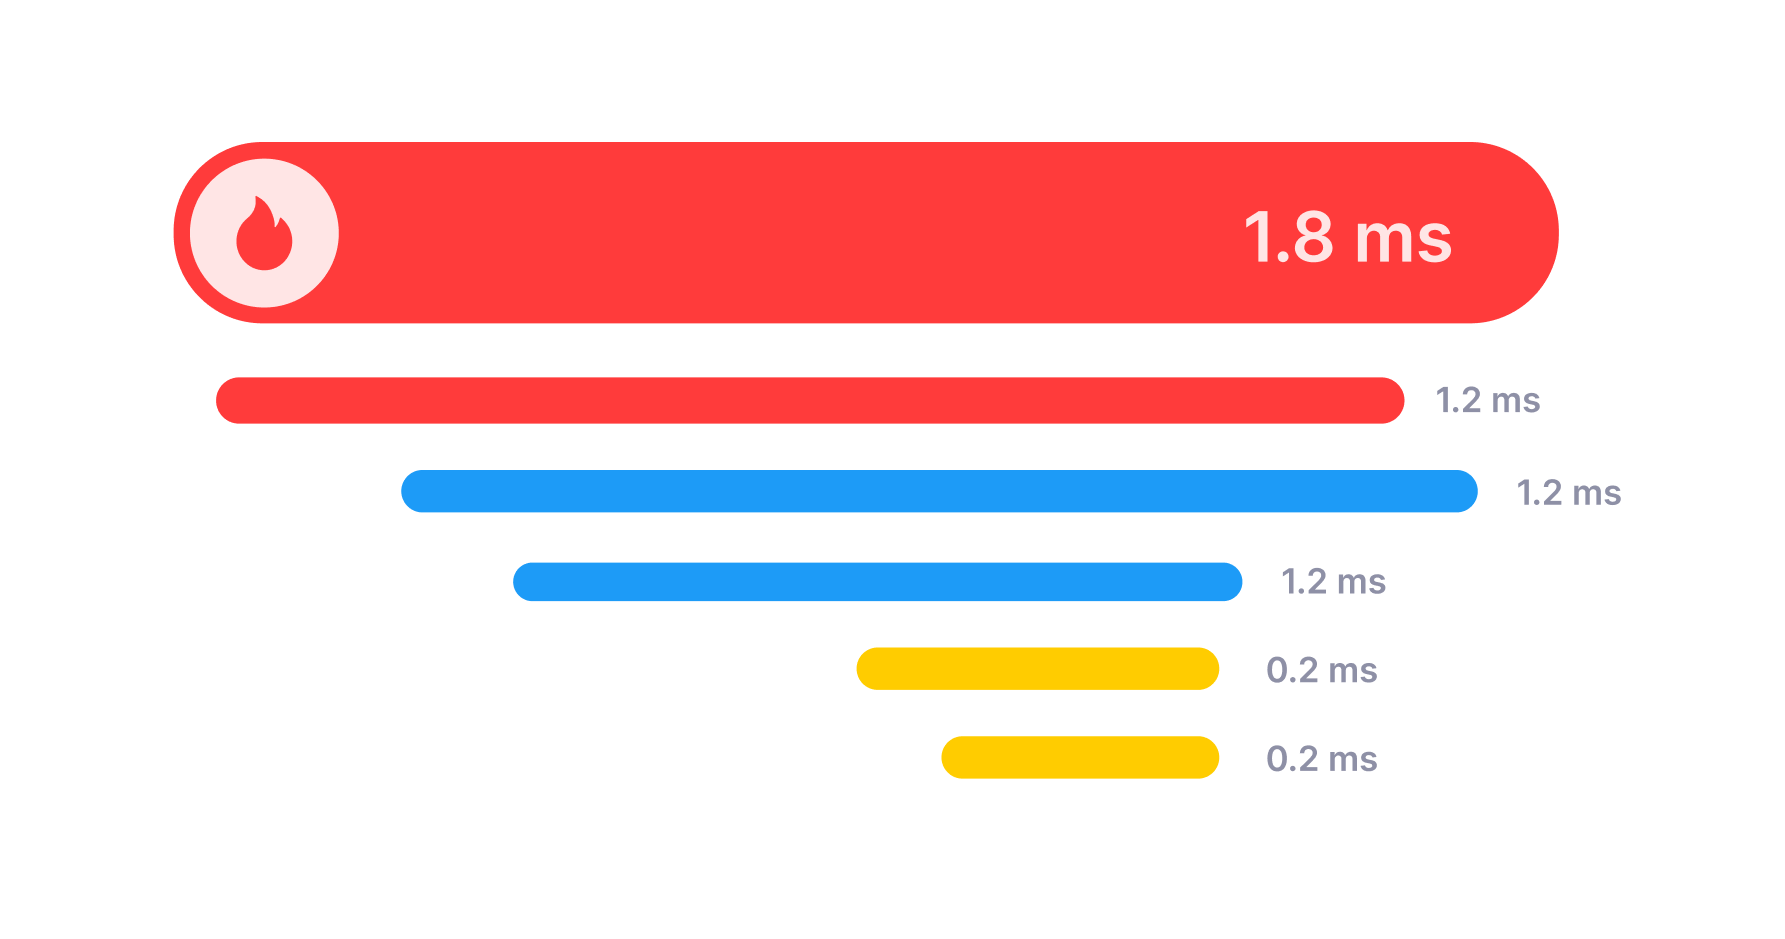
A trace tells you the entire story of a single request, from the moment it reached your external APIs, through all jumps across services, database calls, and message brokers, and until a response is sent back to the client.
Weirdly enough, traces are nothing but a collection of Spans. The spans and the relationships between them are the really important thing here. A span is a description of a single processing step that took place to serve a request. For example, one span can represent an HTTP call to an payments API. Another span can represent a database UPDATE query. Spans can even represent the execution of methods within your code base, if you want to.
The “distributed” part of tracing comes from the fact that these spans can (and usually will) be generated by different applications, on different servers, and then all those spans get collected and stitched together to show the entire trace.
Instrumenting Applications for Real
The good news about instrumentation is that the heavy lifting is mostly solved already through instrumentation libraries. You don’t need to be an expert to get telemetry data out of your applications.
Tools like OpenTelemetry, Micrometer, and Kamon Telemetry can help you generate metrics and traces fairly quickly, and the work you will actually have to do is reduced to:
- Installing an instrumentation library that supports your tools and frameworks, and
- Enriching the out-of-the-box instrumentation with your own domain-specific knowledge
For example, instrumentation libraries will know how to measure latency and create traces around your HTTP requests with almost no effort on your side. That’s nice to have, but those metrics and traces can get a lot more useful when you add additional context to them, like user ids, session ids, user types, and anything that helps you describe the context of a particular request.
Keep in mind that instrumentation is never a one-off process. As your applications evolve, your instrumentation should evolve too. As a rule of thumb, you will tweak your instrumentation when:
- You are shipping new features. Because you will introduce new pieces of context that can (and probably will) be useful for monitoring and debugging
- You have a hard time monitoring or debugging an issue. You will certainly face issues that would be easier to solve if you had X, Y, or Z information in your telemetry data, and it is totally normal to add a few lines of code here and there to ensure that those extra details will be there next time you need them
You will never get your instrumentation right on the first try, and that is fine. What really matters is to get familiar enough with the concepts and libraries you are using, so that there is no friction when you need to create new metrics, enrich spans with request-specific tags, or create your own spans.
Monitoring in Practice
We mentioned earlier that monitoring is about asking the same question over and over again until you get a bad answer.
You could create a dashboard with your most important metrics and hit the refresh button compulsively until you see something weird, and that would be called monitoring. Been there, done that.
Fortunately, computers are better than humans at repetitive tasks like this. You are better-off configuring automated checks that repeatedly ask your monitoring questions and notify you when a bad answer comes up.
For example, you can configure an automated check that notifies when your application’s p90 latency goes over 3 seconds, and only worry about debugging latency issues when a notification reaches you.
Different tools refer to these automated checks in different ways. You will see names like alerts, monitors, triggers, or health checks. The principle remains the same, though: ask the same question over and over again, and get notified when a bad answer comes up.
This doesn’t mean that dashboards are bad. In practice, you will almost always have dashboards tracking your most important metrics, together with alerting rules that ensure you will know if something is wrong, even when you are not watching.
We will dig into monitoring later, but if there is anything we would love you to know before hand is this: too many dashboards and alerts will drive you crazy. If you get notified every few minutes about things that aren’t really important, you will stop paying attention to those notifications. Then it is just a matter of time for real problems to slip through the noise and bite you harder than they should.
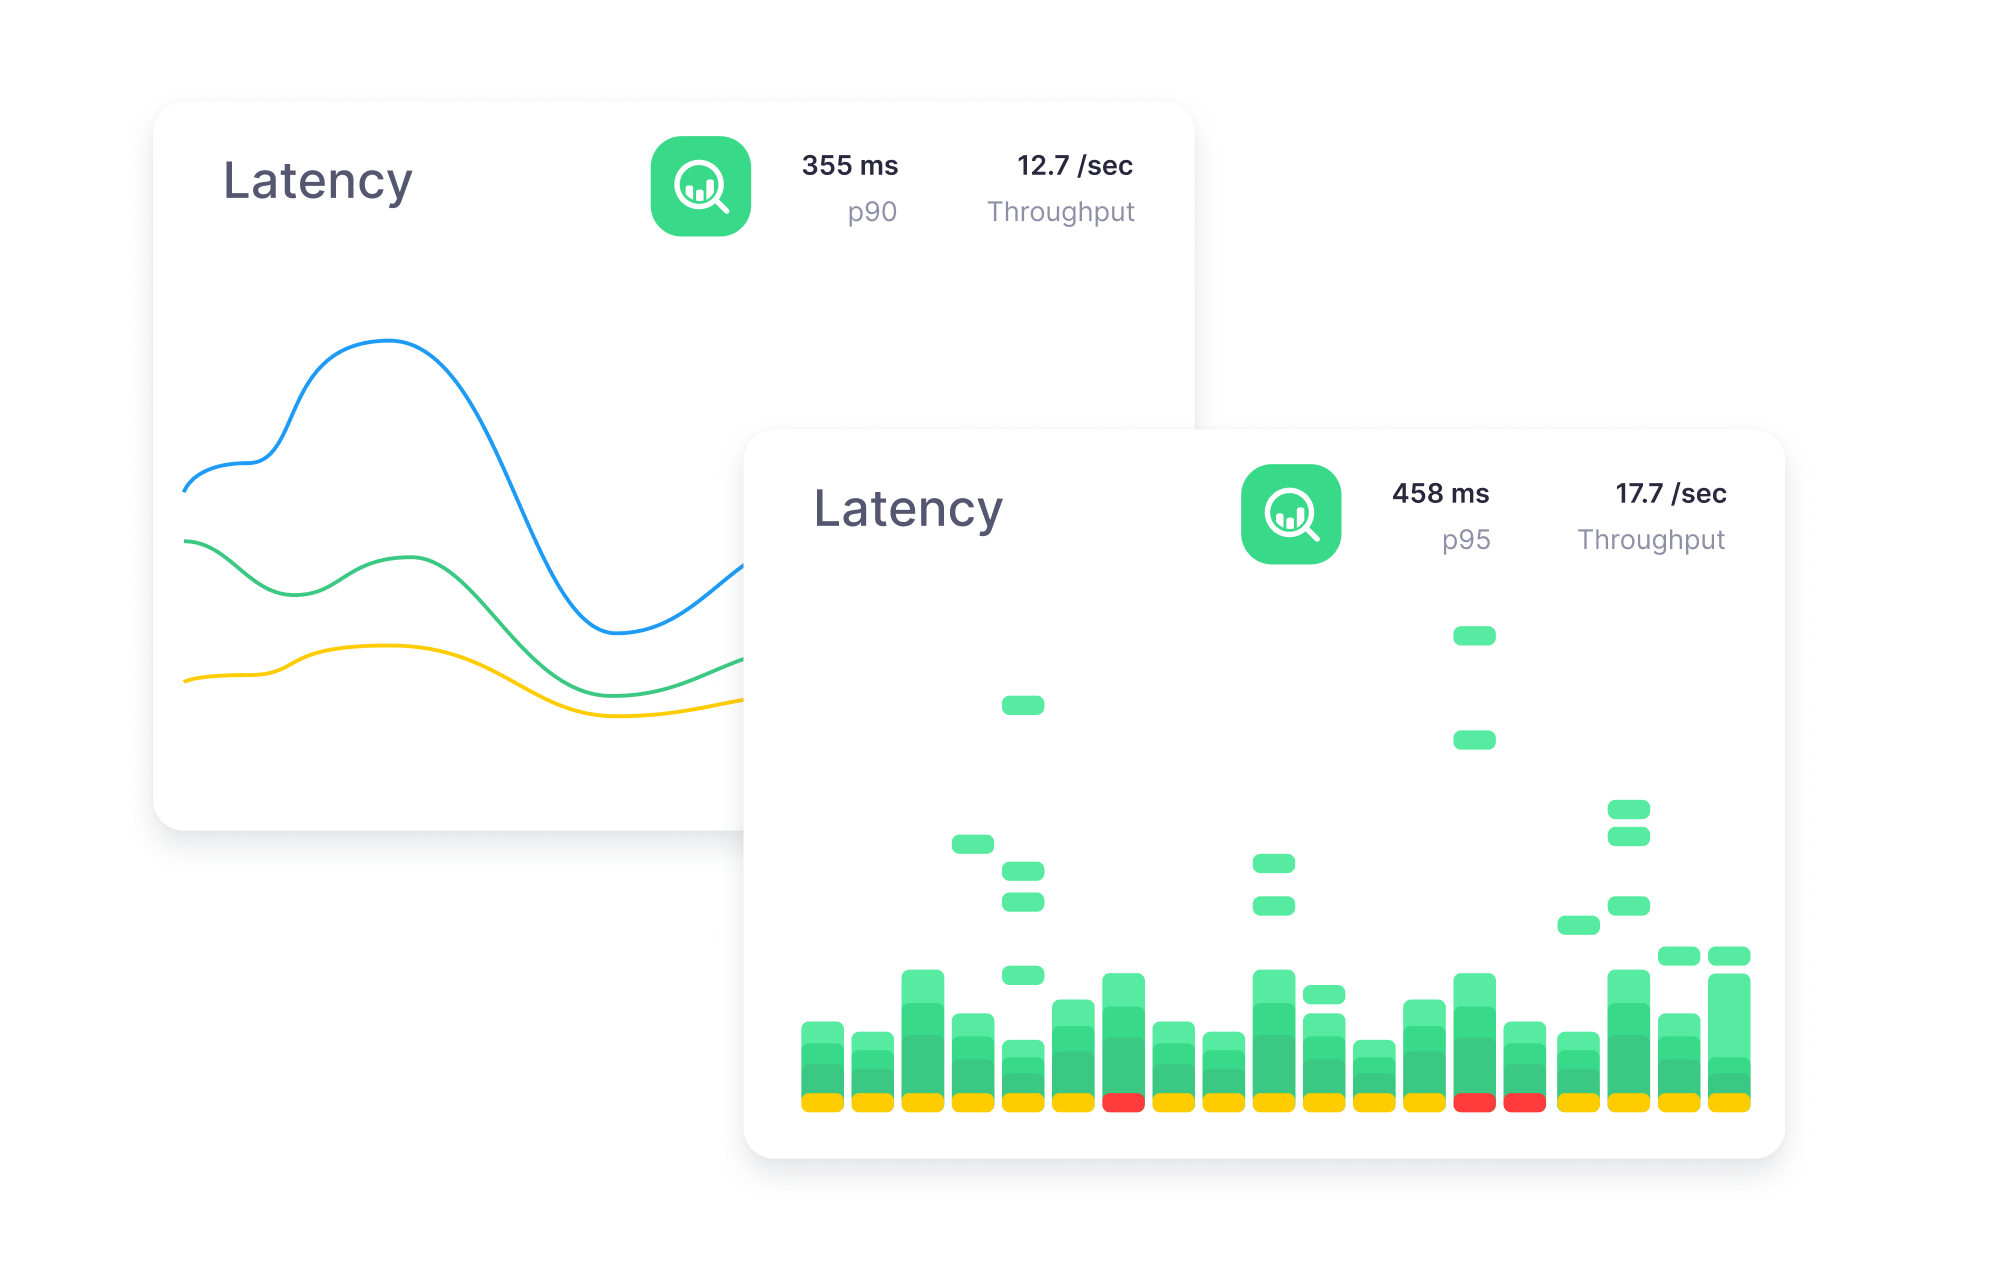
In the majority of cases you will be just fine with monitoring these three signals for every service:
- Latency, because your users want every interaction with your service to be snappy
- Throughput, because having a spike in throughput might signal abuse, and no throughput at all might mean users have problems reaching you
- Errors, because requests might get processed fast but be returning errors instead of valid responses
You might even want to get fancy and create Service Level Objectives (SLOs) on top of those metrics, but for starters being able to know when latency, throughput, or error rates go wild is good enough to get off the ground.
Debugging
Debugging can be, by far, the most exciting and challenging part of managing production systems. This is the part where you know something is wrong and need to figure out why, while the system is on fire and users are having poor experiences with your product. Pure fun.
While monitoring is about asking the same question over and over again, debugging is about asking new questions that help you find the root cause of the problem you are seeing.
For example, when you get a notification saying that your p90 latency is above 3 seconds, your dashboards and alerts are not very relevant anymore. At this point, the ability to ask new questions is what will get you out of the hole:
- Is this happening to every user?
- Is it happening on every endpoint?
- Is it happening on all of our servers?
- What infrastructure pieces are connected to the slow endpoints?
- Did we deploy a new version recently?
- Is there a change in traffic patterns?
- What do the slow requests have in common?
The answer to one question will lead you to the next, until something clicks and you figure out what the root cause of your problem is. Then you can go and figure out how to fix it.
Debugging sounds like a tough ride through uncharted territories, and sometimes it is. But in practice, if your applications are instrumented decently, a good chunk of the debugging work gets solved by grabbing a handful of traces connected to the issue and asking two questions: what do they have in common? and, how are they different from the good traces?
Sometimes you can answer those questions by yourself; opening 10 tabs with traces and comparing them manually is nothing to be ashamed of. Sometimes the tools you use will automatically suggest interesting correlations and statistical comparisons. That’s even better.
All in all, what really matters on the debugging side of observability is being able to ask new questions. Some of those questions can be answered with metrics, some others with traces. The better your tools are at letting you ask new questions, the easier it will be for you to debug whatever issue the production gods throw at you.
The Observability Landscape
Before closing this article, we thought it might be interesting to make a list of tools and concepts that get mentioned often in the observability space, together with how we think they fit the three jobs to be done in observability:
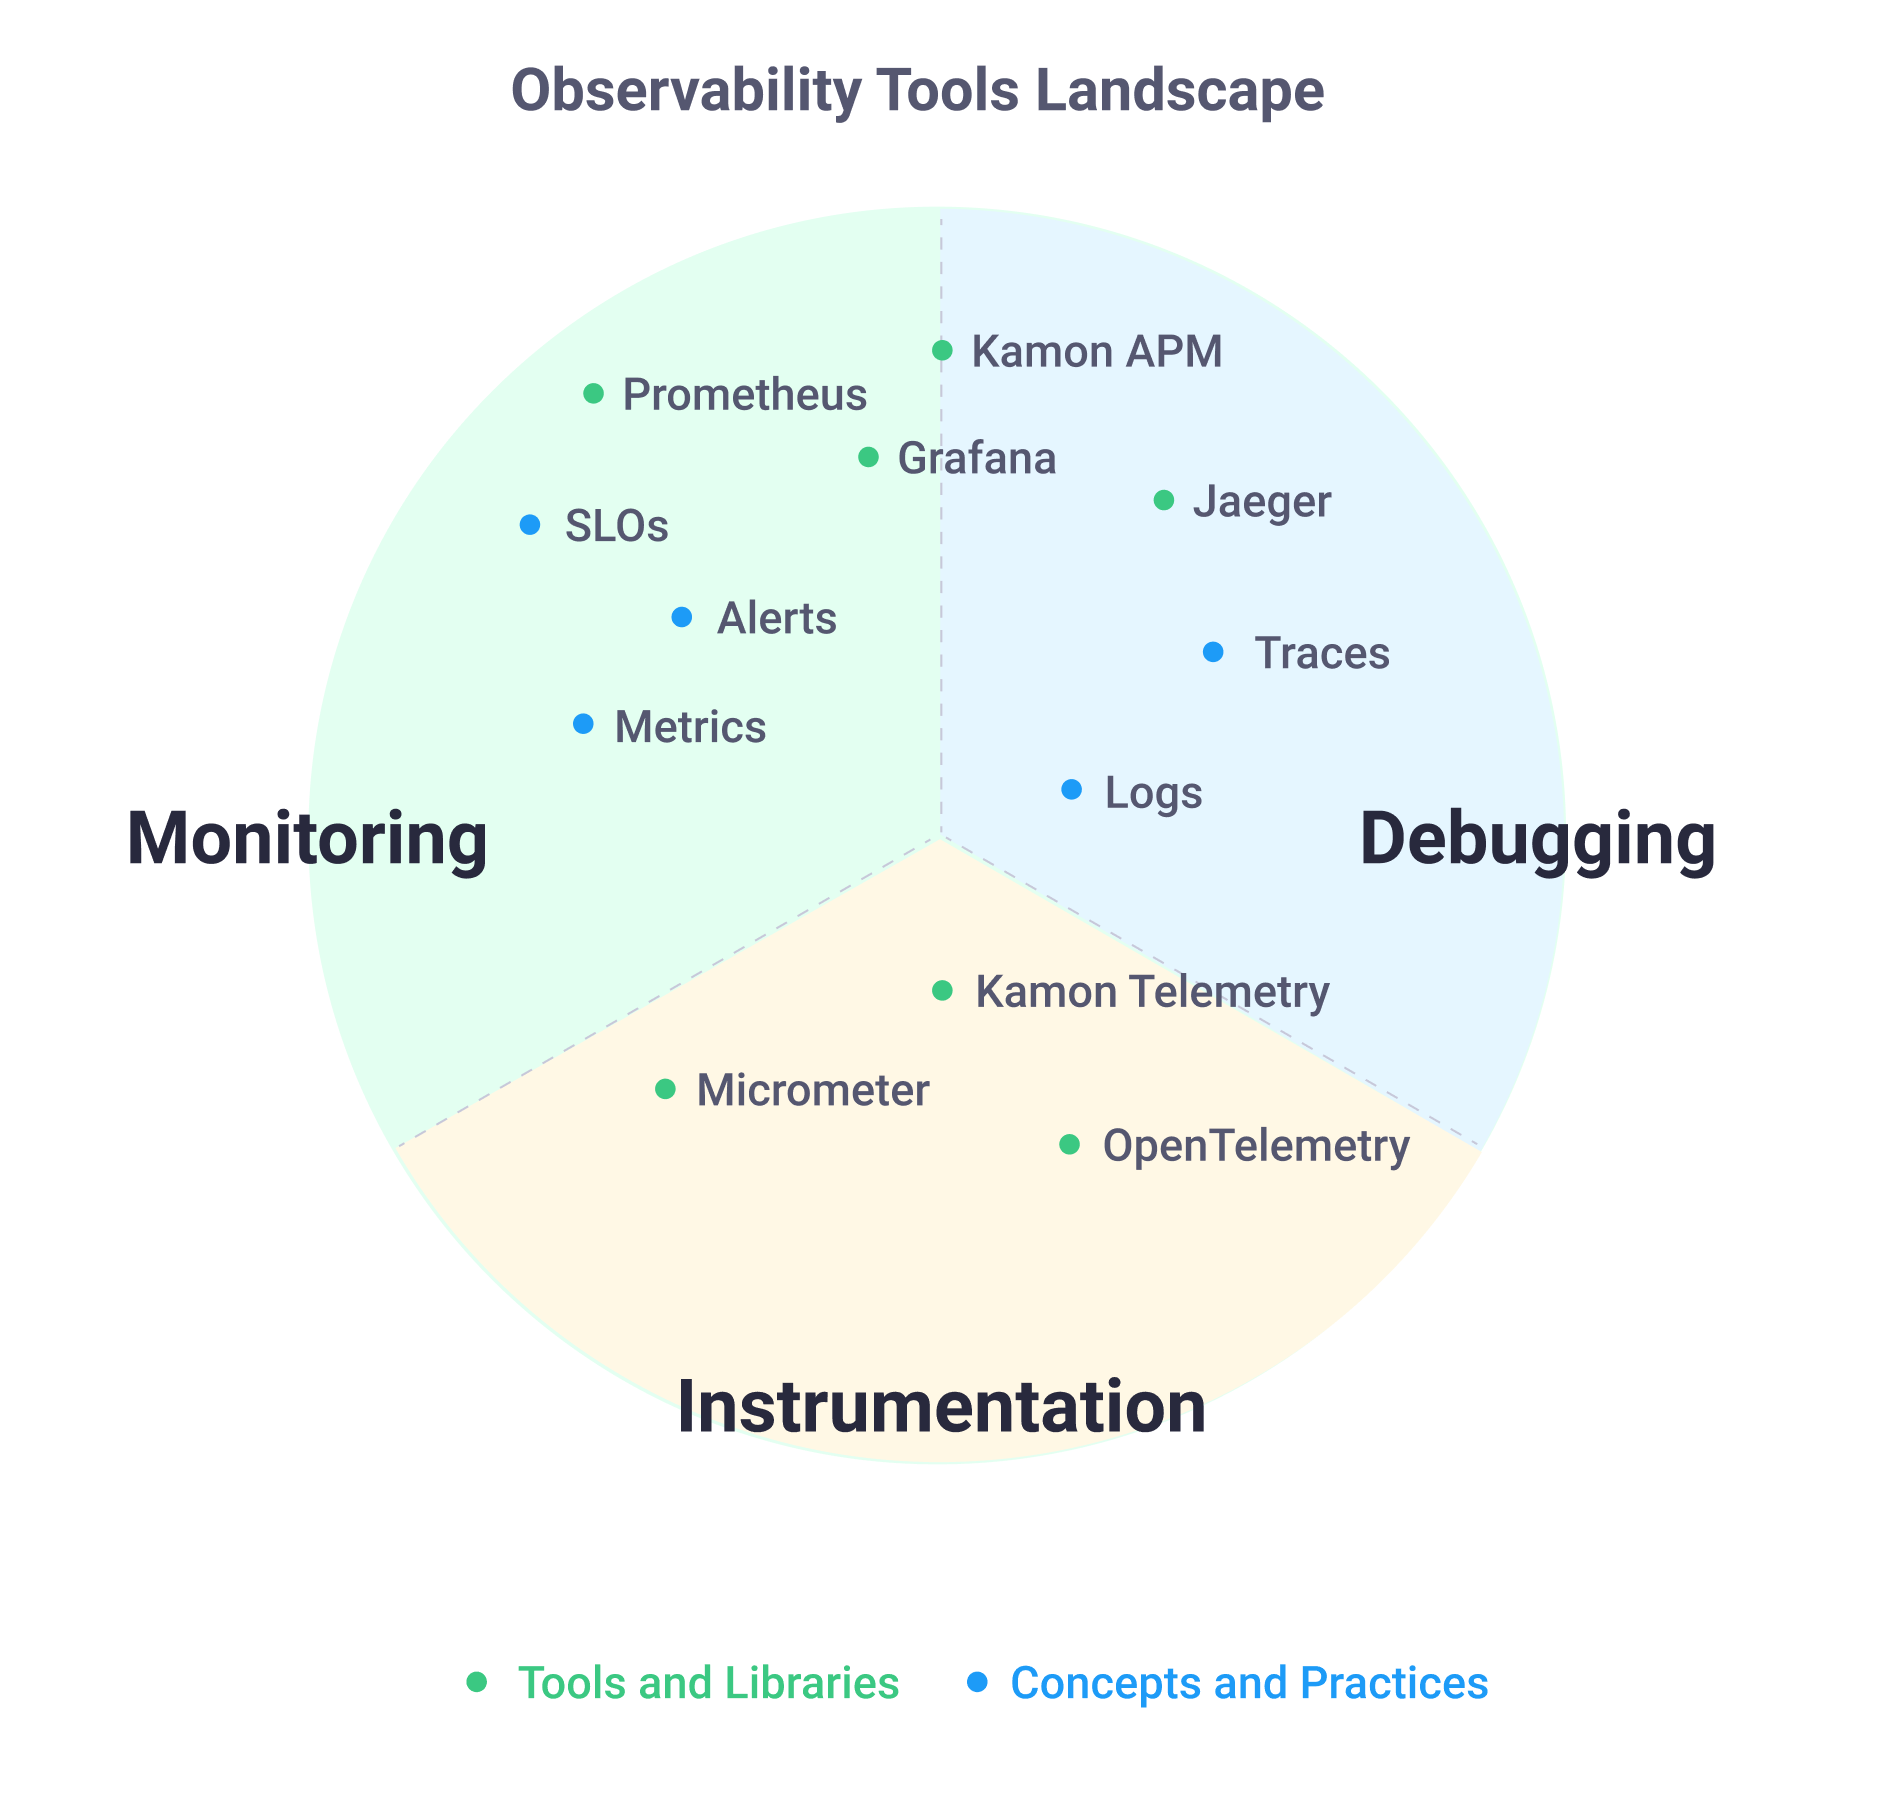
We placed each tool and concept on the area we believe they solve best, regardless of whether they can be used for something else. For example, you could derive metrics from traces and use that for monitoring, but that would not be as effective as just using metrics for monitoring.
This is by no means an exhaustive landscape, but it is complete enough to understand this: you will need to pick at least one tool on each piece of the cake when building your observability stack.
Let’s say you are thinking about using Prometheus because, well, everybody is using it and talking about it. Prometheus has been rocking it on the monitoring side of things for years, but you will probably have a hard time debugging issues with metrics alone. That’s not a problem with Prometheus itself, but with the fact that metrics are not super awesome for debugging. So, you will end up pairing Prometheus with Zipkin or Jaeger for distributed tracing to complete your observability stack. Or you can just go ahead and try Kamon APM instead… just saying :D
Something similar happens on the instrumentation side. For example, Micrometer is an awesome instrumentation library for folks running on the JVM, but it is purely focused on metrics. If you want to level up your debugging game on the JVM, you will need to introduce a different library for tracing. It could be Spring Cloud Sleuth if you are using Spring. Or you could go with Brave (for Zipkin), OpenTelemetry, or Kamon Telemetry. Still, you will need to bring in another library.
The same is true if you are using the Prometheus Client libraries on any other programming language: it’s awesome that you can get metrics out of your app so easily, but you will need to bring in another library if you want to have tracing too.
So, to close it up. Next time you think about observability, remember the three jobs you need to get done: instrument, monitor, and debug, and make sure that whatever tools you choose, you got your cake covered.
That’s it for today folks. Ping us on Twitter or join our Discord Server if you want to keep the conversation going, we are happy to chat!