How to Keep Traces for Slow and Failed Requests
Today we are introducing Local Tail-Based sampling in Kamon Telemetry! We are going to tell you all about it in a little bit but before that, let’s take a couple minutes to explore what is sampling, how it is used nowadays, and what motivated us to including local tail sampling in Kamon Telemetry.
Sampling 101
Sampling is a way of controlling how many spans are generated by systems dealing with distributed tracing. Broadly speaking, sampling works as follows:
- When a request hits the first instrumented component in your system, the tracing library starts a new trace and immediately decides whether to keep or drop that trace. Or, in other words, whether to sample it or not the request
- Every other application component follows that already-made decision and propagates it to other components when necessary
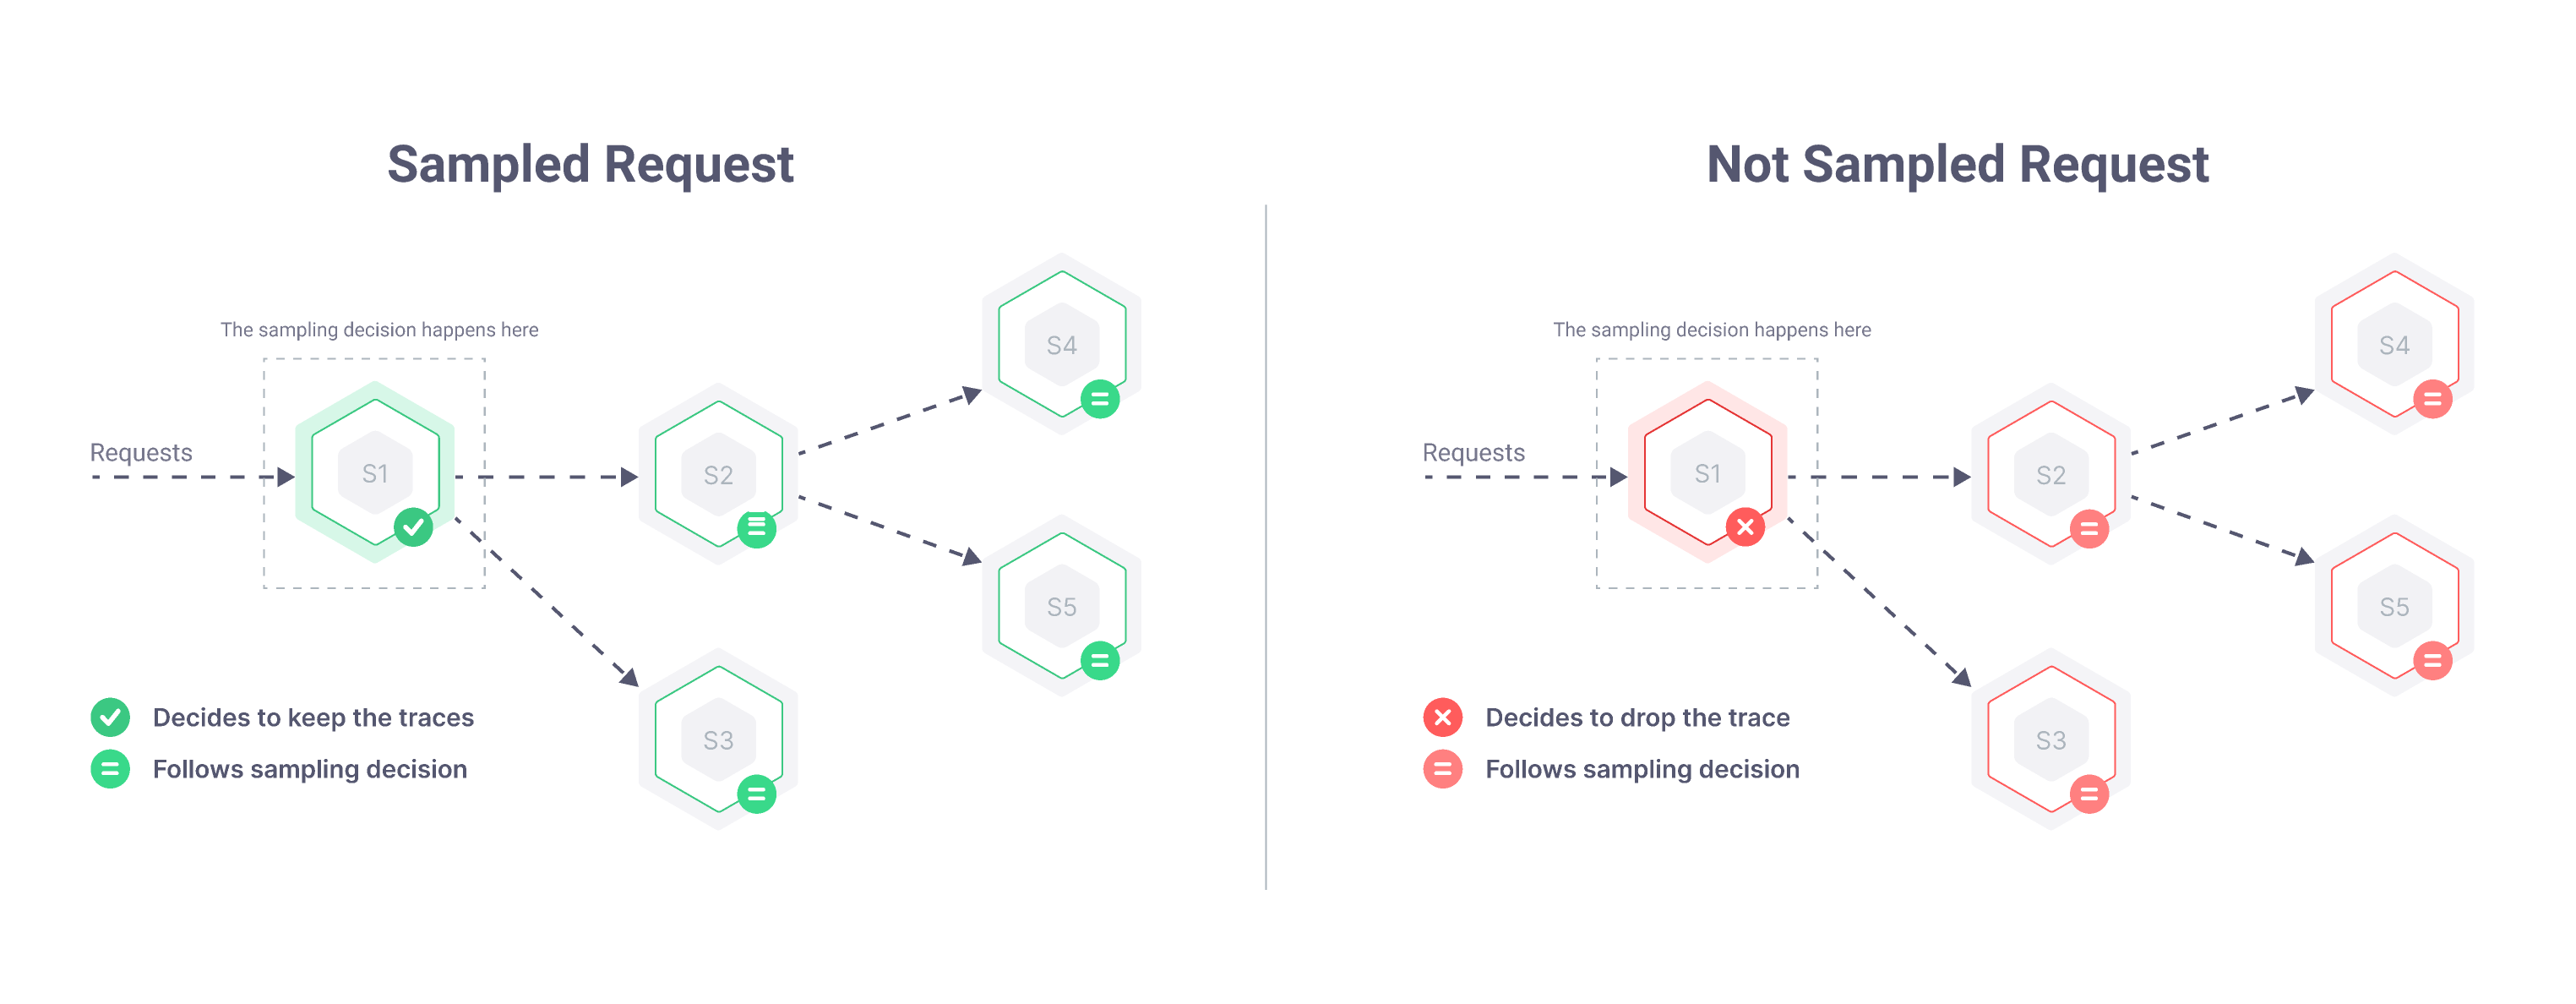
Adjusting the percentage of sampled requests on the first component effectively controls how many spans are generated by the entire system because once a sampling decision is taken, it must be followed everywhere else.
Propagating the sampling decision also guarantees that all participating components will generate spans for their part in serving a request. This guarantee leads to getting either all spans for sampled requests, or no spans at all for not sampled requests. So far, so good.
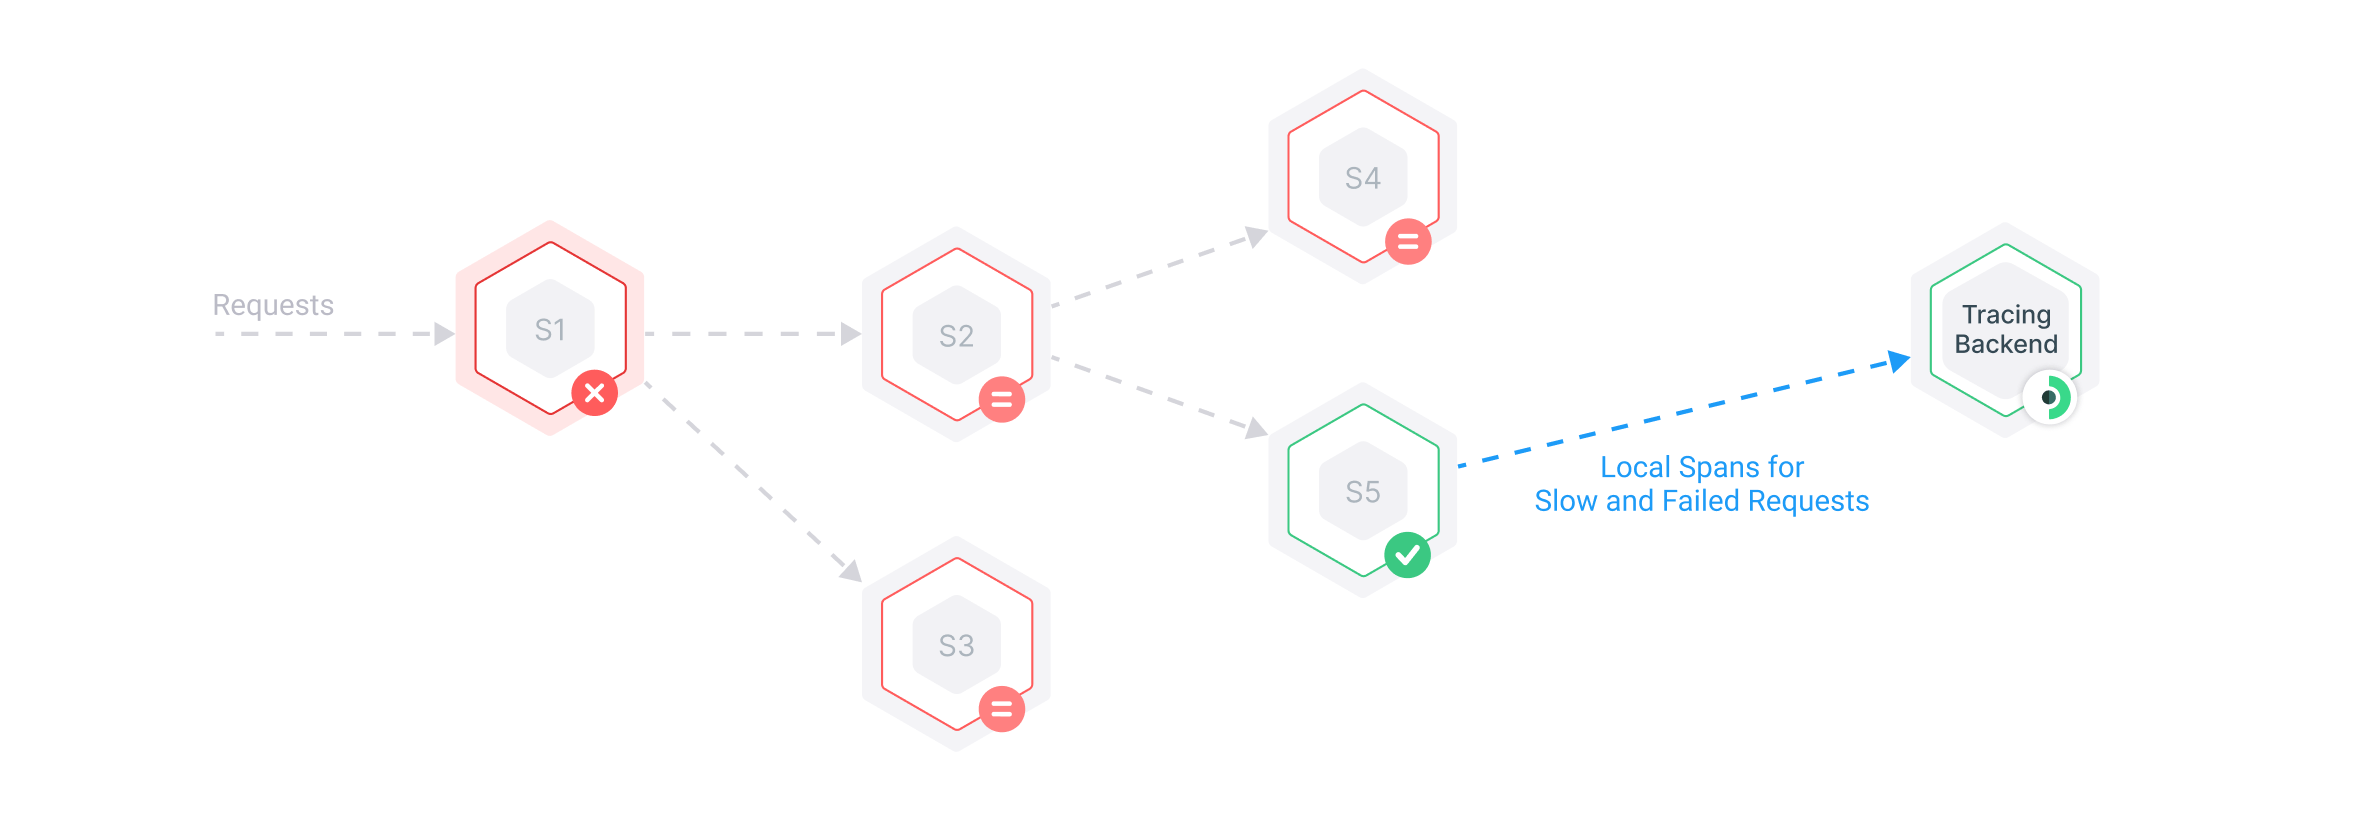
There is a shortcoming to this approach, though: since the sampling decision must be taken before processing even starts, it can lead to keeping a bunch of boringly “good” traces for fast and successful requests that happen a lot, and very little or no traces for slow and failed requests that do not happen so often.
In theory, if slow requests and errors happen often enough to affect your application’s behavior then they will eventually get sampled.
In practice, it is not that simple. Let me elaborate using a real world case:
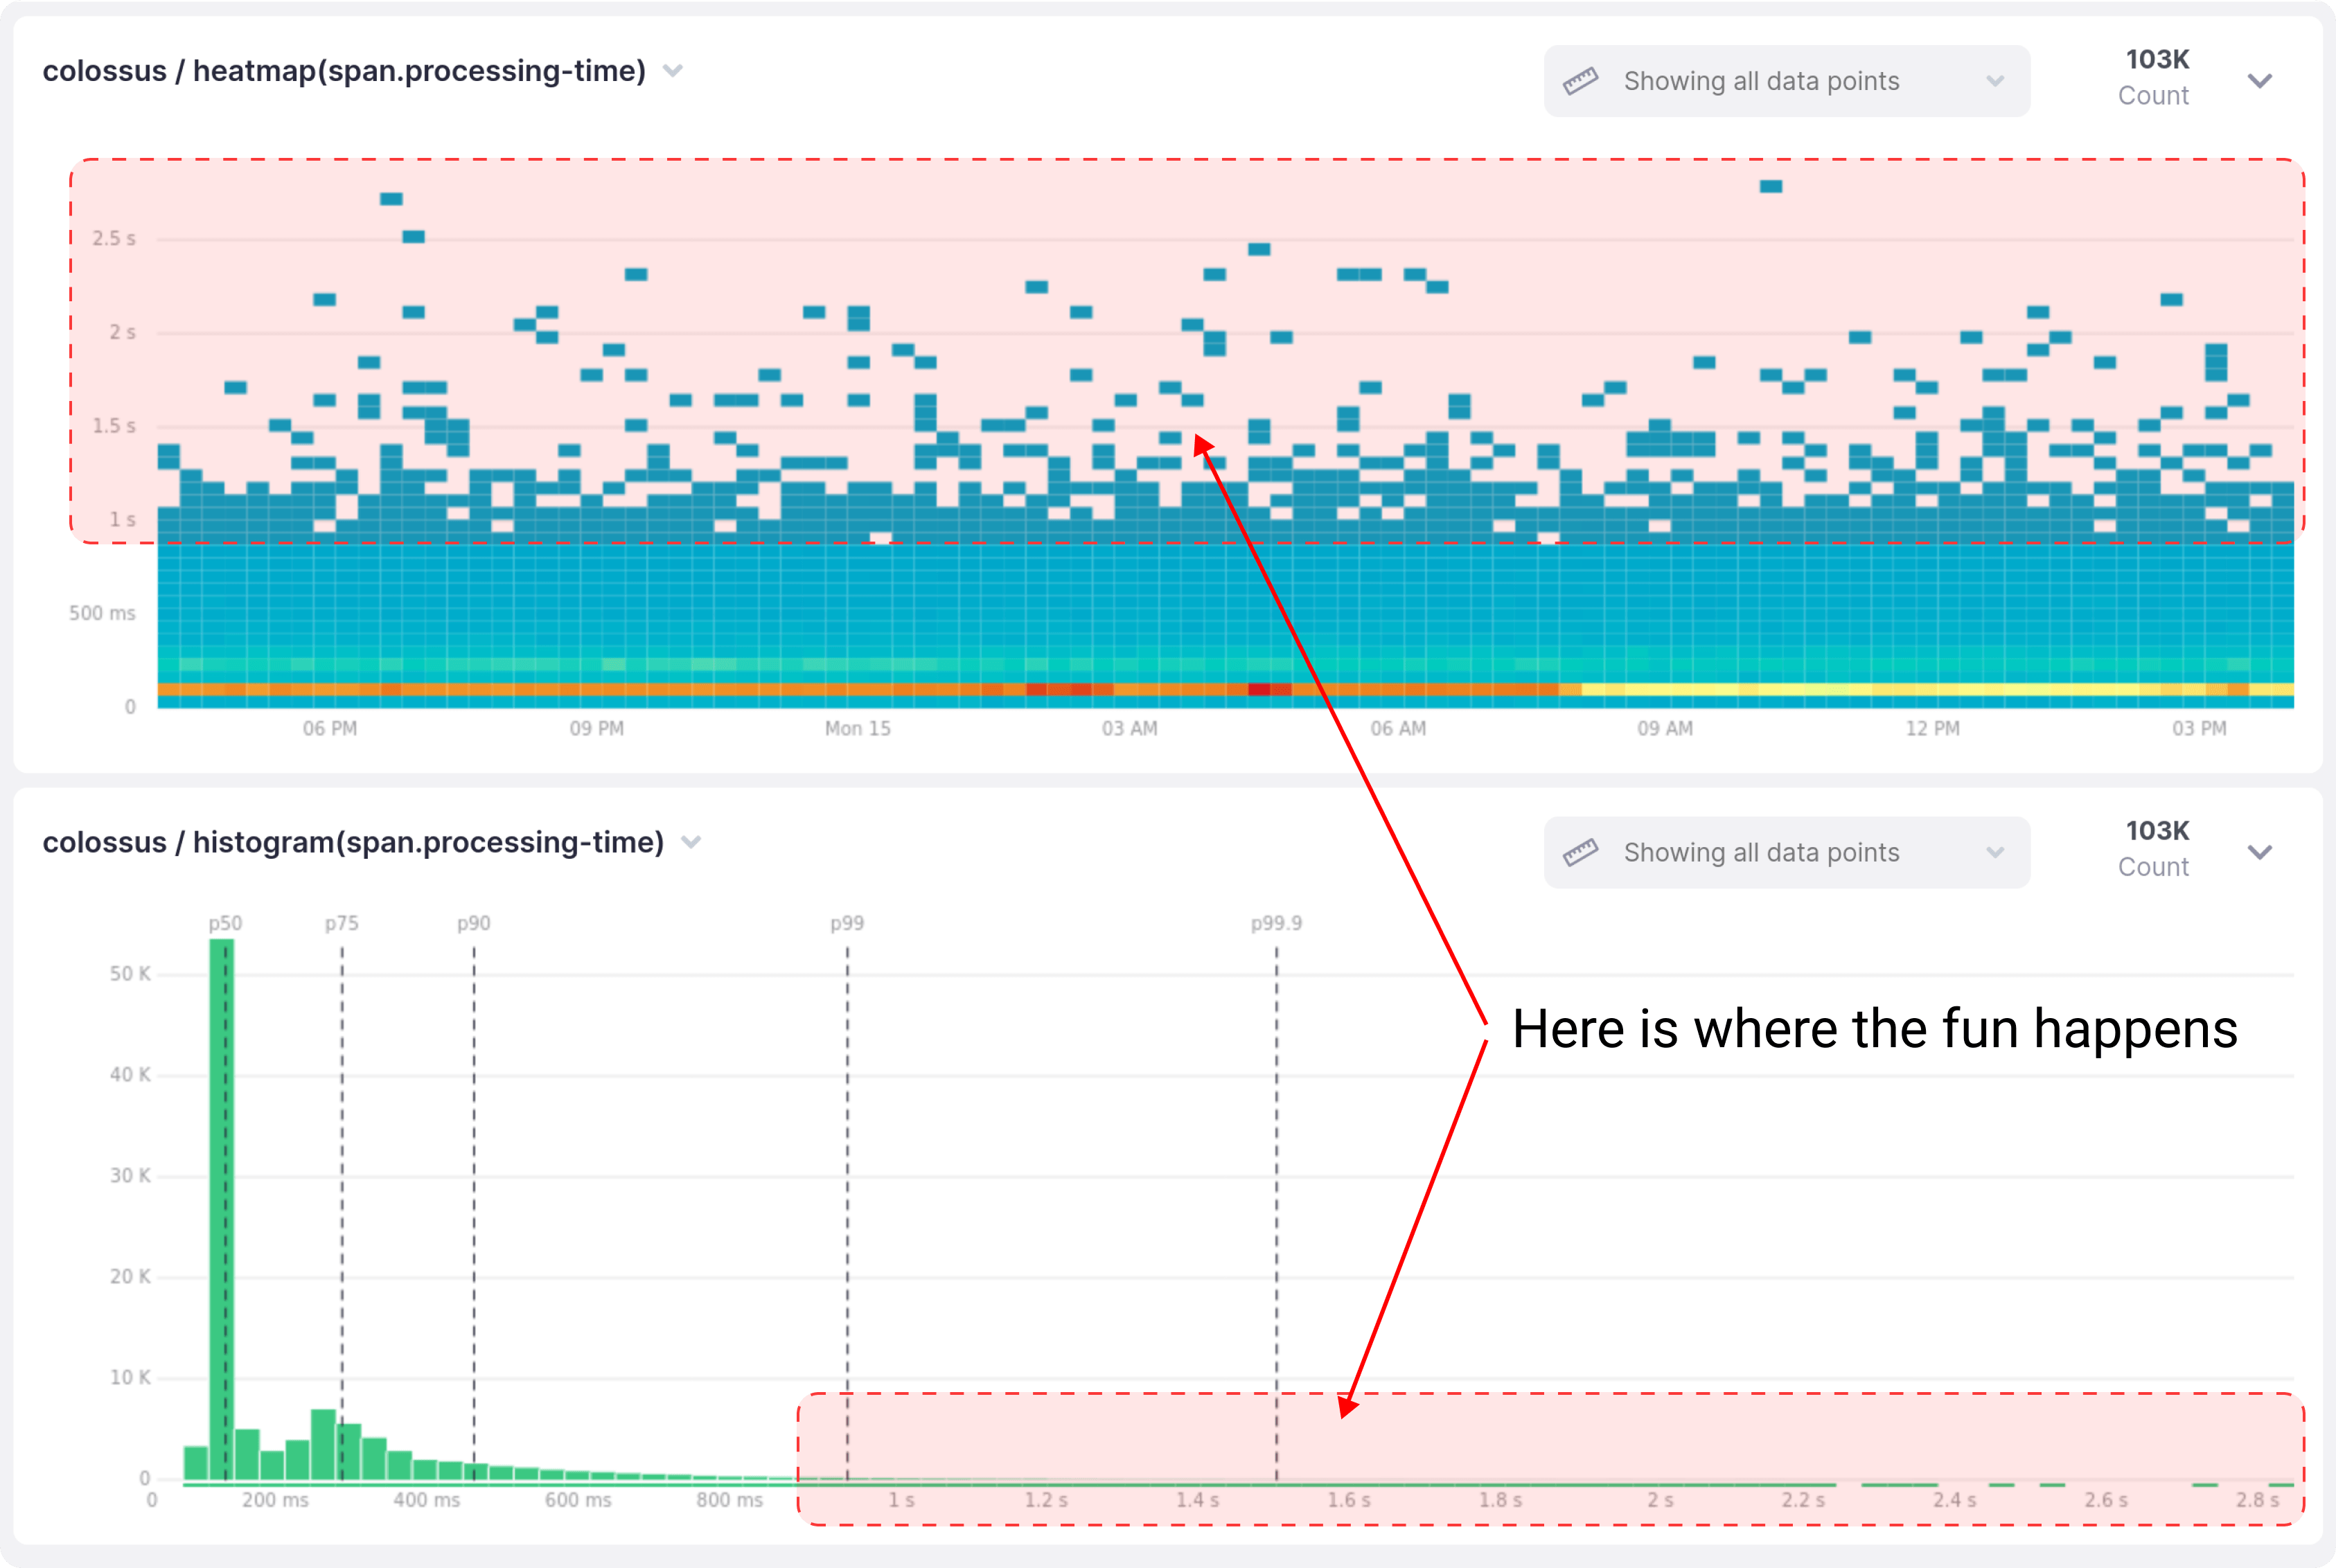
During the 24-hour period shown above, 99.4% of all requests took less than a second to complete on this service. I’m picking the one second barrier because our latency target for this service is a p99 of up to one second.
The usual course of action would be to gather a bunch of traces for requests that took longer than a second, compare them with the “fast” ones, and work on improving the bottlenecks. Nice and easy.
Except that having enough samples of those high-latency traces is not that simple.
Only 0.6% of all traces would be useful for this investigation. If we were using a sampling rate of 10%, which is not uncommon, each one of those slow requests only has a 0.06% chance of getting sampled.
Something very similar happens when debugging intermittent latency spikes and errors. Unless the problems are really wide spread, it is hard to ensure you will have traces for those requests. You might get lucky, but there is no way to be sure until you try to find them.
If you think about it for a second, you might start wondering: what’s the point of tracing if we are not going to get the slow and failed requests traces when we need them? And I wonder the same.
Finding and keeping interesting traces is one of the big challenges in distributed tracing. Let’s explore the three ways you could solve this problem today.
Sample Every Request
The simplest solution would be to keep traces for all requests, no matter what. That way, it doesn’t matter what research or debugging questions come to mind, the answer is going to be there for sure.
Compared to keeping a random sample, storing every single trace comes with a few extra costs:
- There will be extra CPU and memory usage in your applications due to creating, batching, and writing spans to the network
- There will be a network overhead for transferring those spans, and this overhead can get multiplied if you have intermediary agents or message brokers between your applications and your tracing backend
- Finally, there will be a processing and storage overhead in your tracing backend. Depending on your backend of choice, there might also be a penalty in response times for your queries when the spans volume is too high
It sounds like a lot of overhead and variables to keep in mind, but the actual cost might not be as high as you think. Anecdotally speaking, if your system averages one request per second in a day and each request produces 10-ish spans, then the CPU, memory, and network overhead won’t be really noticeable, and you can keep all of those spans comfortably within the limits of our Starter Plan, with some room to spare.
As a software engineer interested in performance-related topics, the idea of capturing traces for all requests always sounded terribly wasteful, almost as if it was the lazy solution to this problem. But in practice I must admit that the ability to find relevant traces for any production issue that comes up is incredibly valuable.
If your spans volume and infrastructure allow for it, just keep every trace and don’t bother with sampling until the overhead becomes big enough that you must do something about it. If you already got there, keep reading.
Tail-based Sampling
Before moving further, let me repeat this right away so it sticks with you:
the ability to find relevant traces for any production issue that comes up is incredibly valuable
Tracing is incredibly valuable if you can find relevant traces when you need them. But that doesn’t mean you need to sample every single request to find relevant traces.
This is where tail-based sampling comes in. The idea behind tail-based sampling is that you collect spans for every request and send them to an aggregator that will stitch them together into traces, and decide whether to keep or drop the entire trace based on conditions of your choice.
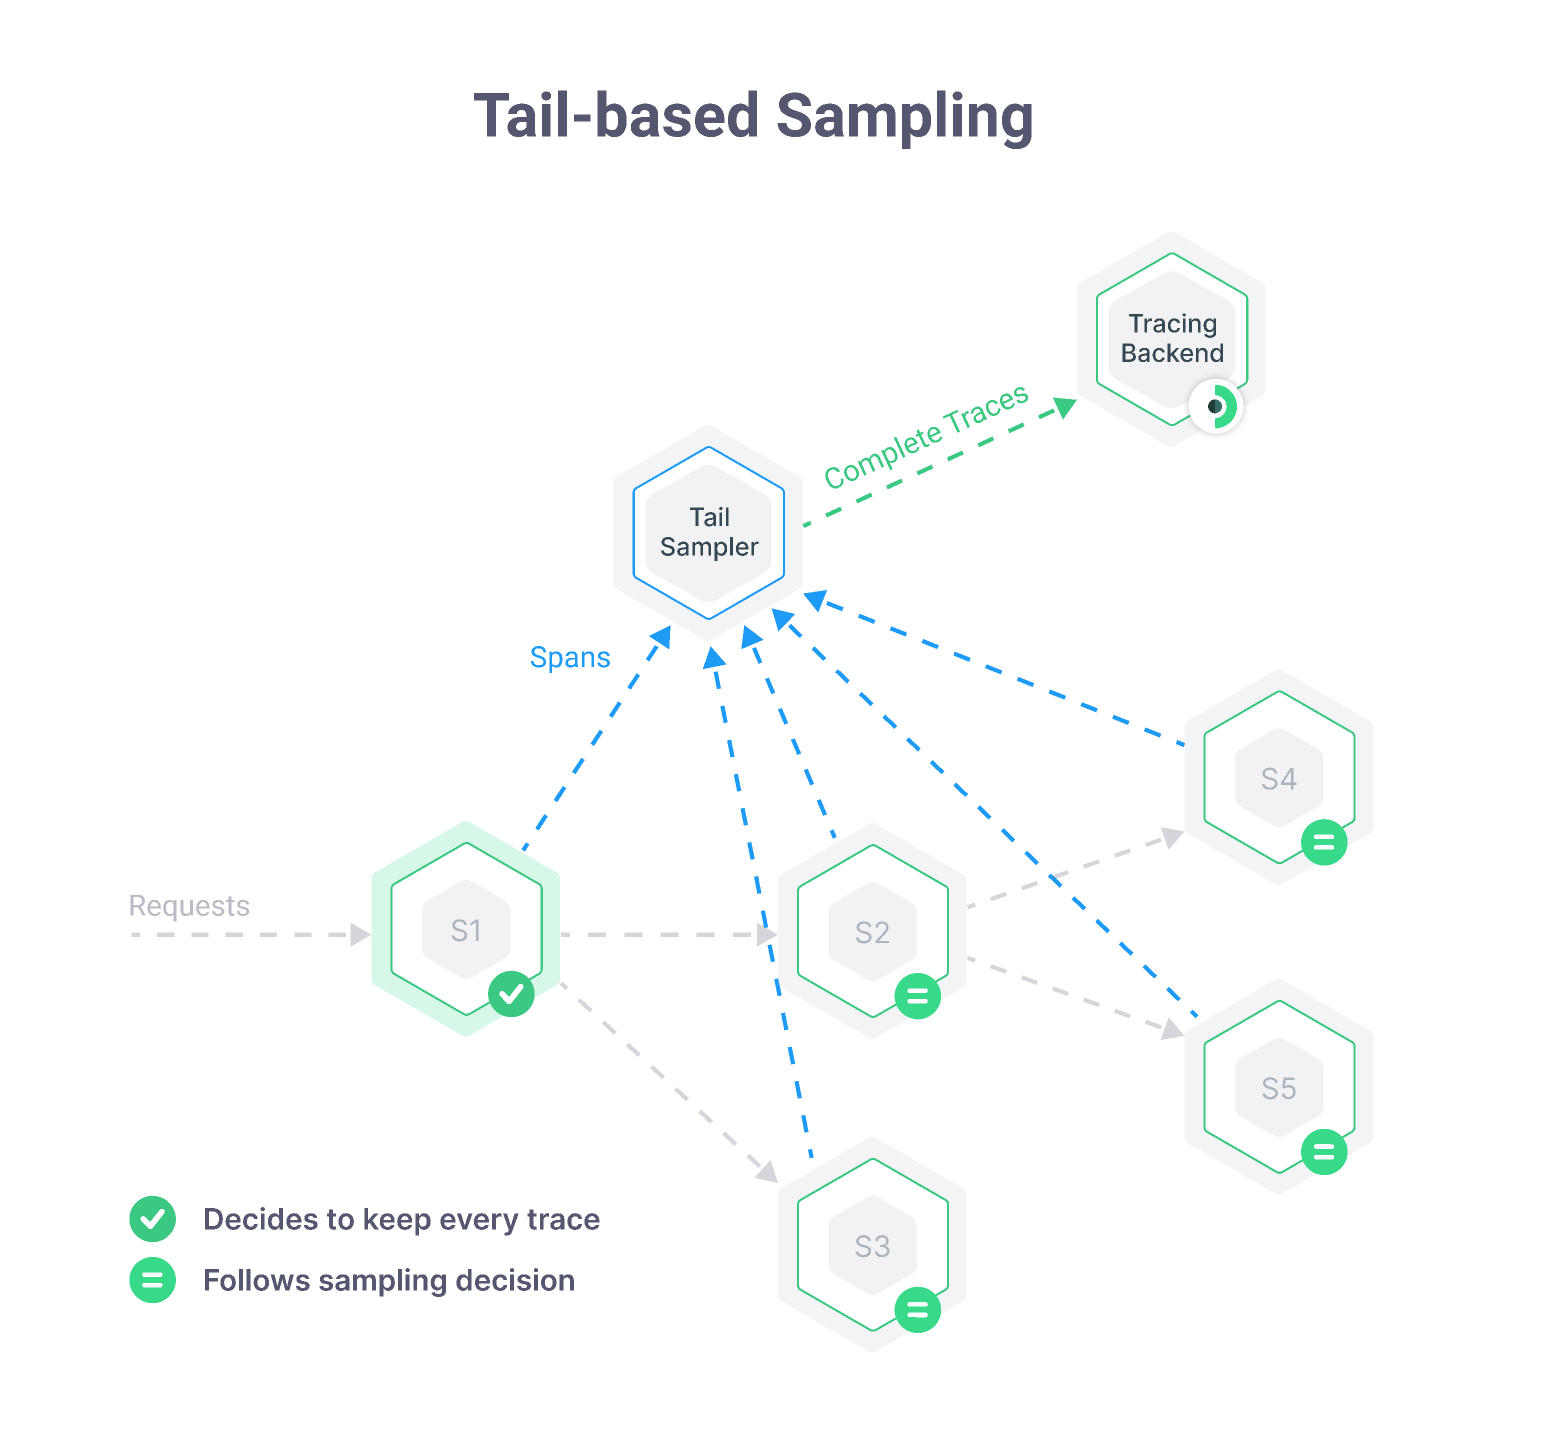
Imagine defining rules like “keep traces with errors” or “keep traces where customer.kind=enterprise and duration is over 500ms”, and letting the aggregator take care of the rest. If you are clever enough with your sampling rules, it is very likely that you will always have relevant traces for slow and failed requests.
If I needed to implement tail-based sampling today, I would definitely try out the tail sampling processor in the OpenTelemetry collector. We didn’t get to try it yet, but the policies configuration seems pretty flexible. We are definitely going to give it a proper try and write something about it in the near future. Stay tuned for that!
Using tail-based sampling doesn’t free you from paying the CPU, memory, and network overhead of sending all spans to the collector, and there is a new extra challenge of managing and scaling the collector itself.
Nevertheless, you can score major savings in the number of spans that actually get sent to and stored in your tracing backend, all while ensuring that you keep as many interesting traces as you can.
Introducing Local Tail-based Sampling
When people talk about tracing, the “distributed” part is implied. It is common to assume that if a team is using tracing then they must have several services talking to each other. And we know that traces can only show the entire story of a request if they contain spans from all services that participated in serving that request.
But what if you are not dealing with multiple services?
Tracing is as valuable in monoliths, as it is in distributed systems. In fact, with all the business logic that gets piled up over time in a monolith, tracing might be the easiest way to discover how the monolith actually works.
Monoliths have the unique advantage that everything required to handle a request happens in a single process. Of course, there will be calls to external APIs and databases, but the main driver in the processing flow is the monolith itself.
Since all processing happens in one place, we could keep all spans in memory for a few seconds and then decide whether to keep or drop the entire trace before sending anything to the tracing backend, and that’s is exactly what local tail-based sampling is about.
We don’t know if this is a widespread practice, but so many people asked if it was possible to do this in Kamon Telemetry that we decided to just go ahead and build it. Today we are releasing it as part of Kamon Telemetry v2.4.0.
Here is how it works:
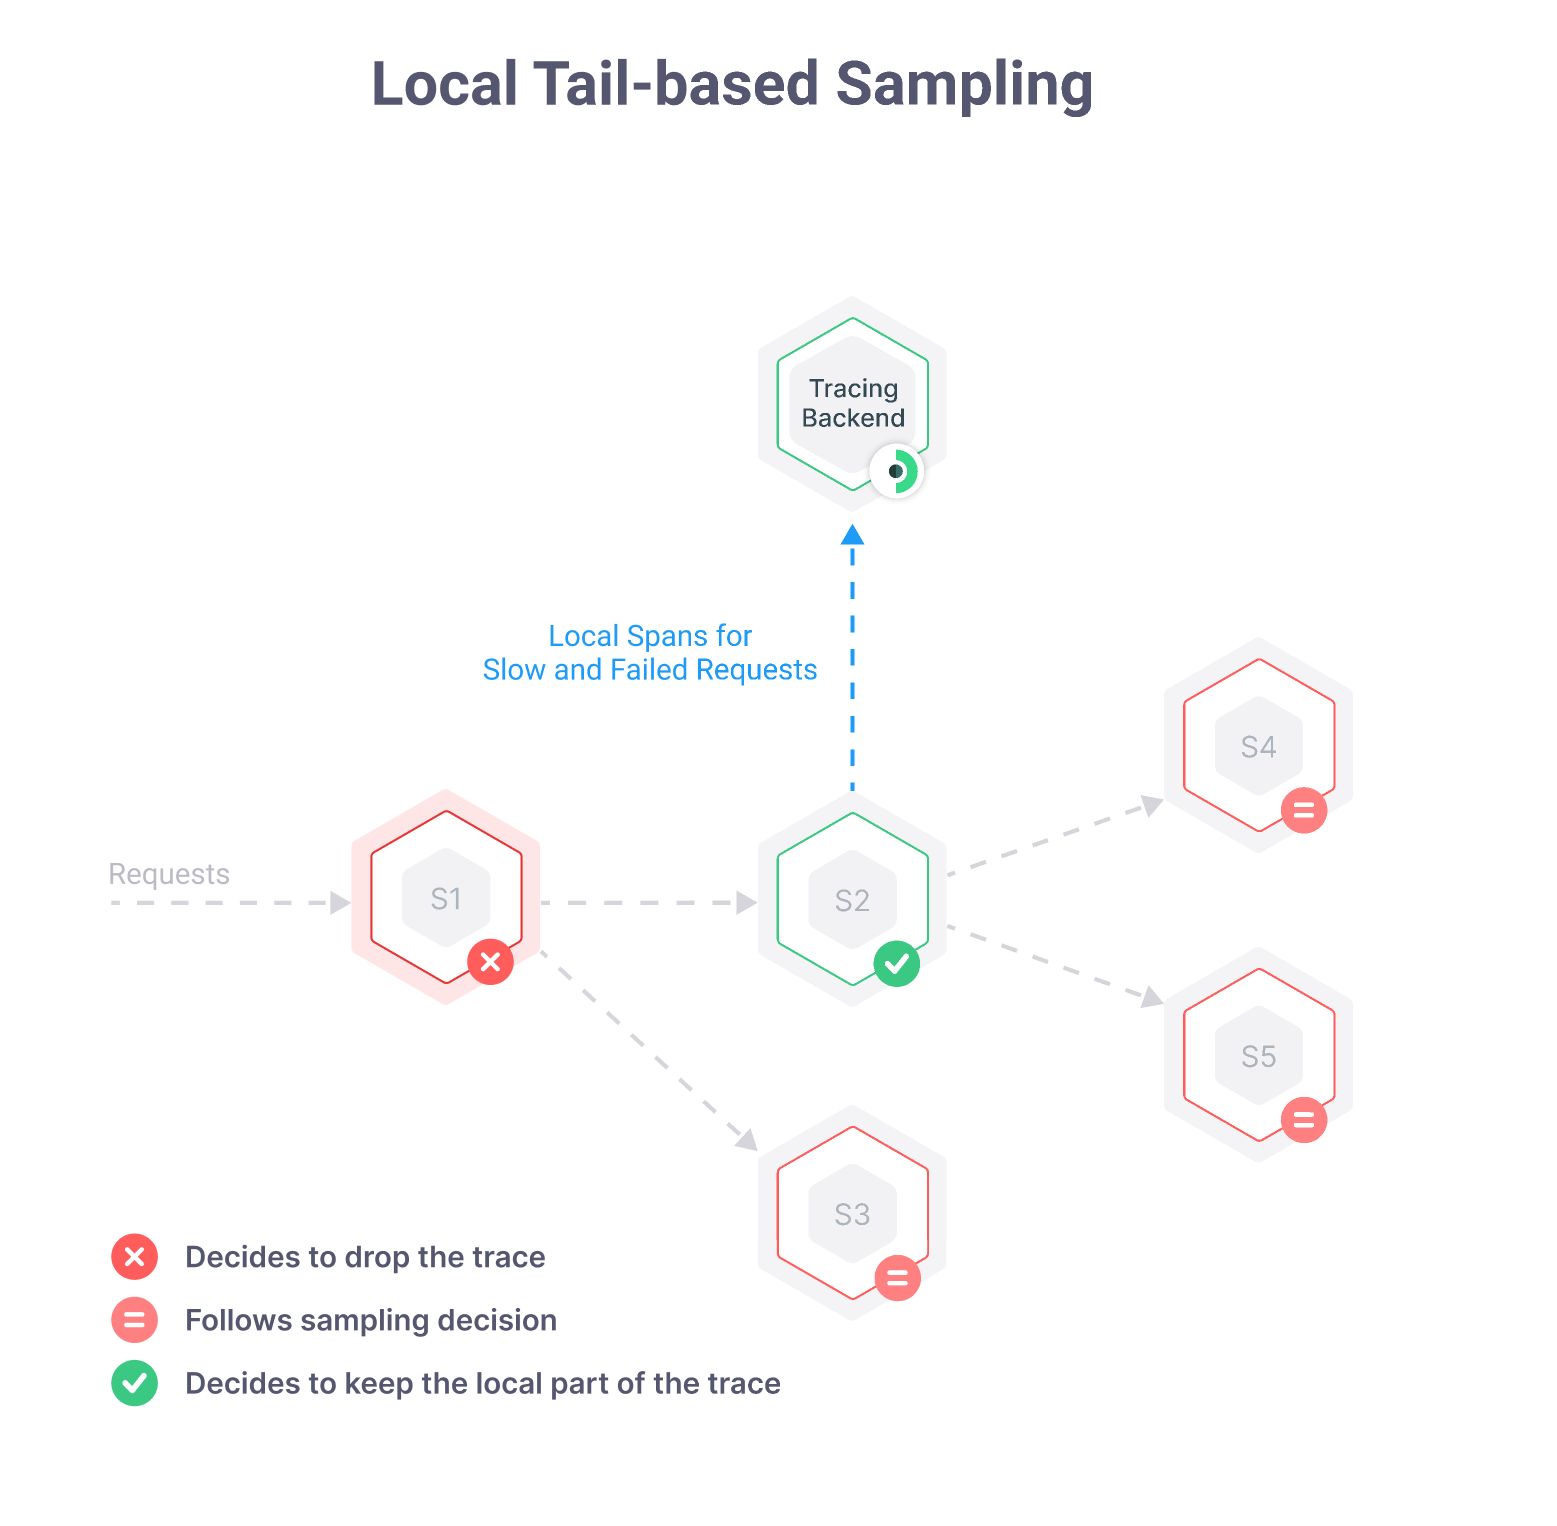
- When a request comes in, a new sampling decision is taken. This is the same old sampling behavior we described at the top of this article
- Processing happens as usual, and the already-taken sampling decision is propagated to other services as necessary. But, under the hood, Kamon Telemetry is keep all the information for all Spans, even if the decision was not to sample the request
- When the request processing finishes, Kamon Telemetry decides whether to override the sampling decision or not based on a latency and error count threshold
At the end you will get a random sample of all traces as usual, and in addition to that, traces for all requests that meet the minimum latency and error count thresholds.
In comparison to the traditional tail-based sampling, there will still be a CPU and memory overhead in your applications, but the network overhead is reduced and you won’t need to manage a separate process to do tail sampling. All while still making sure you get traces for slow and failed requests when they happen.
Local Tail Sampling in Distributed Systems
We designed local tail sampling as an addition to the traditional sampling behavior, so that if you have a system with 5 services and only one of them is doing local tail sampling, it will not affect the other services in any way.
The one notable compromise is that when a sampling decision is overridden to keep a trace, it can only happen locally. This means that you will end up with partial traces every time the local tail sampler overrides a sampling decision.
It is a shame to end up with partial traces for some requests, but a partial trace for an interesting request is better than no trace at all. Besides, there are two ways to mitigate this shortcoming:
- Enabling the local tail sampler in more than one service. This can be useful because if a request got slow or failed in one service, it will probably affect the upstream/downstream services as well. Enabling the tail sampler in several services is likely going to help with getting fuller traces at the end
- Logs! If you are correlating logs with trace ids, then you could find additional information in your logs to complete the missing parts of the story
This is not perfect, but it can help a lot without making any infrastructure changes in your system.
Enabling Local Tail Sampling in Kamon 2.4.0
After you upgrade to Kamon 2.4.0, there will be three new configuration settings under kamon.trace.local-tail-sampler:
- enabled (default: no). Sets whether to the local tail sampler is enabled or not
- error-count-threshold (default: 1). Sets how many failed local spans must happen in a trace for it to be sampled
- latency-threshold (default: 1 seconds). Sets the minimum latency threshold for the local root span that causes a trace to be sampled
There is one more setting you must take into account: kamon.trace.span-reporting-delay. This setting decides for how
long to keep finished spans in memory, just in case the tail sampler decides to override the sampling decision and keep
the entire trace.
Putting it all together, these are the settings you need to get local tail sampling up and running:
kamon.trace {
  span-reporting-delay = 20 seconds

  local-tail-sampler {
    enabled = yes
    error-count-threshold = 1
    latency-threshold = 1 second
  }
}
This first implementation only allows to capture traces based on error counts and a latency threshold, but a lot more could be done here. Come over to our Discord Community if you want to discuss your specific use cases in more detail or just share your experience with Kamon Telemetry’s local tail sampler.
Have fun!