The Simple Observability Tool
that Modern Developers Need
Point and click to find the endpoints, database queries,
and API calls that affect your user's experience
Drill down to the specific actions that affect response times
You noticed that something caught fire, now what? Your dashboards and alerts will tell you that something is wrong, and your traces will help you figure out exactly what it is
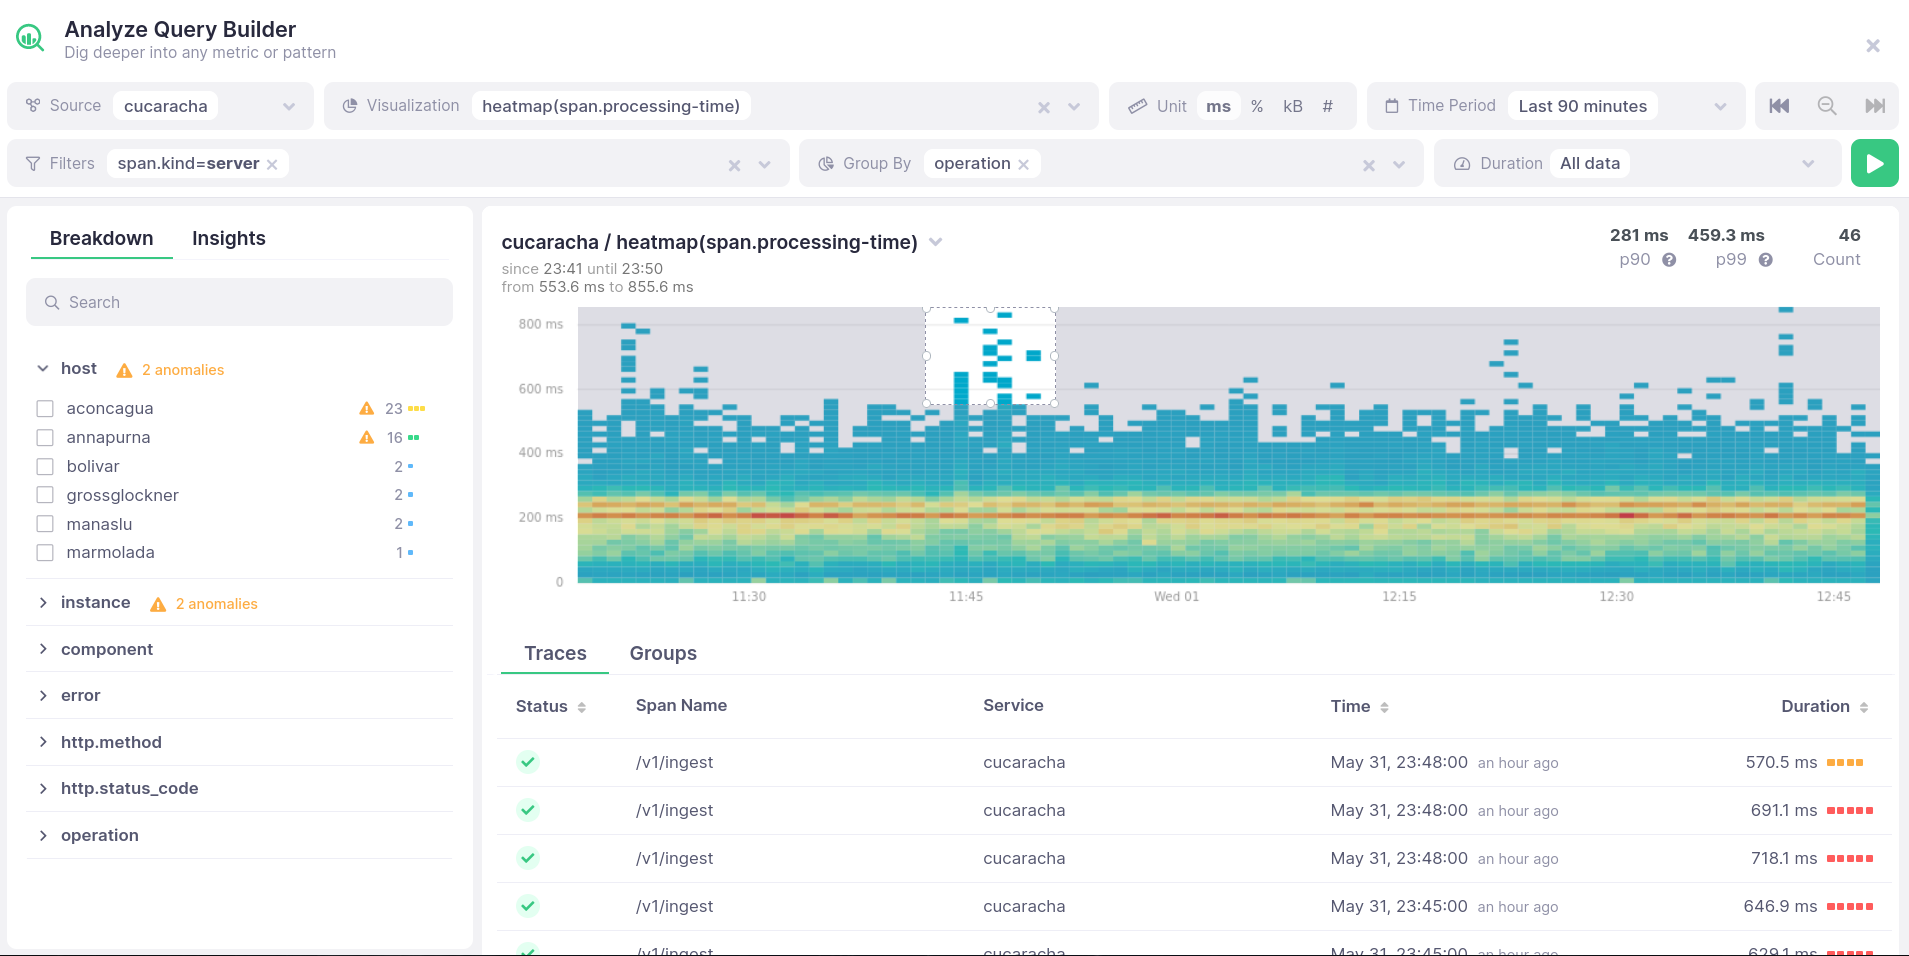
Find the traces connected to high response times and errors
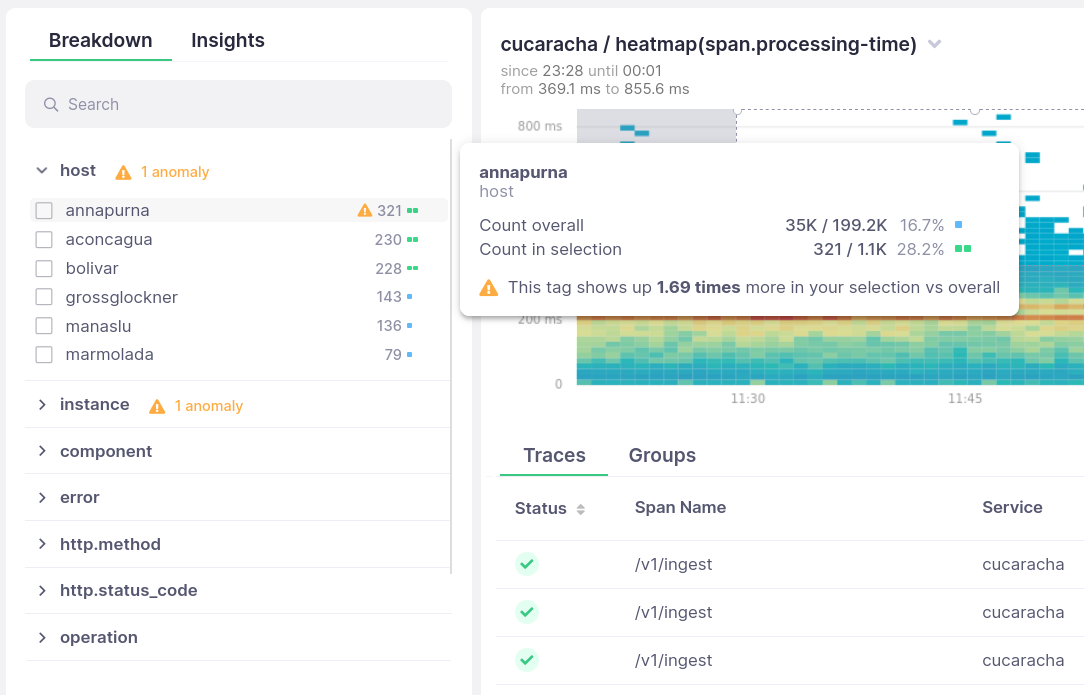
When there is a weird pattern in a chart or alert notification, you need to slice & dice metrics and traces to figure out what happened there
Select latency spikes and errors in a chart, and get all the traces connected with it. Then follow the trail to narrow it down with filters and groupings
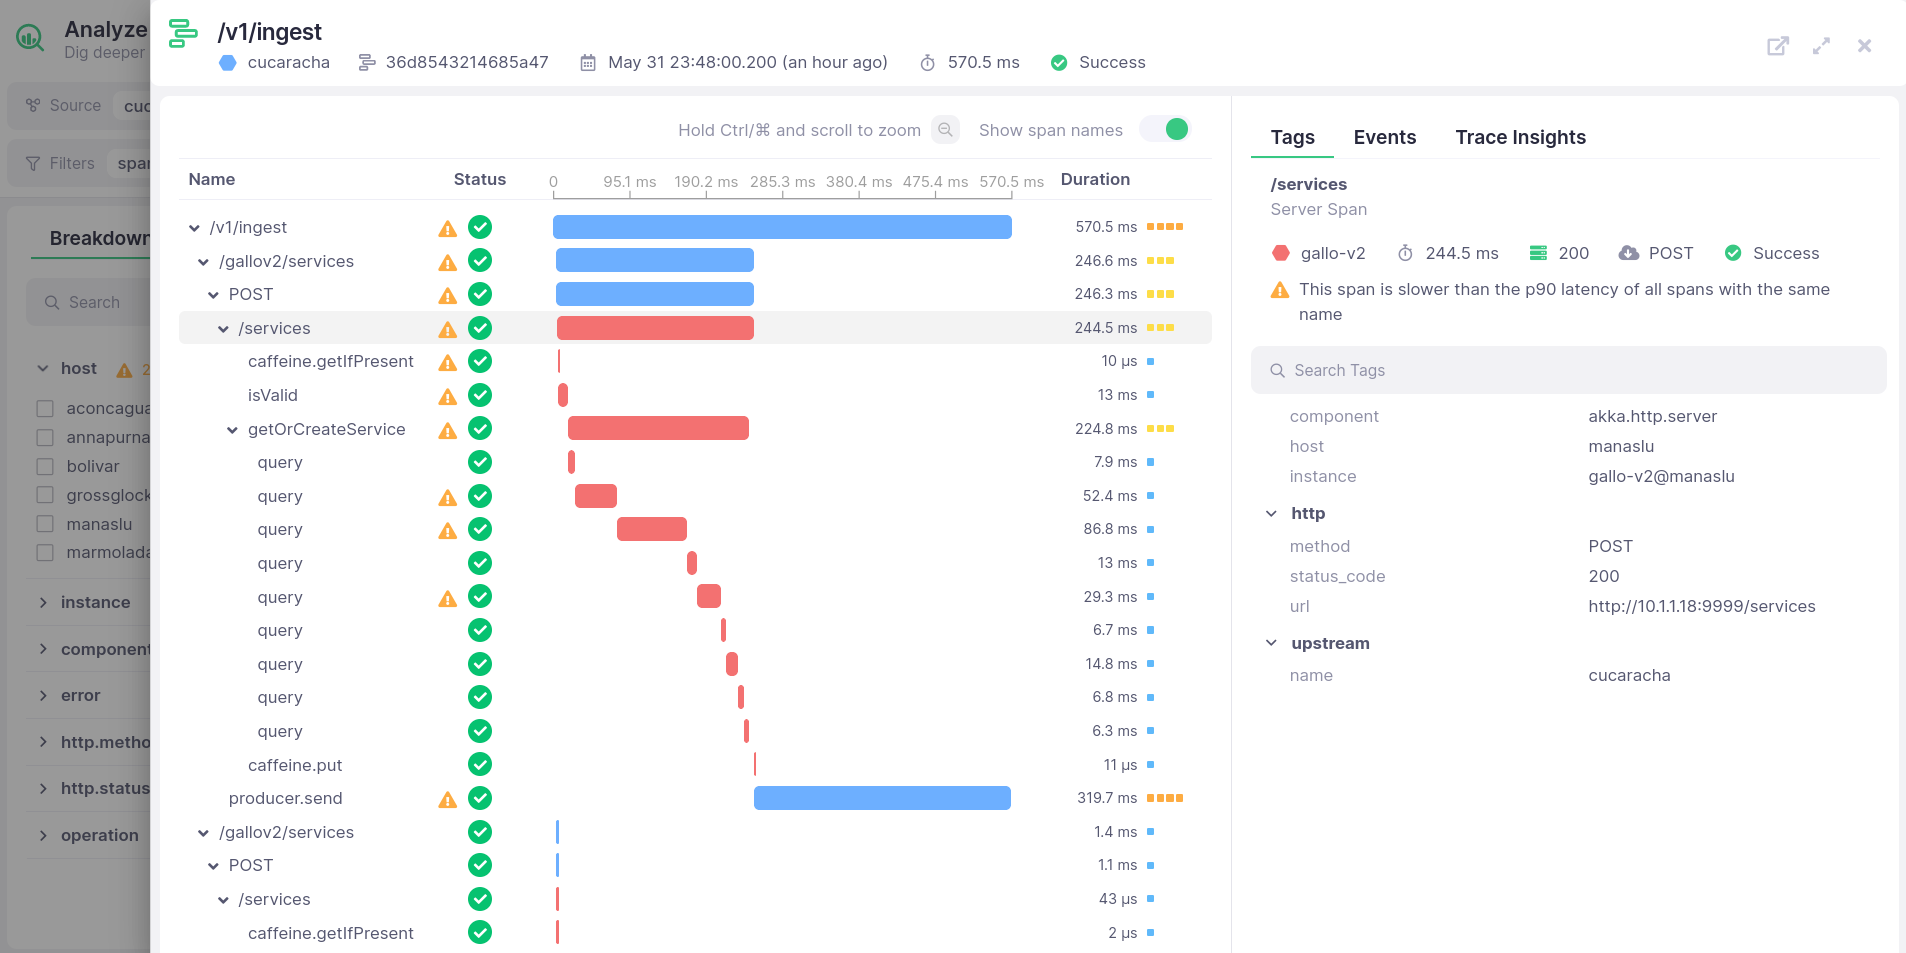
See the full picture, from your HTTP endpoint to the database
More often than not, latency and errors are caused by a slow database query or API call
See the full picture for every request, from the HTTP request hitting your endpoint, to upstream services, databases, and external APIs.
Deploy new features and fixes with confidence
Deploying a fix or new feature is not the end of the story. How do you know the issue was really fixed, or that you didn’t mess something up with the new deployment?
Compare behavior across deployments
Ensure that response times stay healthy and errors are gone after deploying your fixes
Break down any metric by deployment version and compare behaviors to discover anomalies
Test before deploying. Who would have thought?
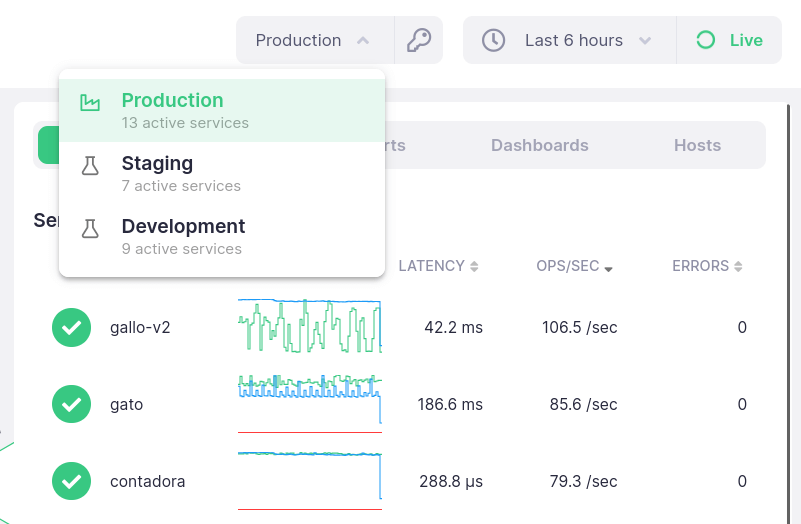
Production and staging are never the same, but you can catch a bunch of dumb mistakes before going to prod
Monitor your development and staging environments with the same tools you in production, but free of charge
Be the first to know when things go wrong
It doesn’t matter how well-crafted your code is, slow requests and errors are going to happen. You better get ready to notice and fix them before your customers do
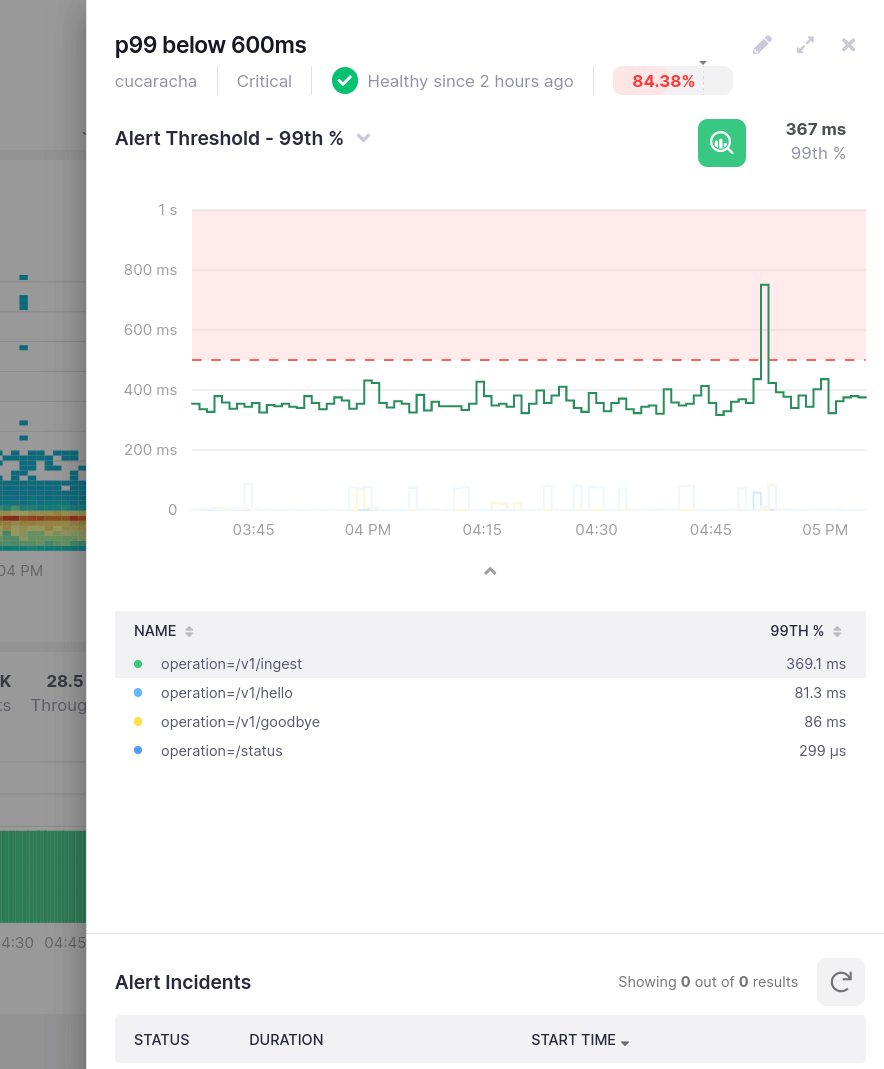
Get notifications when your backend slows down
Whether it is latency going up or a new deployment throwing errors like crazy, you want to be the first to know
Get notified on Slack, PagerDuty, or email and start fixing problems before your customers notice
See all the metrics you care about in one place
As time goes by, you will learn what metrics and thresholds are important to monitor in your platform
Bring all those metrics together with dashboards that tell you exactly what is going on (and look cool on a TV, too)

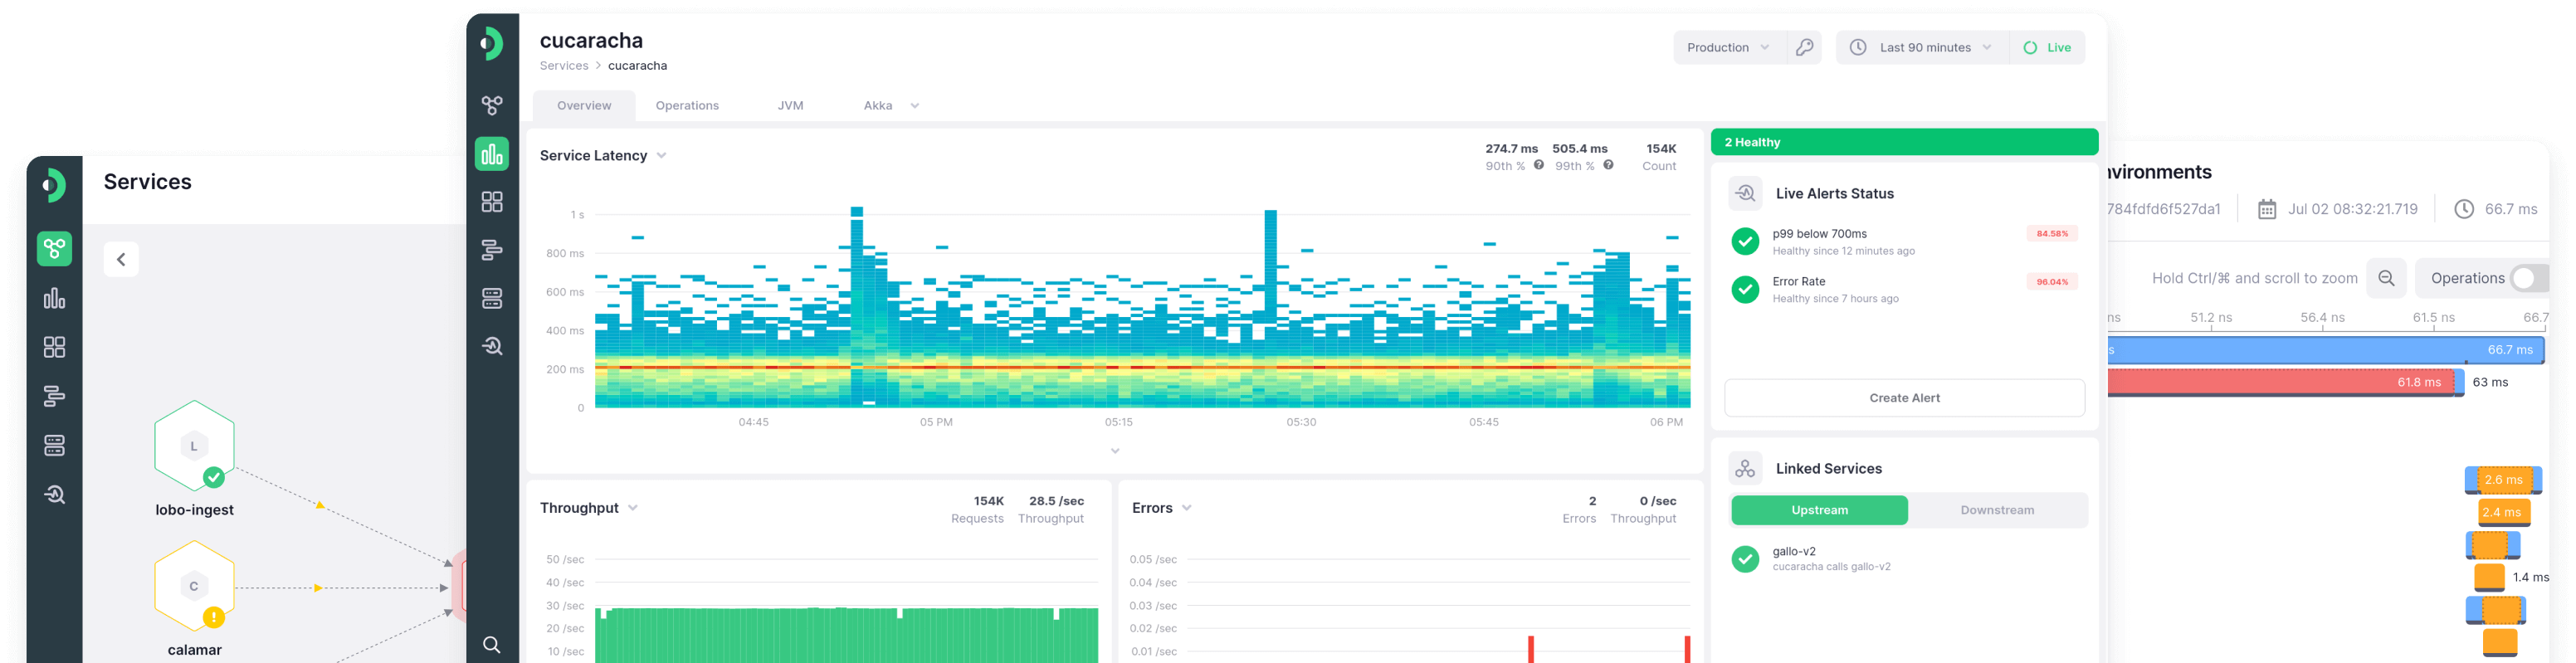
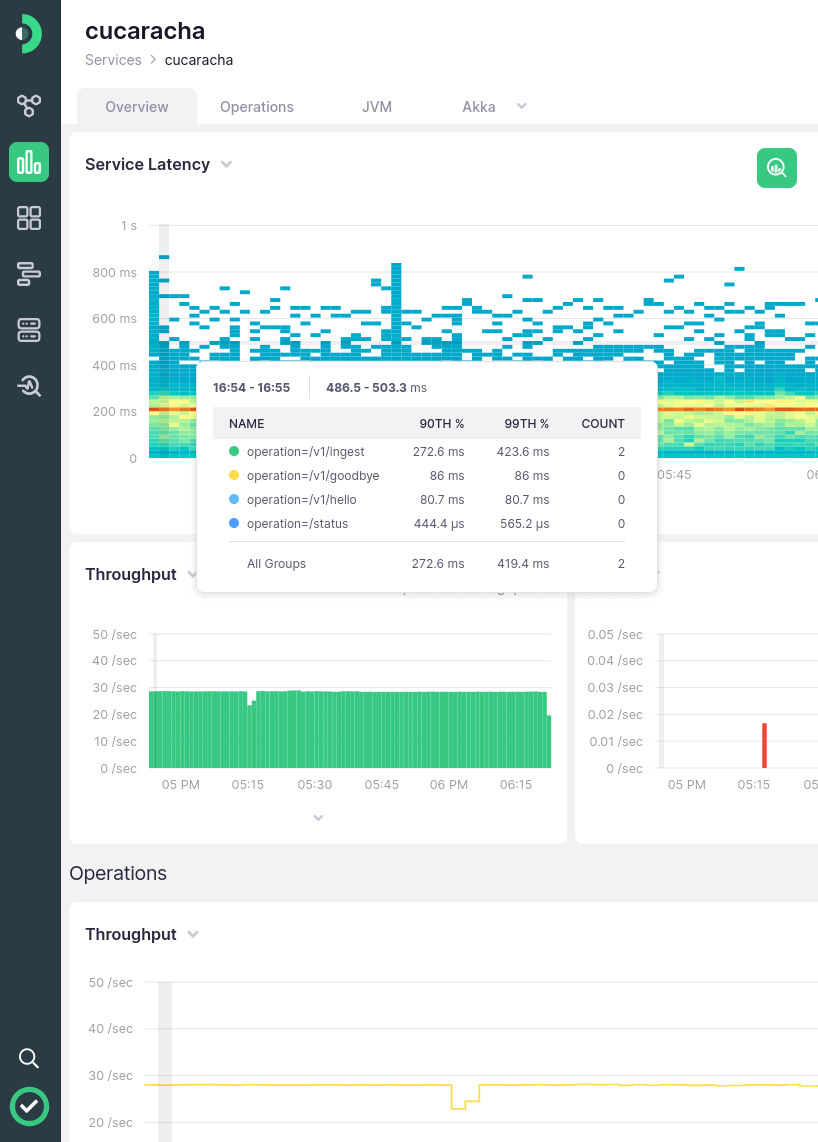
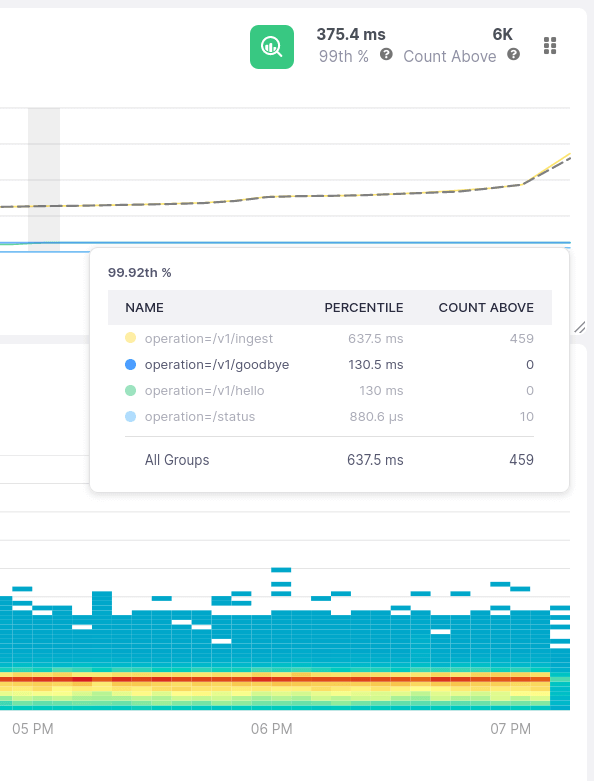
Monitor public endpoints and internal operations
Understanding how each of your service's operations behave is crucial to monitor and troubleshoot issues effectively
Get a complete view of your service endpoints and internal operations, along with alerts and linked services. All right out of the box
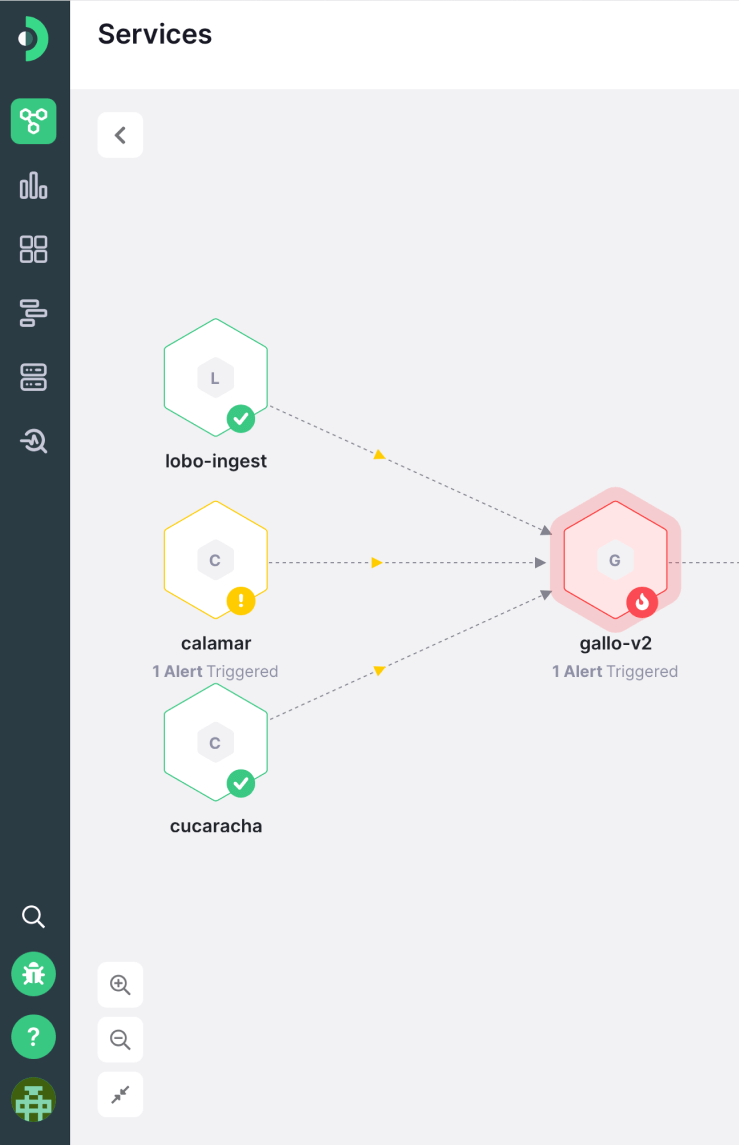
Get a bird's-eye view of your entire platform
When your backend starts getting complex, a failure in one service can bring down everything that touches it
Figure out inter-service dependencies and jump straight to the root cause of problems
Work with the real data, not an approximation of it
If you are averaging or interpolating percentiles, you are doing it wrong
Go for high-fidelity metrics with a fixed 1% error margin and forget about chasing false signals
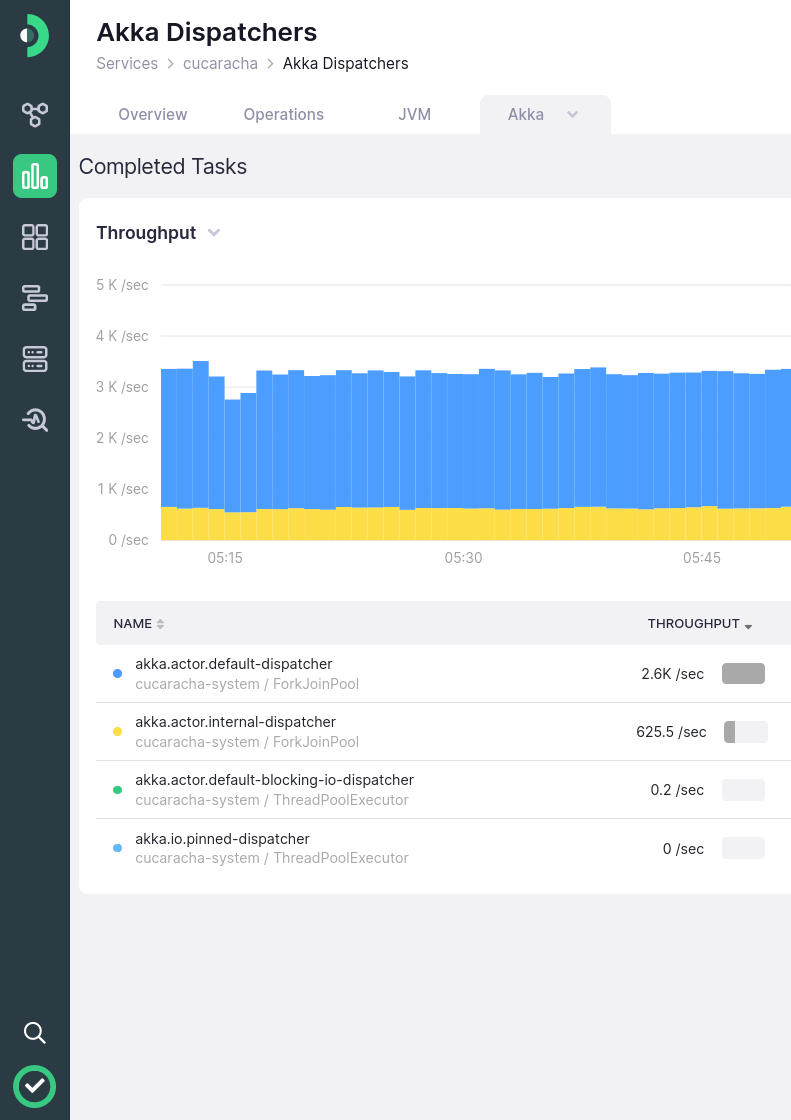
Don’t waste time figuring out where to start
We put tons of effort in figuring out what’s the best way to visualize metrics from Services, Hosts, and things like the JVM, JDBC, and Akka. So you don’t have to
Integrate your services with Kamon APM and let it organize the data for you