-
Installation
-
With Kamon Telemetry
-
How To Guides
-
Migrations
-
-
Core Concepts
-
Foundations
-
Advanced
-
-
Instrumentation
-
Supported Frameworks
-
Akka
-
Akka HTTP
-
Cassandra Driver
-
Caffeine
-
Elasticsearch
-
Executors
-
Futures
-
JDBC
-
Kafka
-
Logback
-
Play Framework
-
Spring Framework
-
System Metrics
-
-
-
Reporters
-
Kamon APM
-
Using Kamon APM
-
Overview
-
Services
-
Traces
-
Dashboards
-
Alerts
-
Hosts
-
Investigating Issues
-
Settings and Administration
-
-
Akka Integrations #
Kamon APM offers a number of built-in integrations for services running Akka, allowing you to easily deep-dive into your actor systems. The particular services will depend on the features your application is using and, in the case of per-actor metrics, configuration. All available Akka integrations can be accessed from the service overview, using the Akka dropdown tab in the top of the page.
![]()
All Akka integration dashboards are a feature exclusive to Kamon Telemetry. If you use OpenTelemetry with a service using Akka, you will not have access to these dashboards.
Akka Actor System Dashboards #
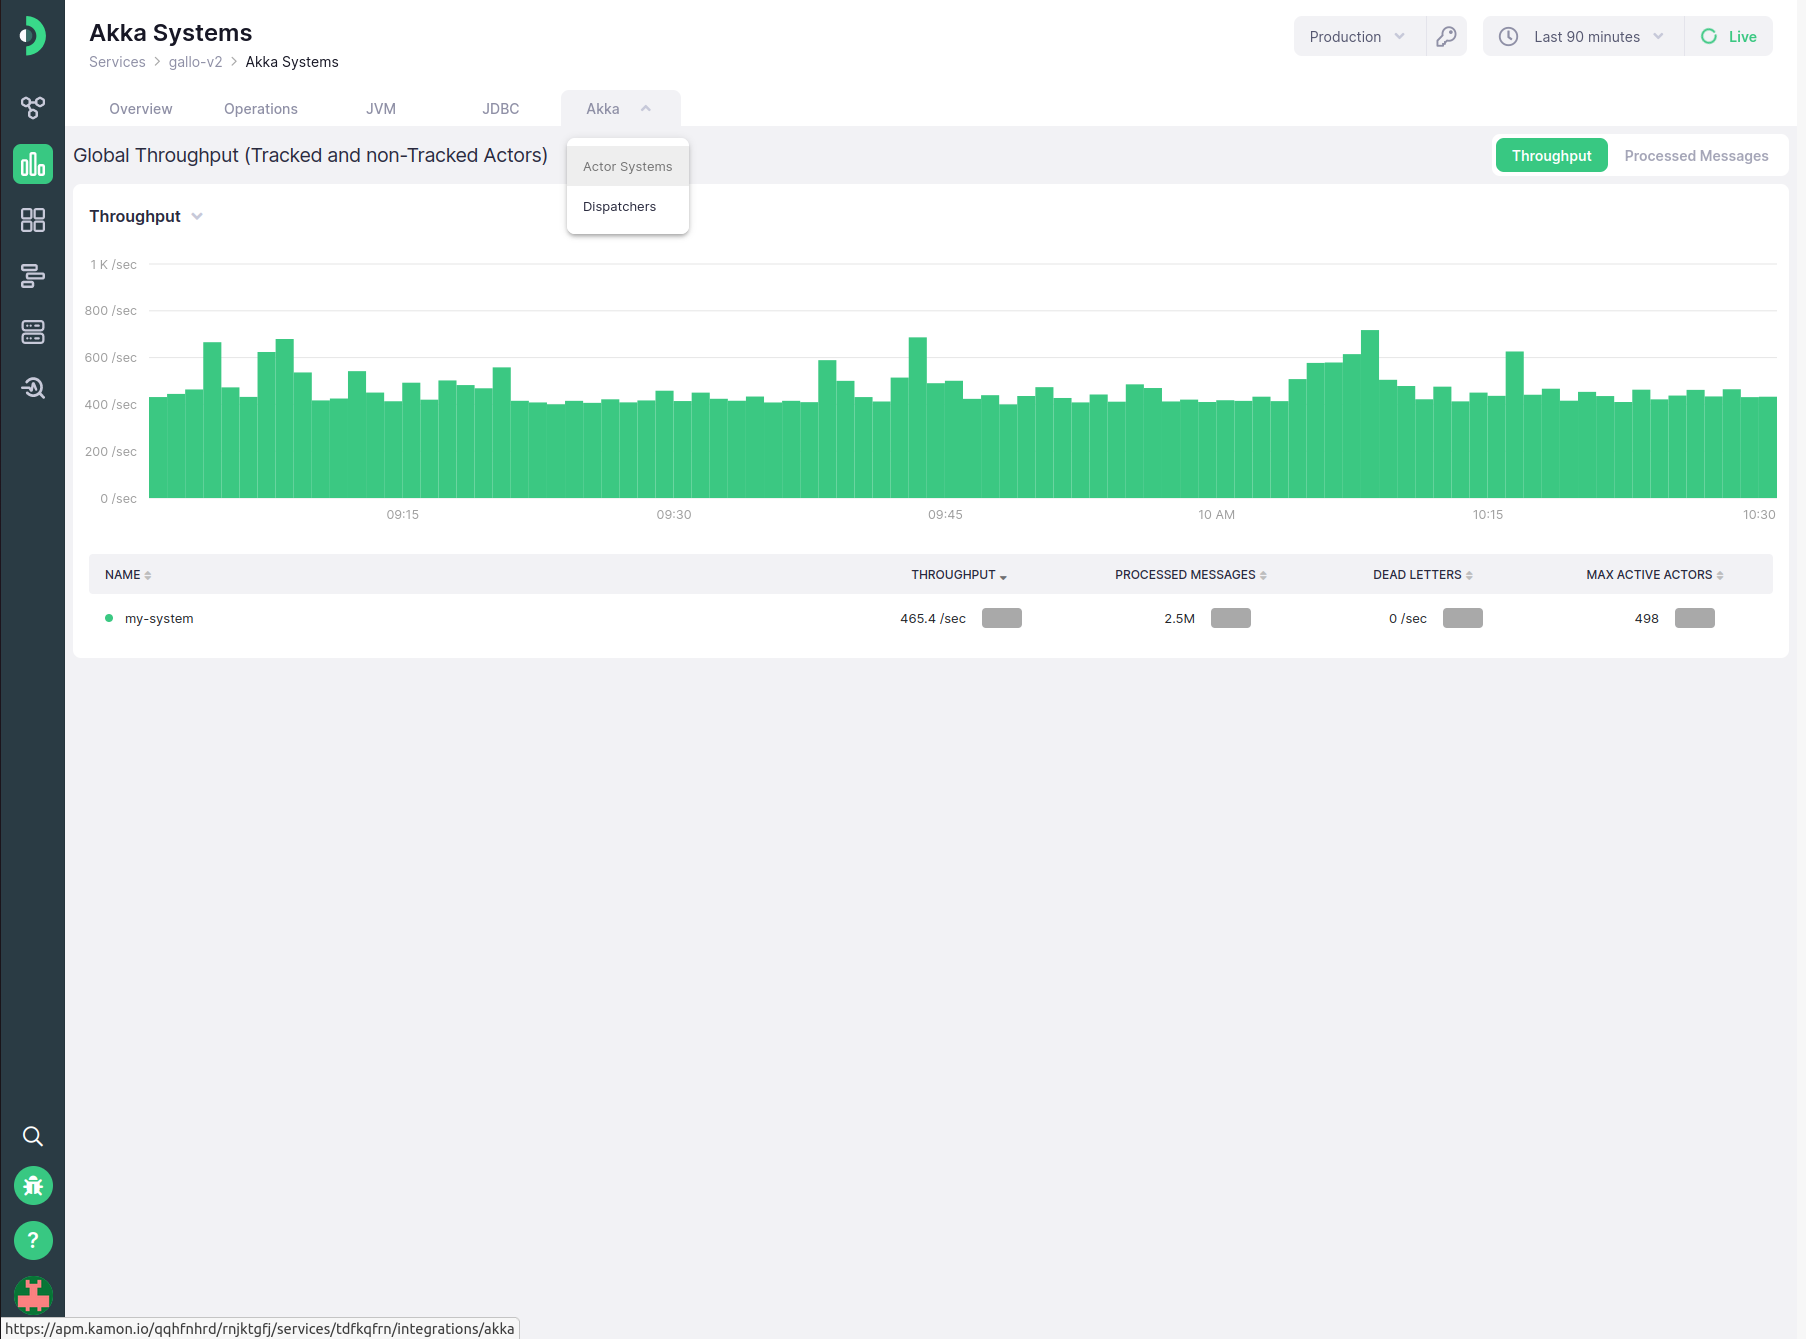
Kamon will collect the actor system metrics from inside of your Akka application, and display them in a handy aggregation summary chart. You can see your message throughput or count, grouped per actor system, as well as the number of dead letters (messages that were not delivered) and the maximum number of active actors in the time period. Actor systems will be automatically identified by the Kamon instrumentation. Clicking on any of the table rows will take you the per-system details page.
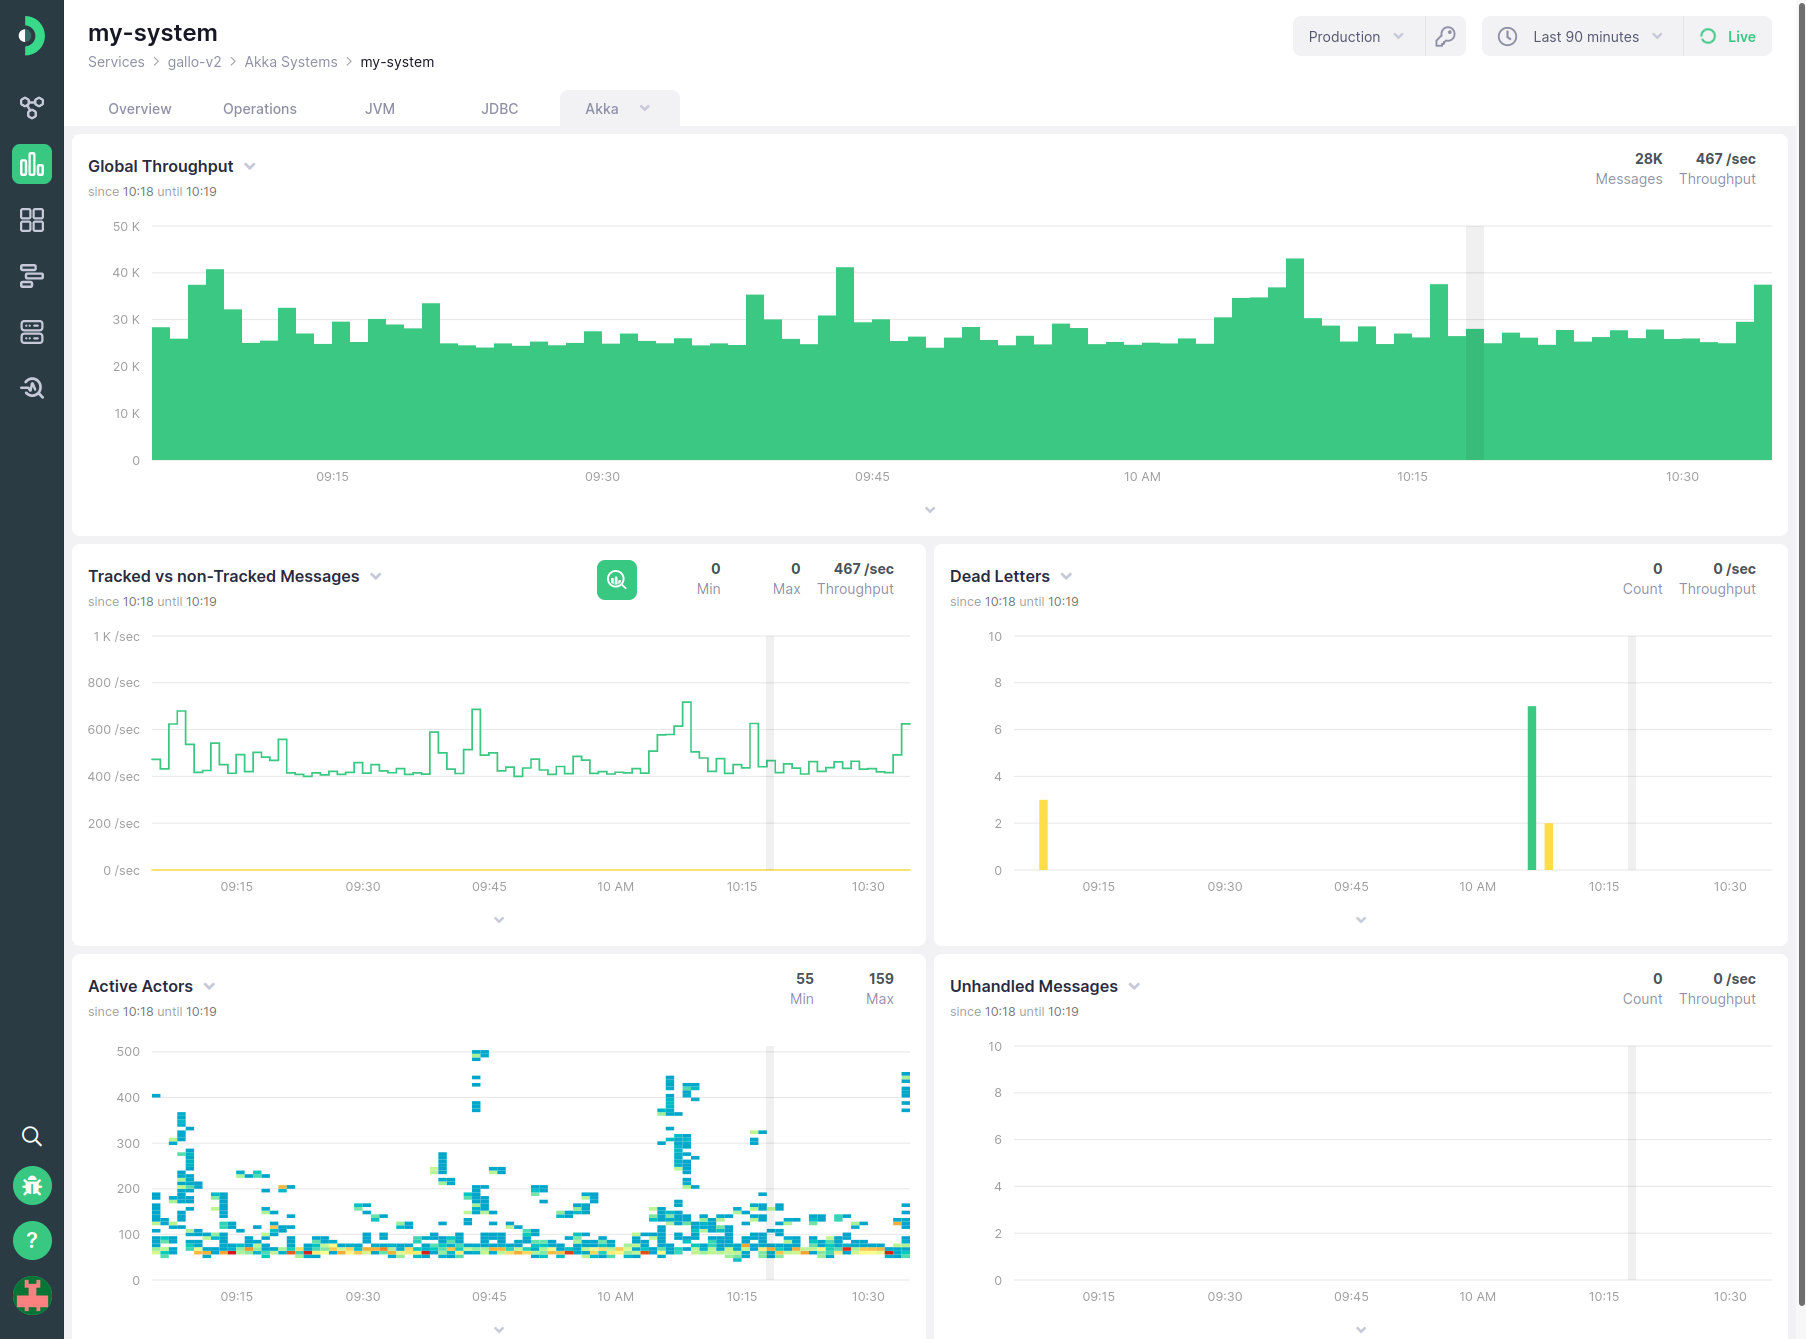
This page will show the same general metrics, but in a chart format which can then be used as a starting point for a deeper analysis and investigation. Namely, throughput of messages, the number of tracked versus untracked messages, the number of dead letters, the distribution of active actors through time, and the number of unhandled messages will be shown.
Akka Actor Dashboards #
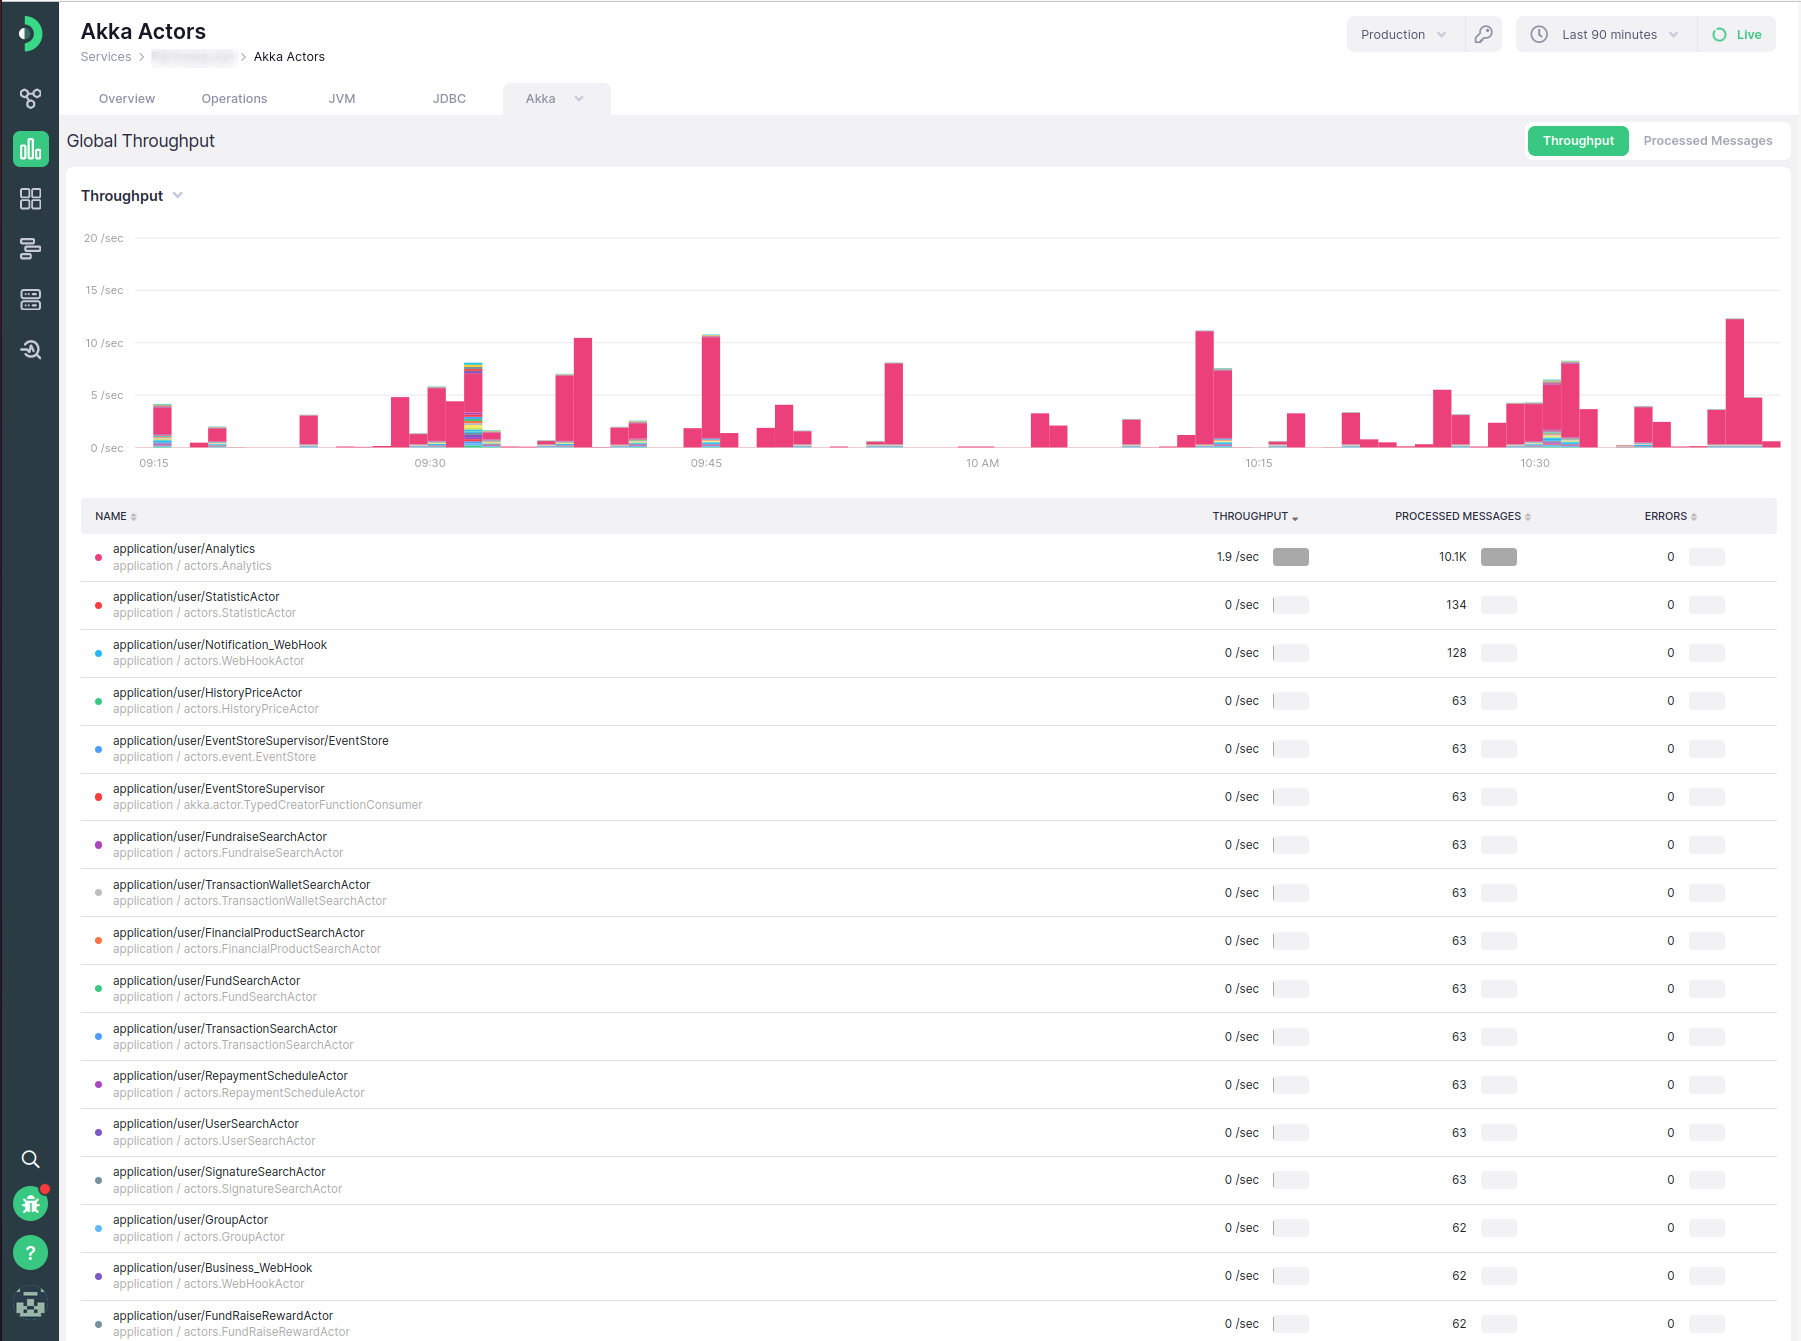
If actor metrics are enabled, Kamon APM will keep display information about them in the form of an aggregation summary chart. Message throughput, the number of processed messages, and the number of errors are tracked, with the first two being available in a chart visualization. All of them can be sorted in the table, and hovering on any table row will highlight the corresponding entry in the chart. Clicking on any of the table rows will take you to the details page for that specific actor. In the first cell, the actor path will be shown in the first row, while the second row shows the actor’s Akka actor system, as well as the class which implements the actor.
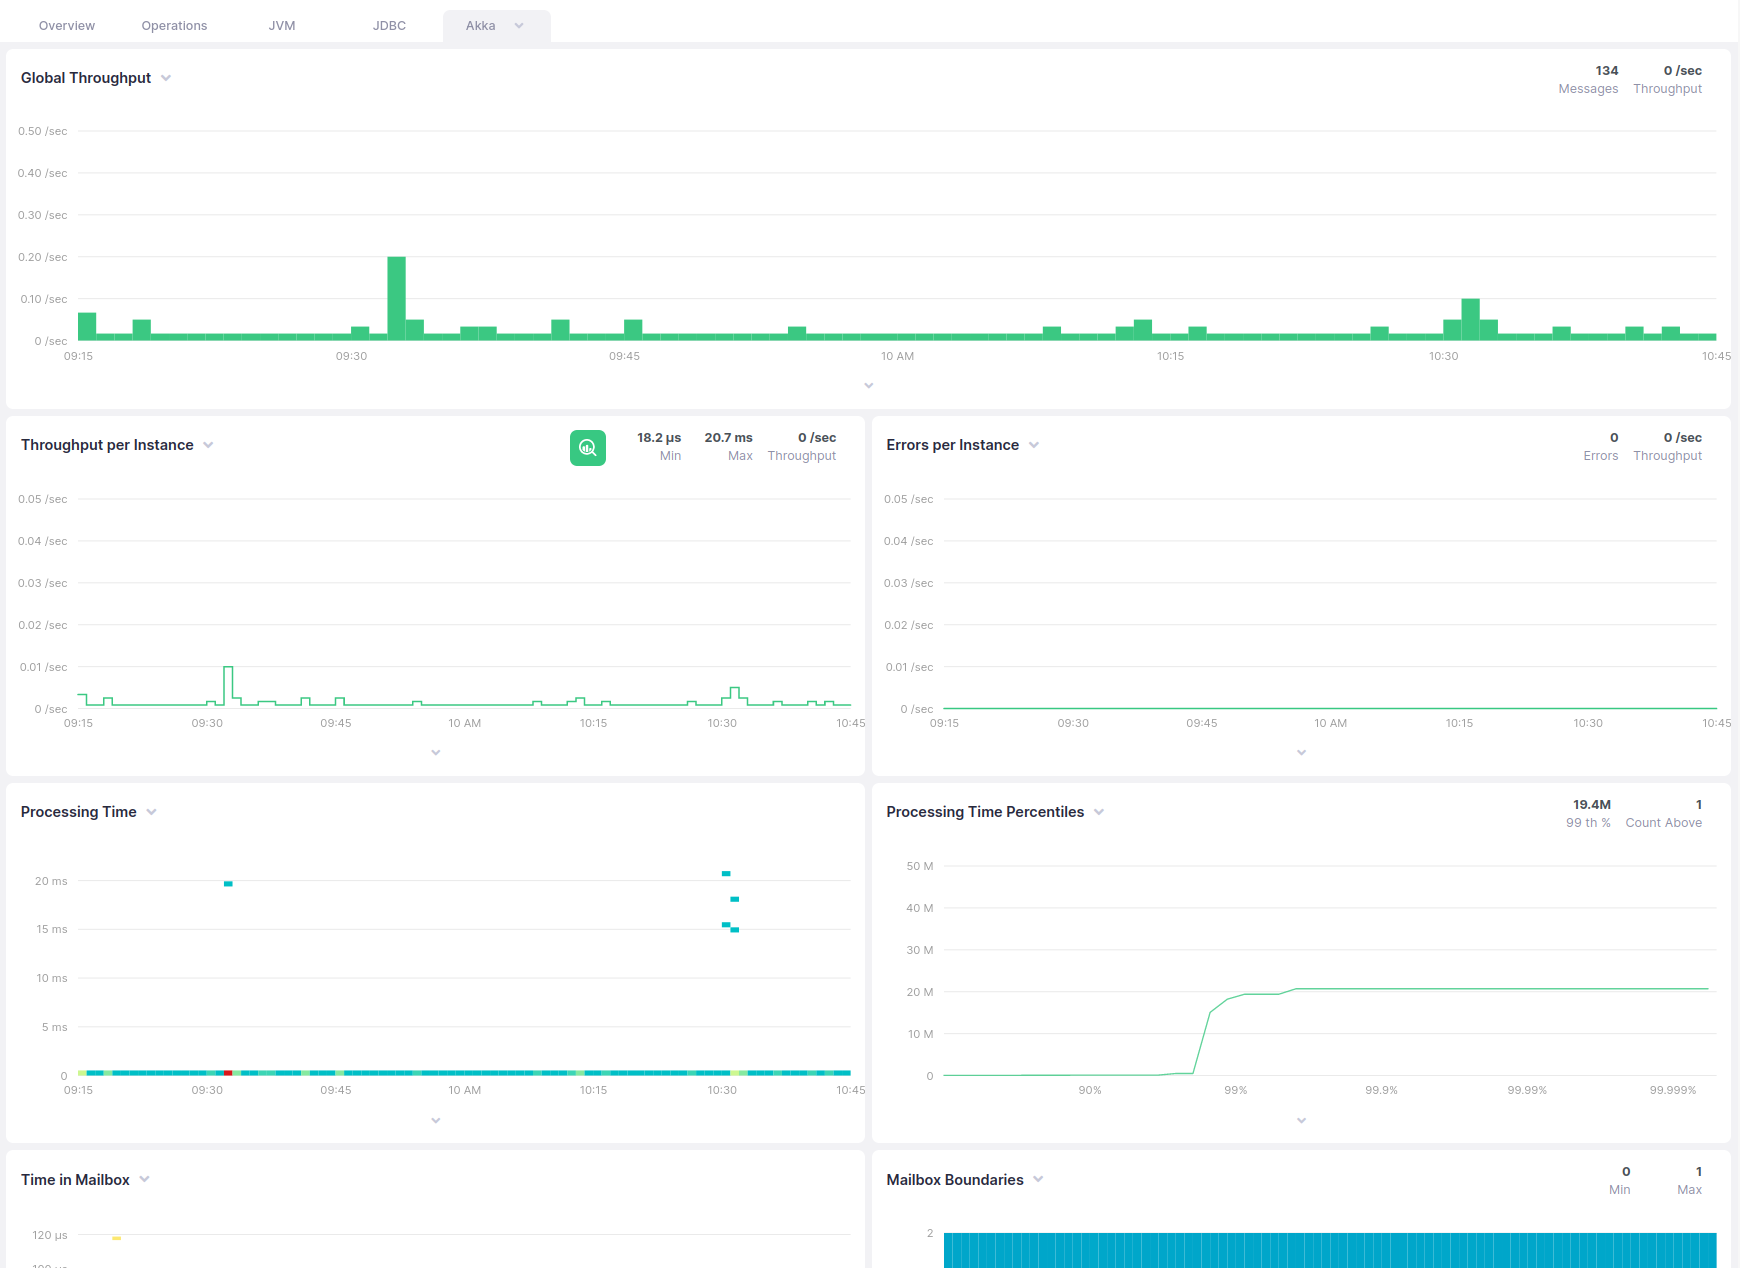
The details page will focus on a particular actor, and will show the following metrics as charts:
- Actor message throughput
- Actor throughput, per service instance
- Actor errors, as throughput, per service instance
- Actor message processing time distribution
- Actor message processing time percentiles chart
- Messages’ time in mailbox distribution
- Actor mailbox size distribution
![]()
Note that actor metrics require configuration and are not collected by default. This is due to the fact that you might hundreds or even thousands of actors in your system, and may not wish to instrument them by default.
Akka Actor Group Dashboards #
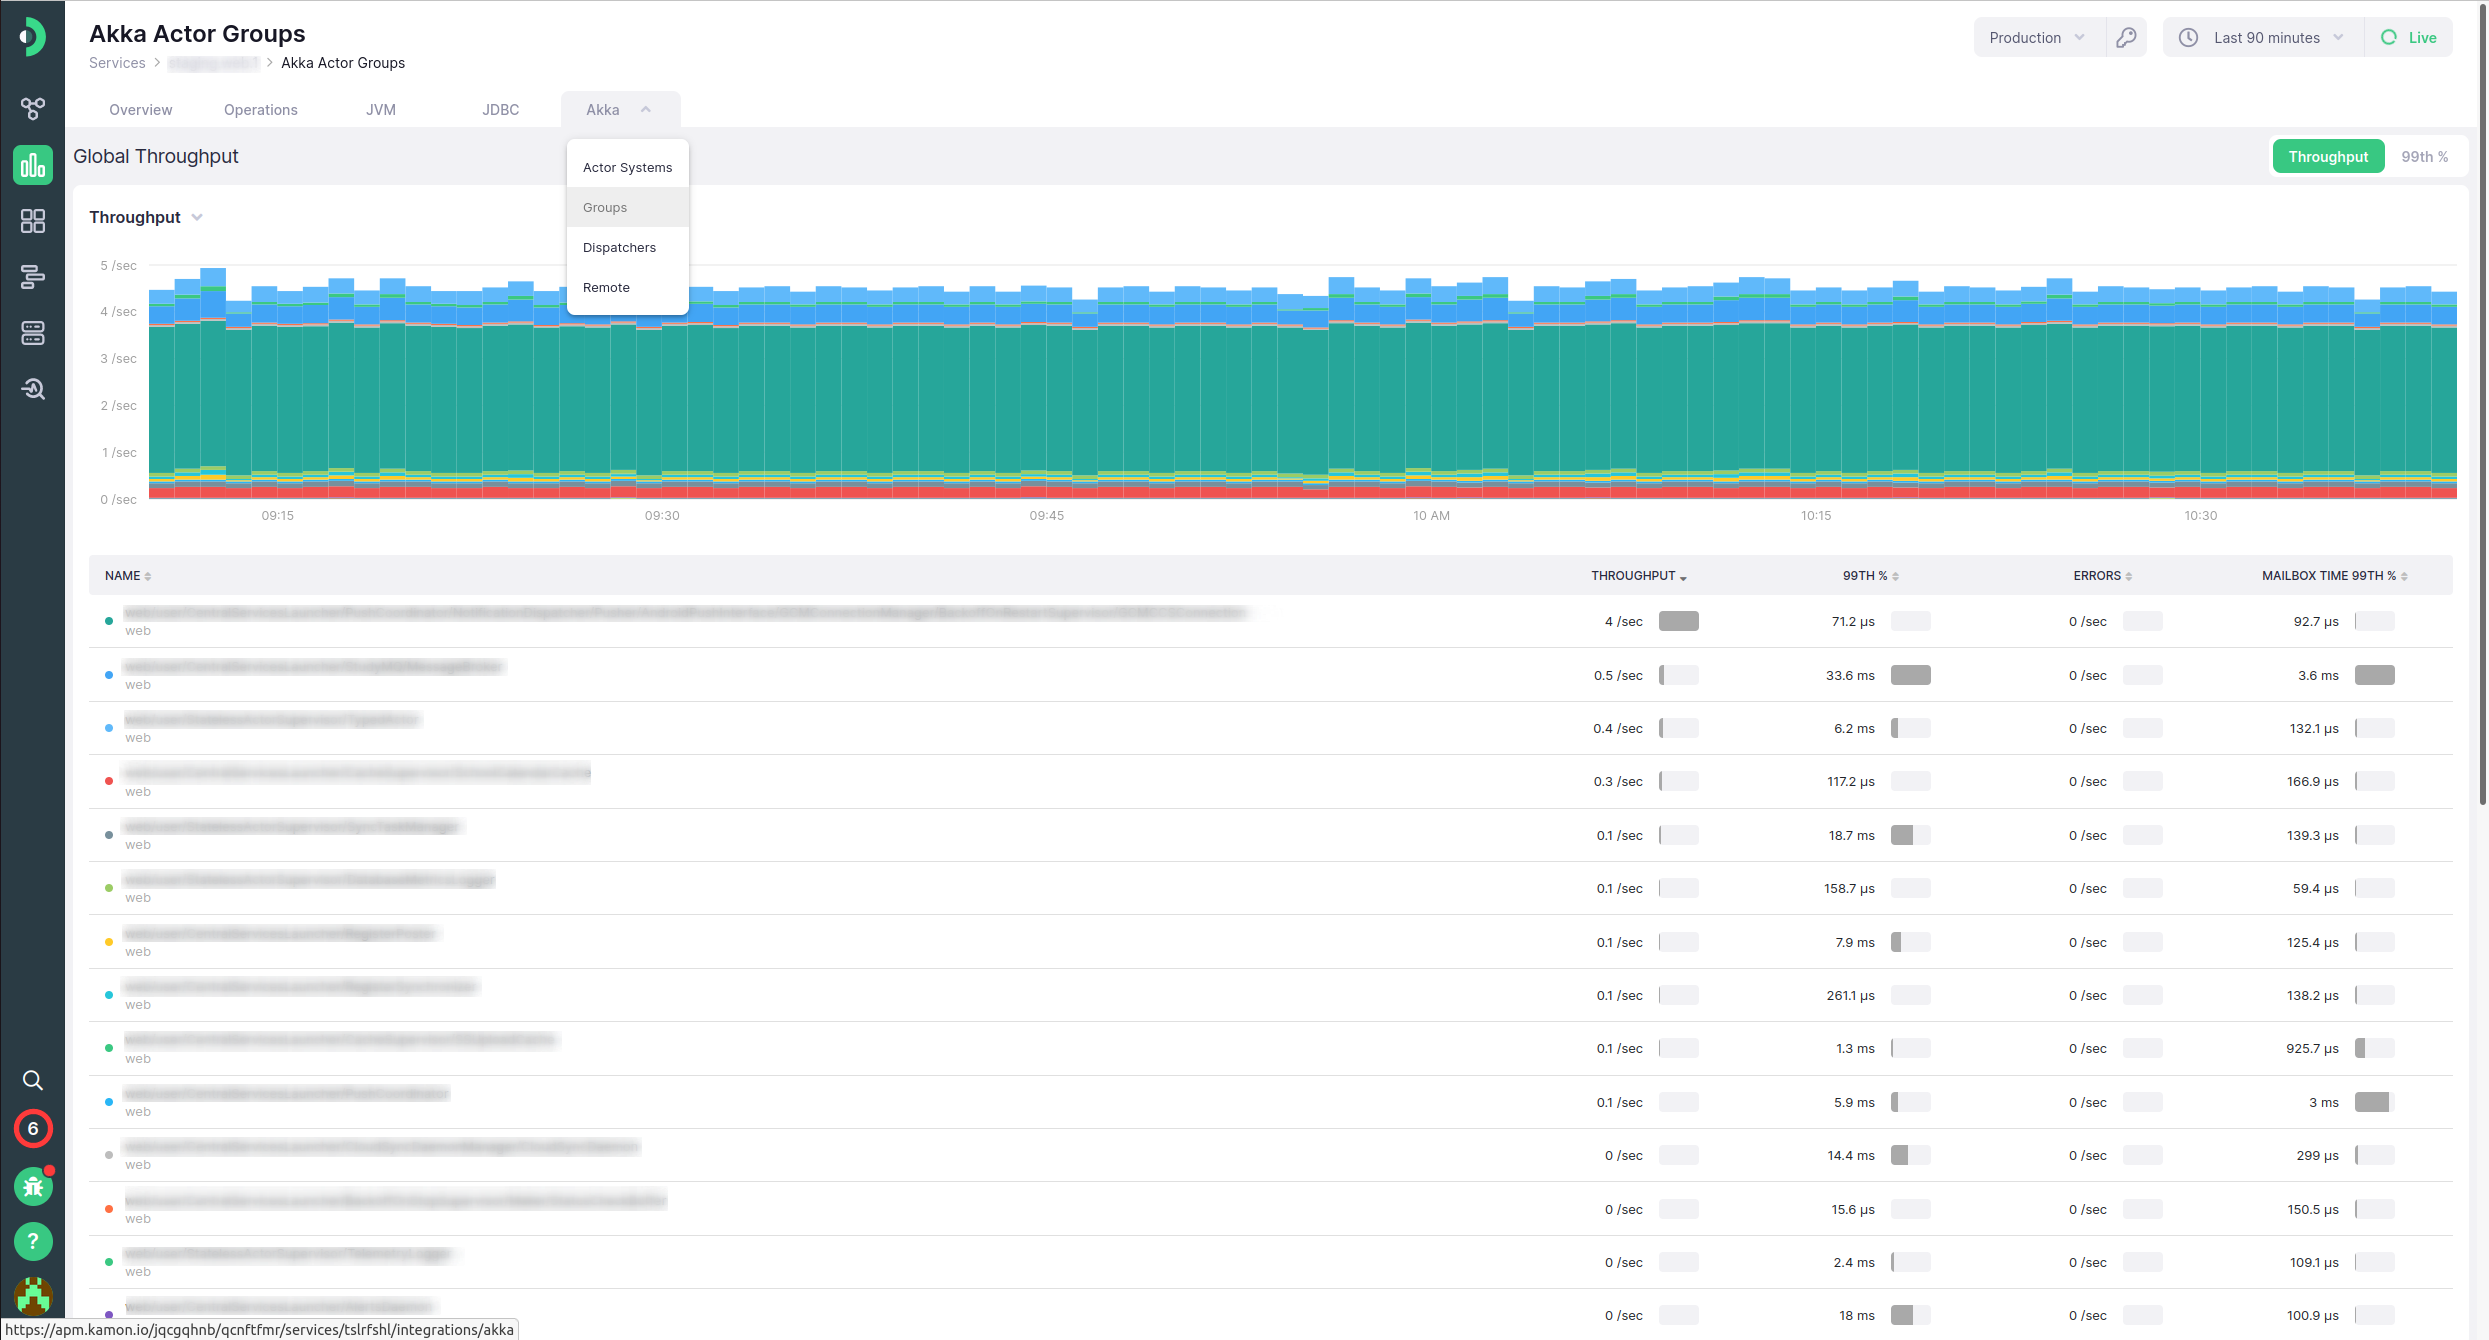
When using Kamon Telemetry and Kamon APM together, you will also have access to actor group metrics. As mentioned in the previous section, it is not always plausible to keep track of every actor, but with Kamon Telemetry, automatic or configuration-based grouping of actors into actor groups allows us to intelligently group and display useful metrics about your actors while still keeping the number of groups to a manageable level.
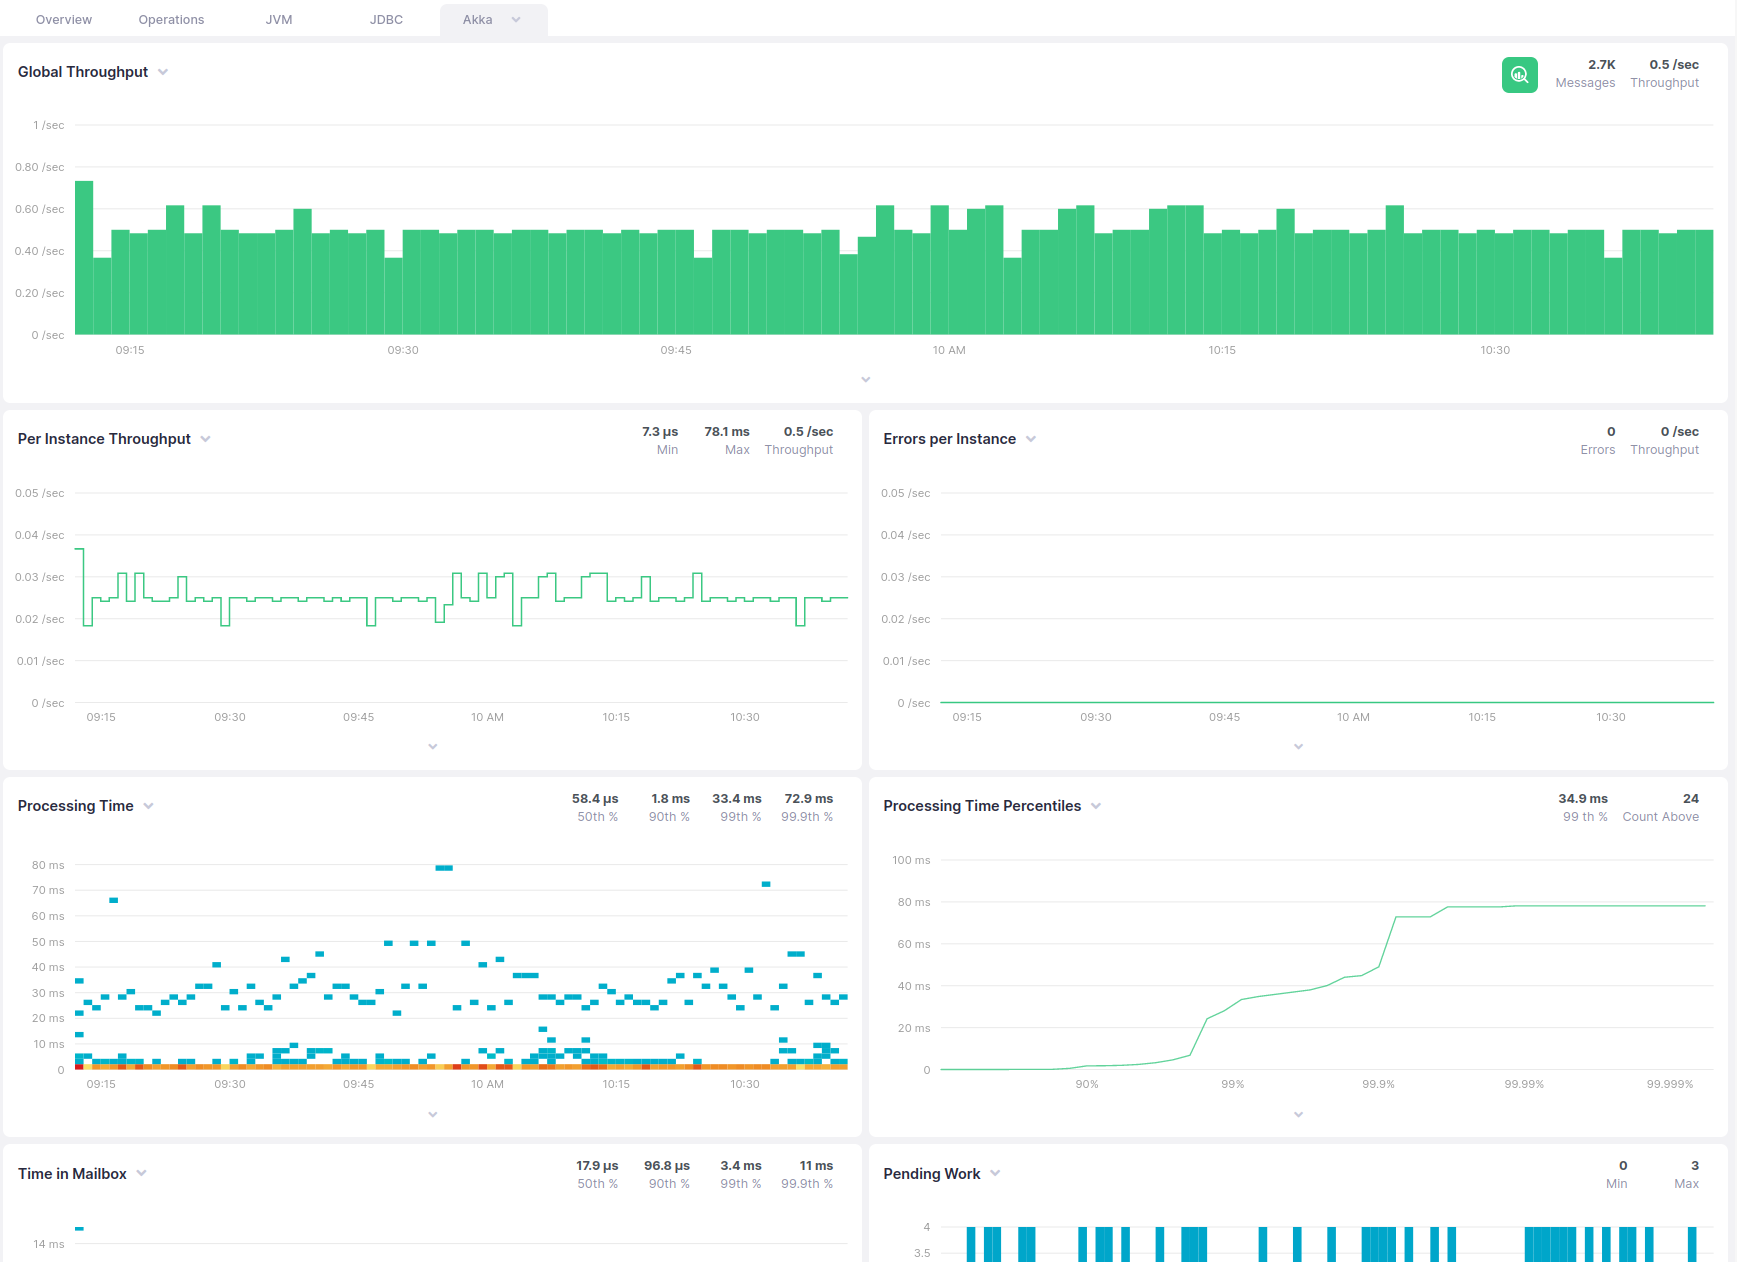
The details page will focus on a particular actor, and will show the following metrics as charts:
- Actor group message throughput
- Actor group throughput, per service instance
- Actor group errors, as throughput, per service instance
- Actor group message processing time distribution
- Actor group message processing time percentiles chart
- Messages’ time in mailbox distribution
- Pending work gauge
Akka Dispatcher Dashboards #
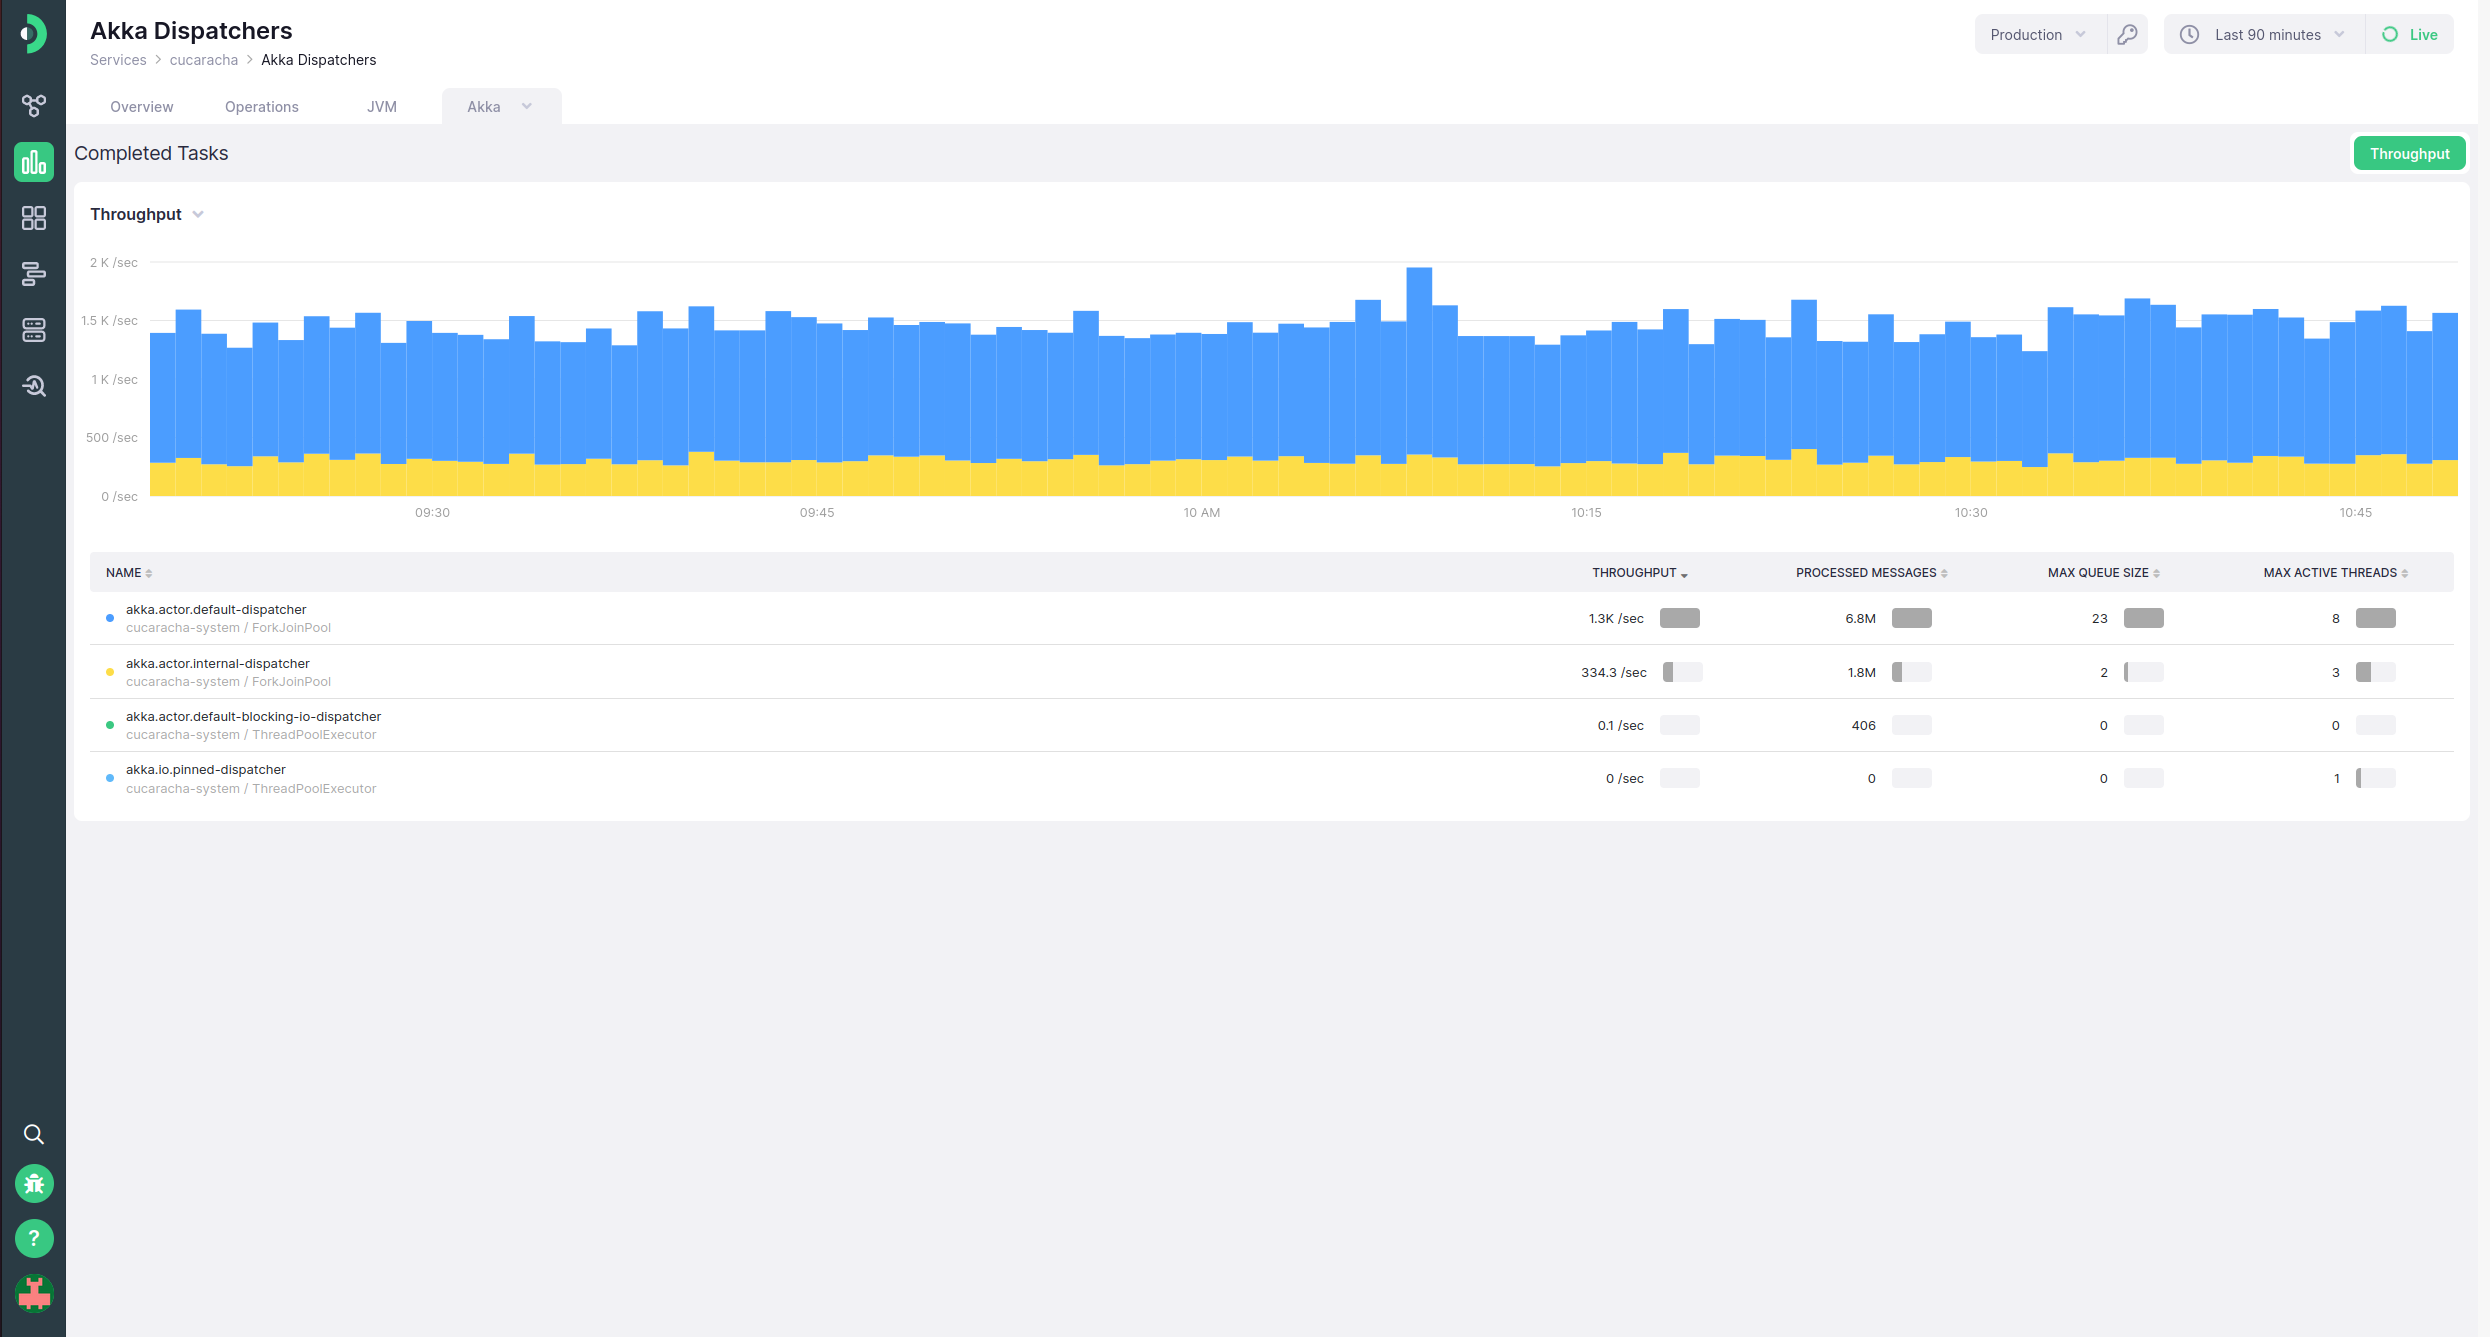
Kamon APM will automatically detect Akka Dispatchers used in your application, and will show an integration tab for the dispatcher metrics. An overview page will show an aggregation summary chart, with throughput, number of processed messages, maximum recorded queue size, and maximum number of active threads, grouped per dispatcher. Each entry will show not only the dispatcher name, but also display (and be grouped by) the Akka actor system, and the thread pool type.
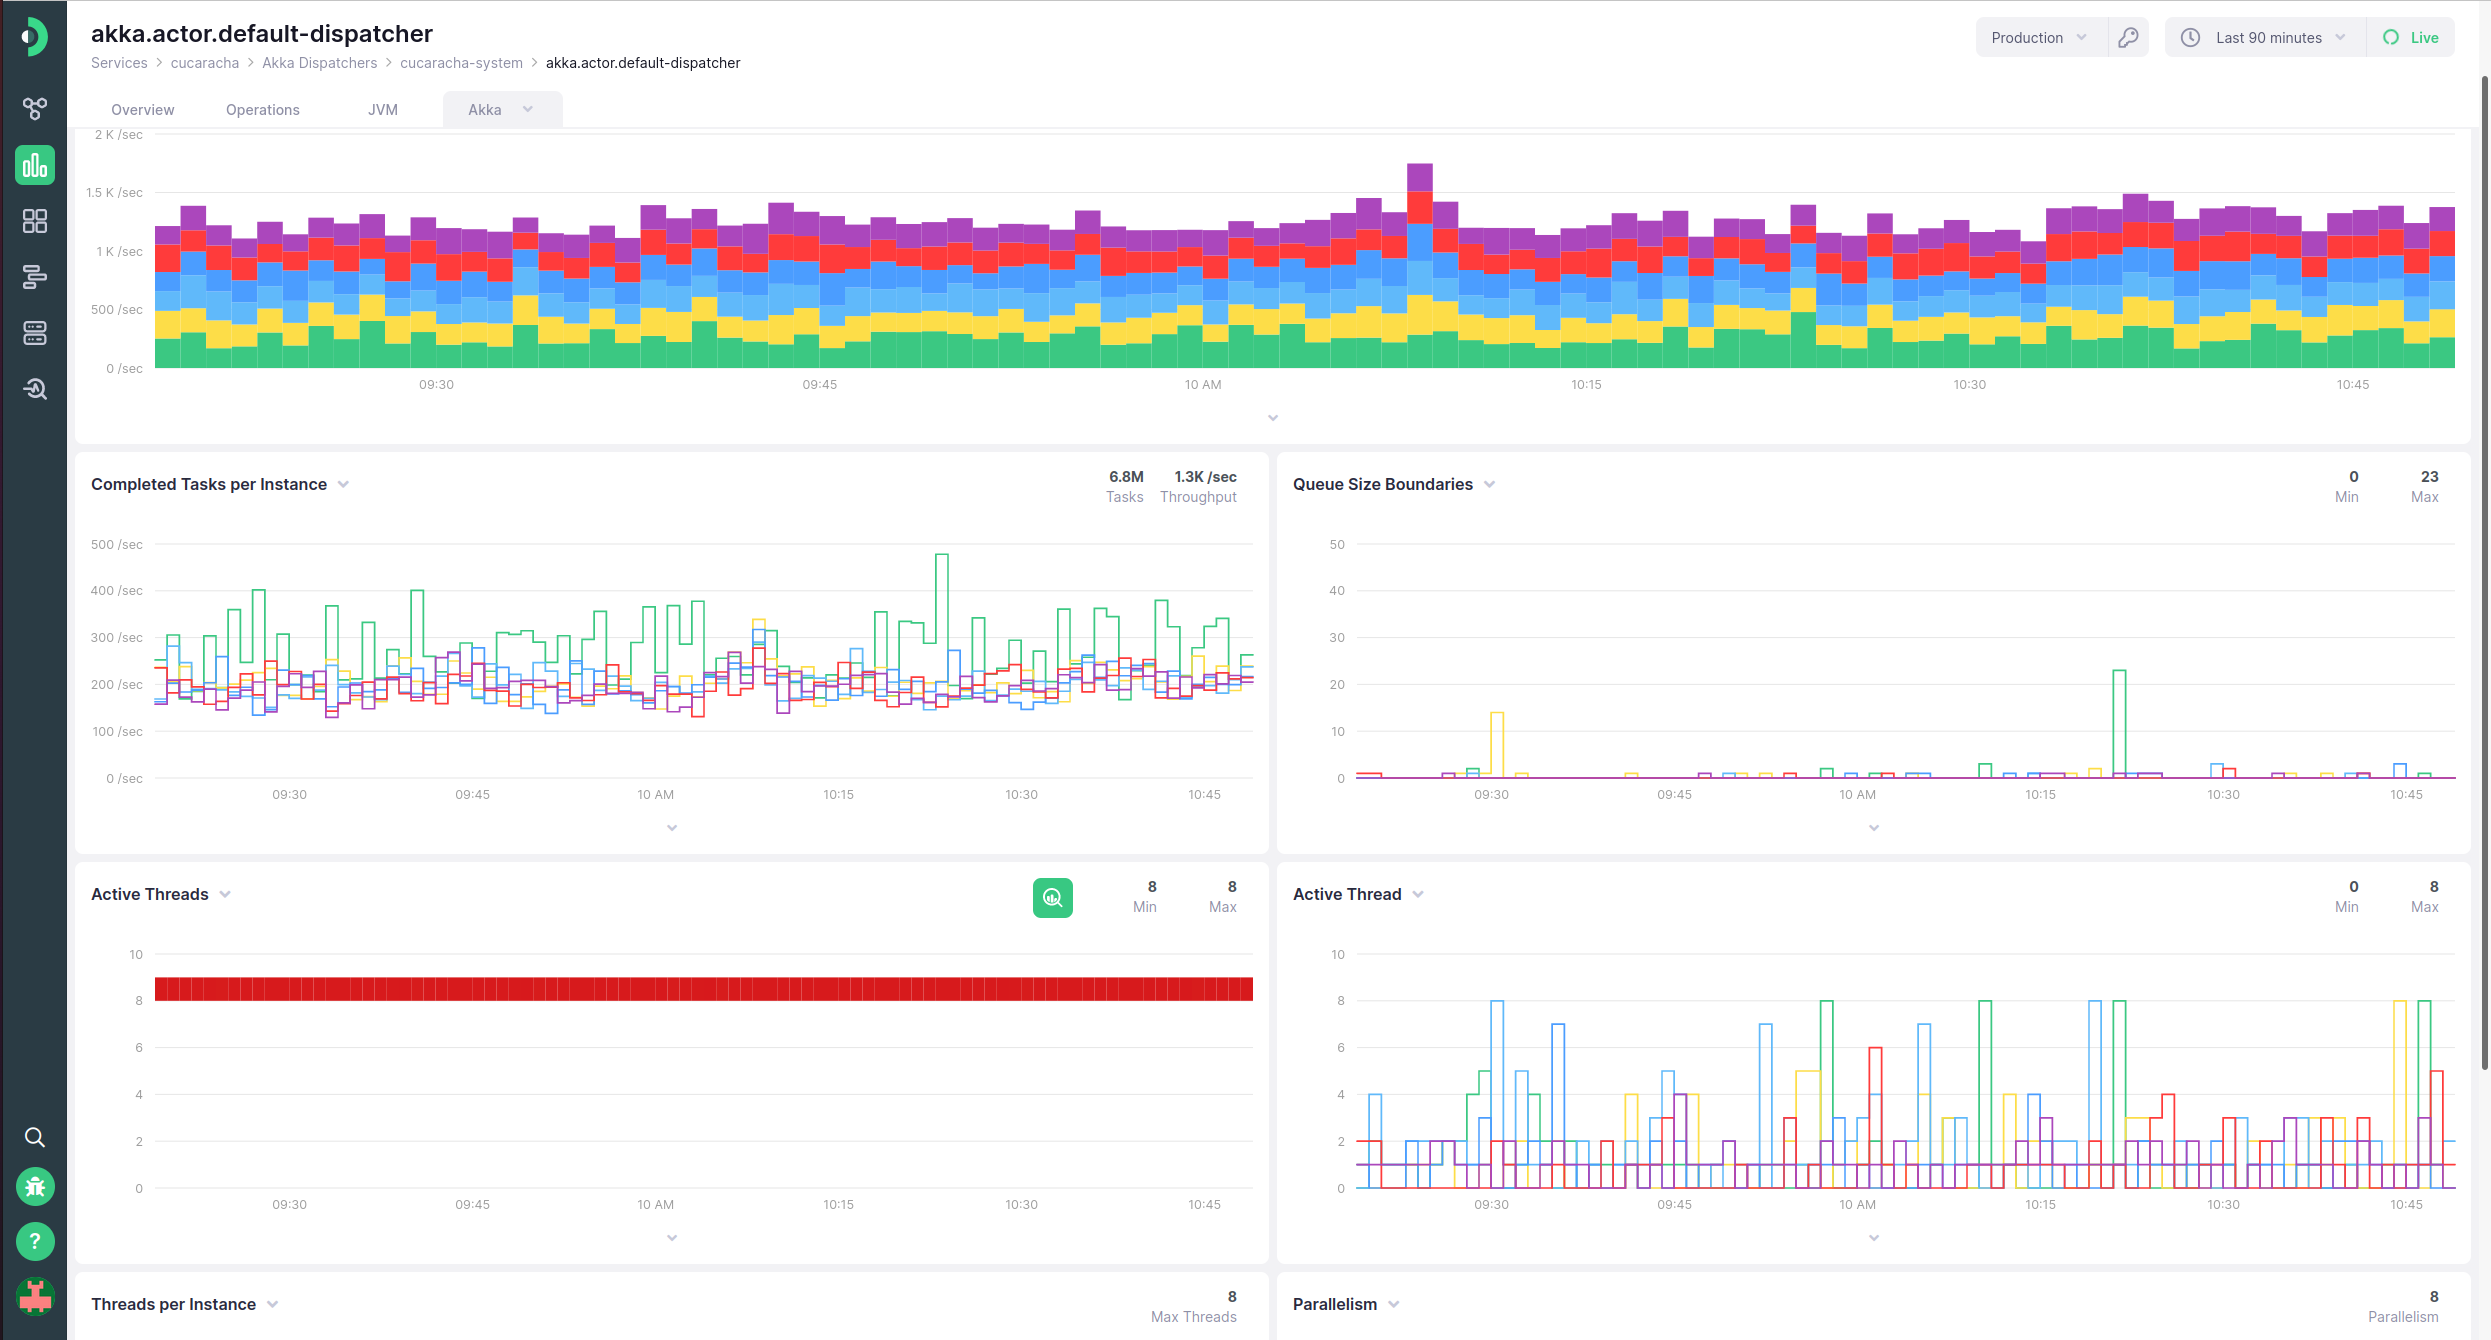
Clicking on any of the entries will bring up the Dispatcher Details page, with a dashboard displaying the following metrics, all for that particular dispatcher:
- Dispatcher completed tasks
- Dispatcher completed tasks per instance
- Dispatcher queue size
- Active threads heatmap
- Active thread counts
- Maximum threads per instance
- Maximum parallel threads
- Maximum pool size
Akka Router Dashboards #
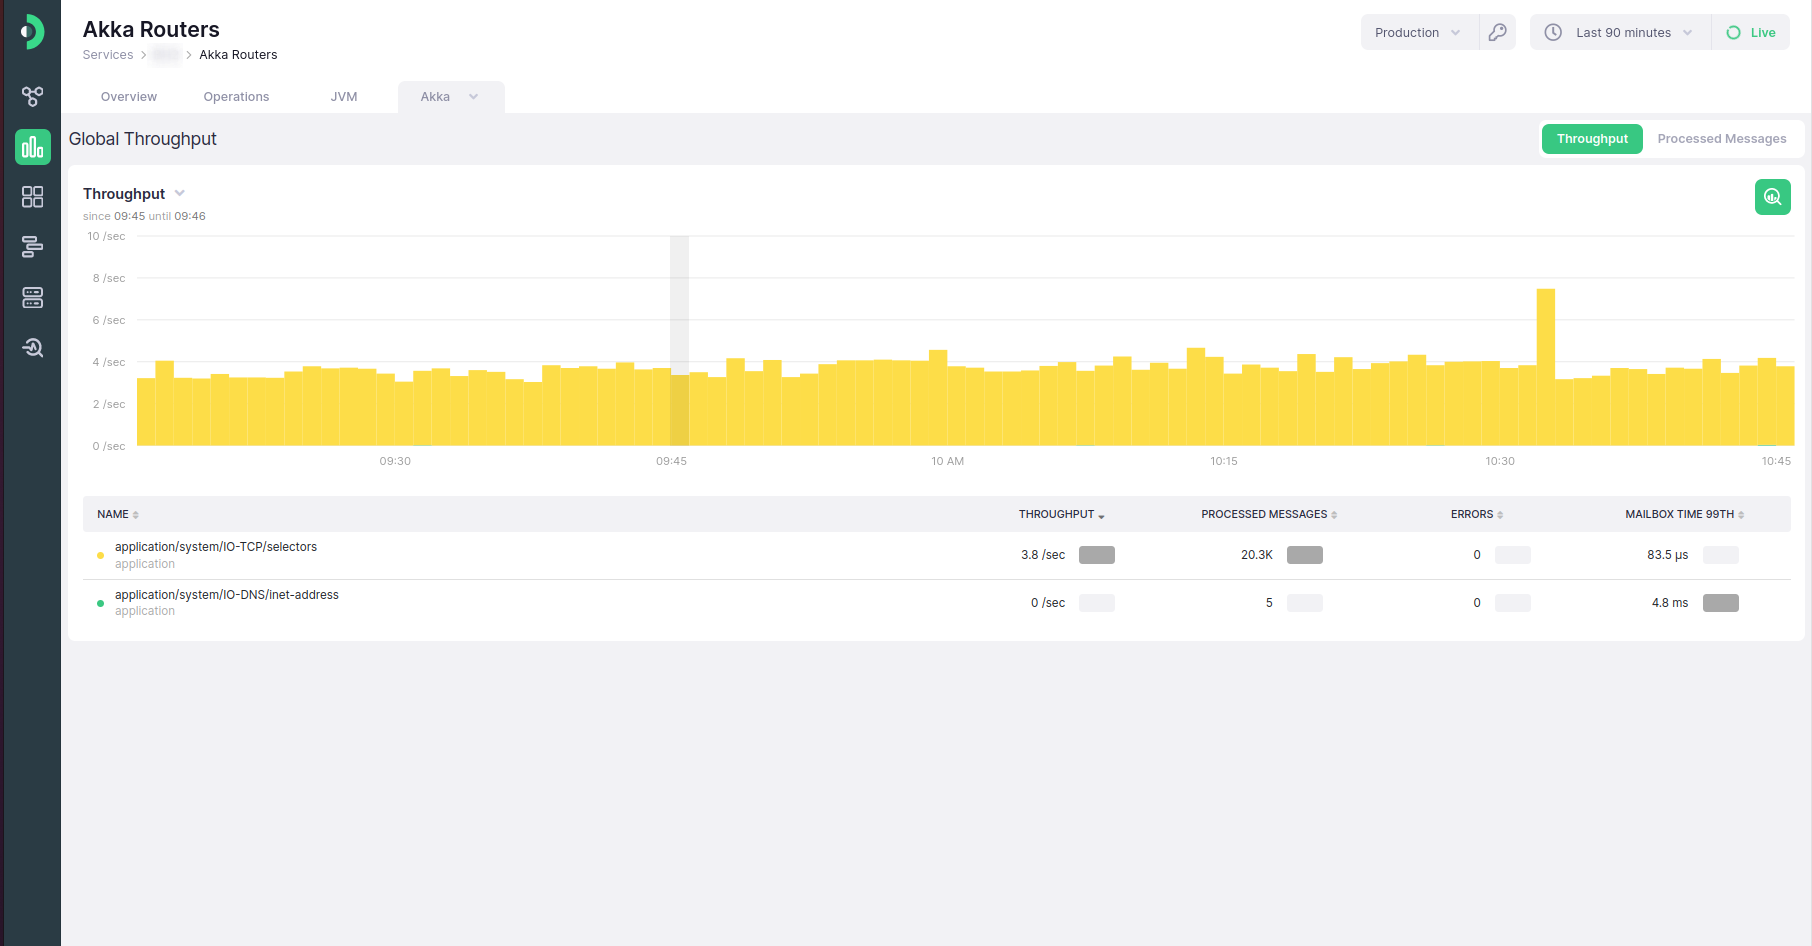
If making use of Akka Routers to distribute the workload, Kamon will automatically detect them and integrate with them. An overview page will show an aggregation summary chart, with throughput, number of processed messages, number of errors, and p99 of time in mailbox, grouped per router and actor system. Both the router and the actor system will be used to label the entry.
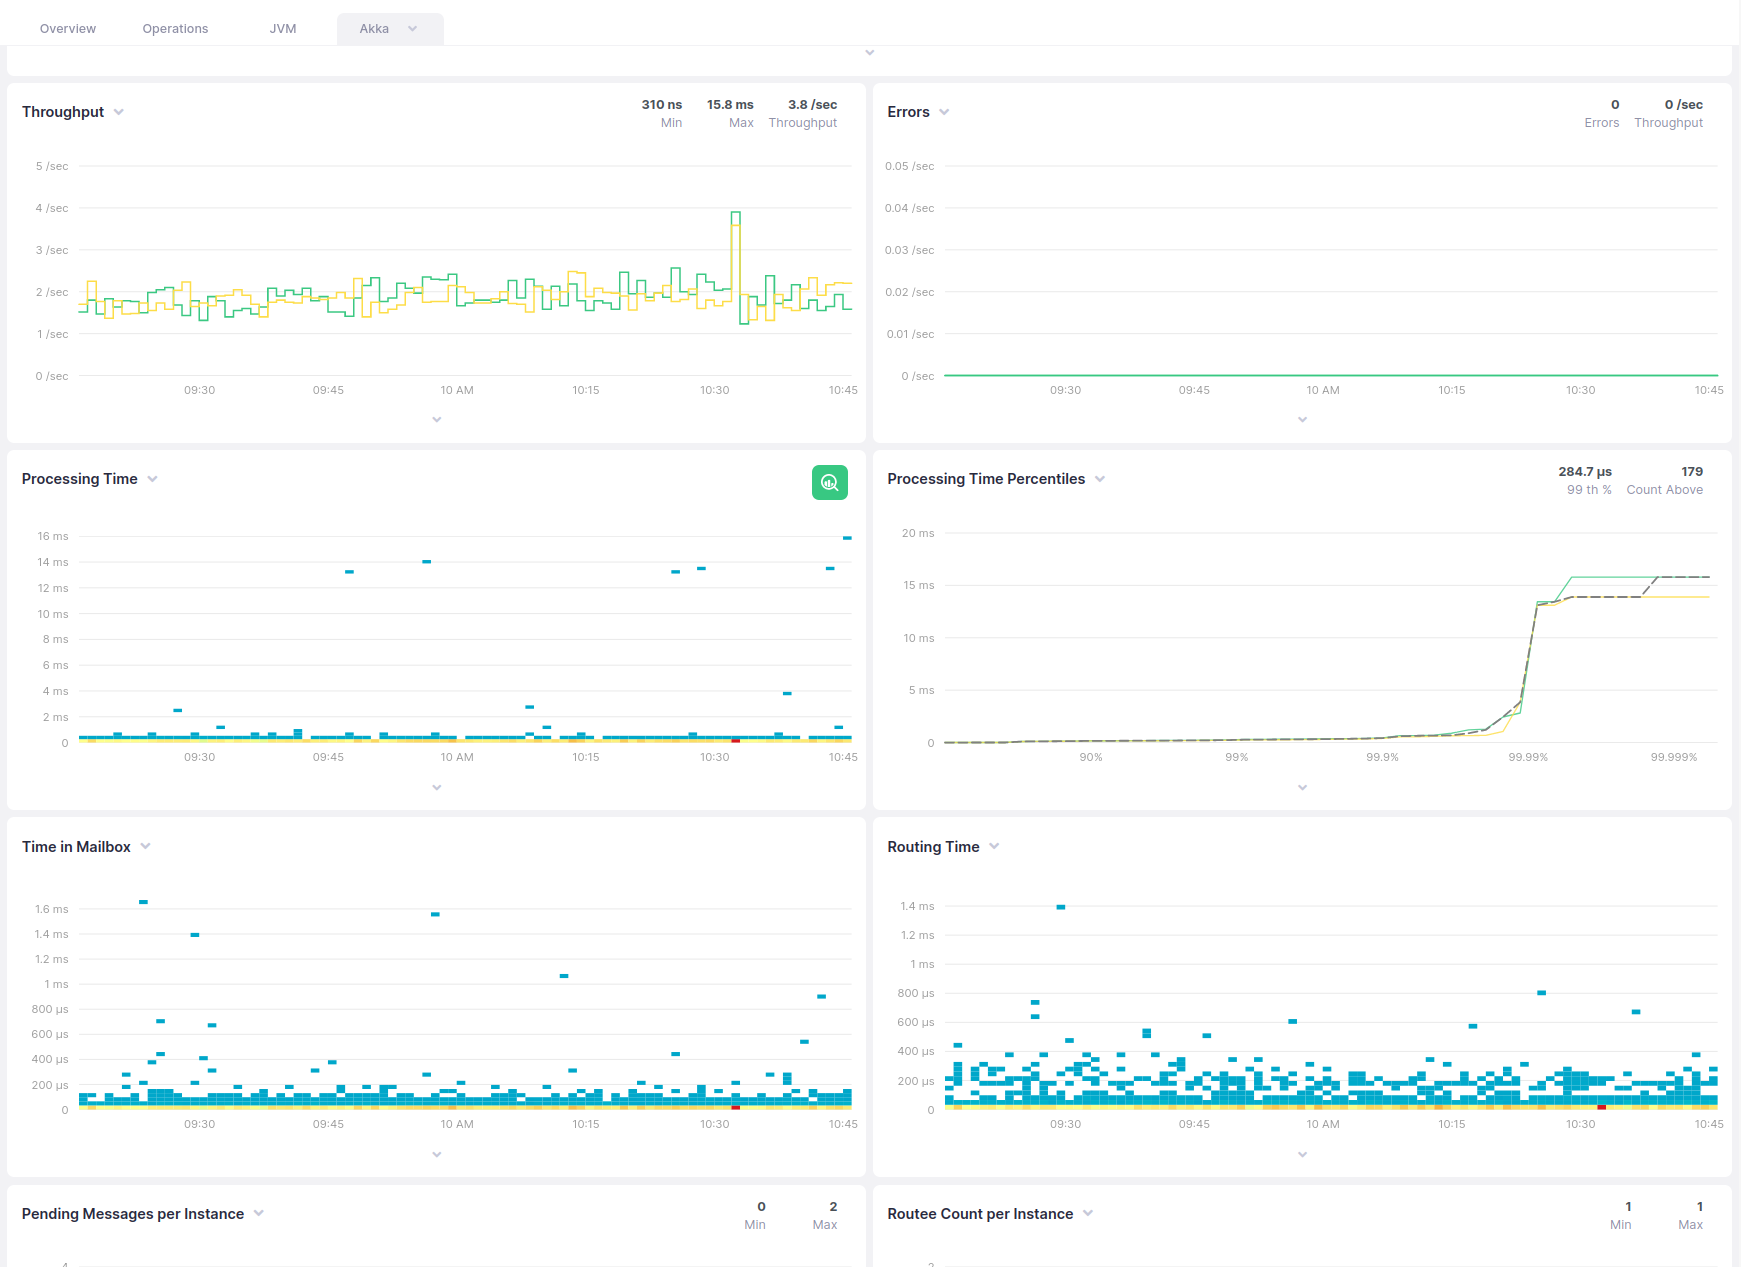
Clicking on any of the entries will bring up the Router Details page, with a dashboard displaying the following metrics, all for that particular router:
- Router throughput
- Throughput per instance
- Number of errors per instance
- Processing time heatmap
- Processing time percentiles chart, per instance
- Time in mailbox heatmap
- Routing time heatmap
- Number of pending messages per instance
- Routee count per instance
- Overall number of pending messages
- Overall routee count
Akka Cluster Shard Dashboards #
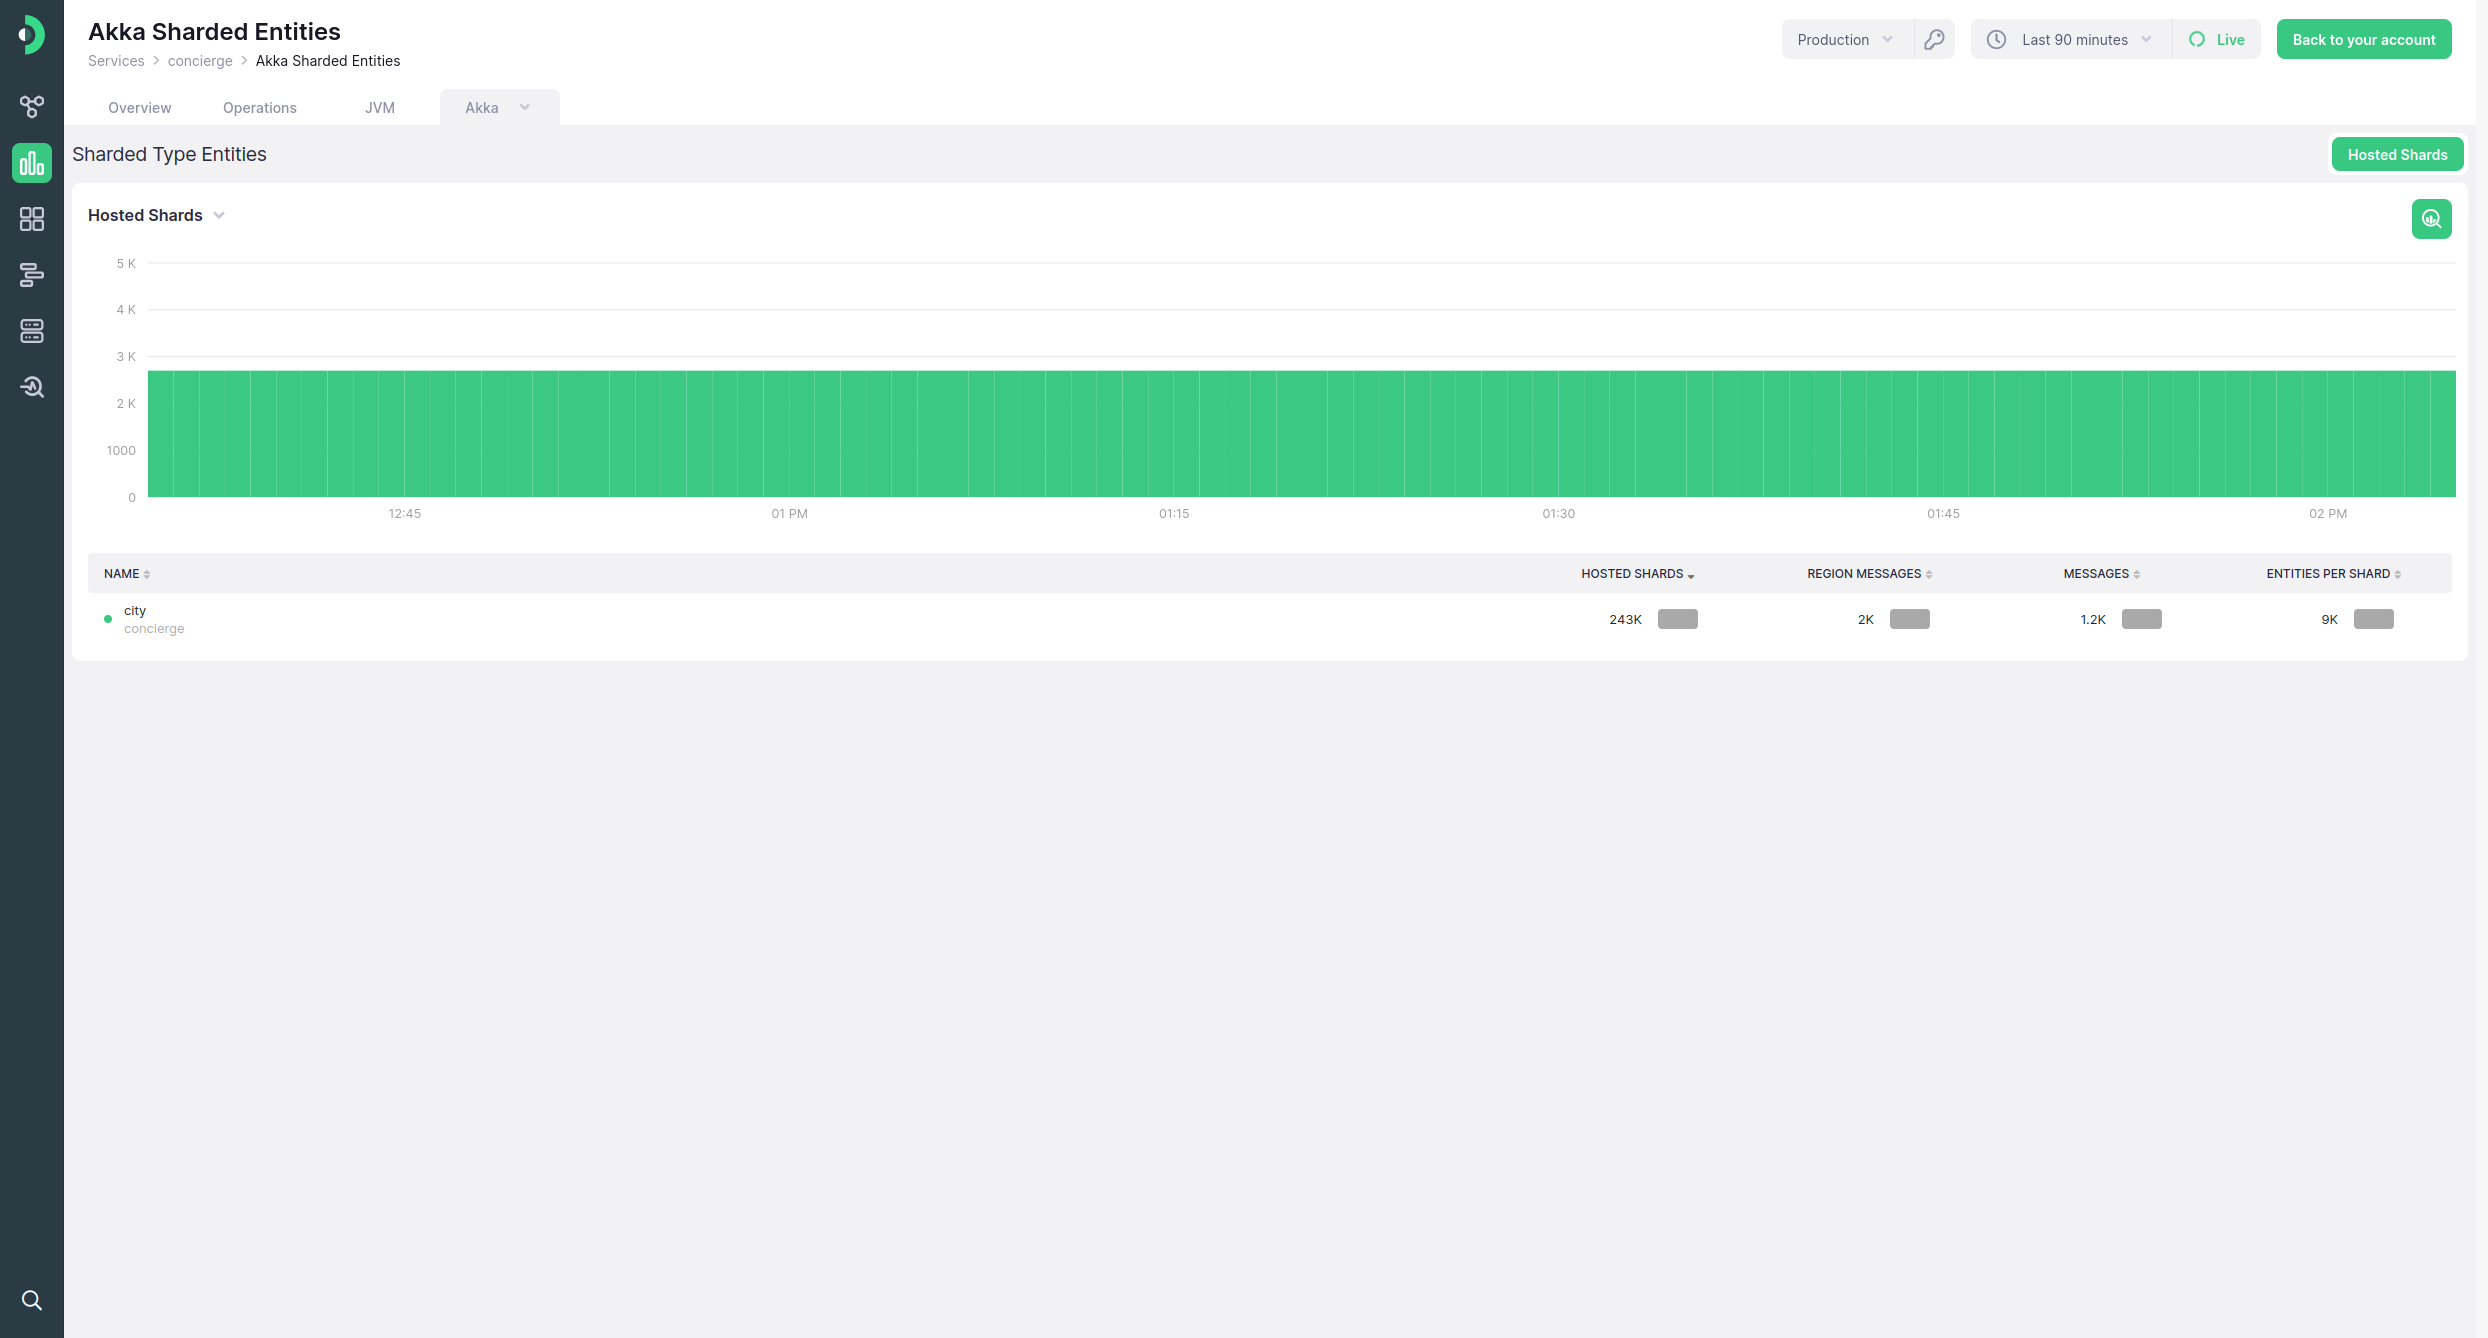
If you are distributing the work of Akka across several nodes using Akka Cluster Sharding, Kamon Telemetry will automatically integrate with it, and a detailed breakdown will appear in Kamon APM. An aggregation summary chart will group data per shard type and Akka actor system. Each entry will display the number of hosted shard, the number of region messages, number of processed messages in the shard overall, and the number of entities for that shard. Only the number of hosted shards will be visualized in the chart.
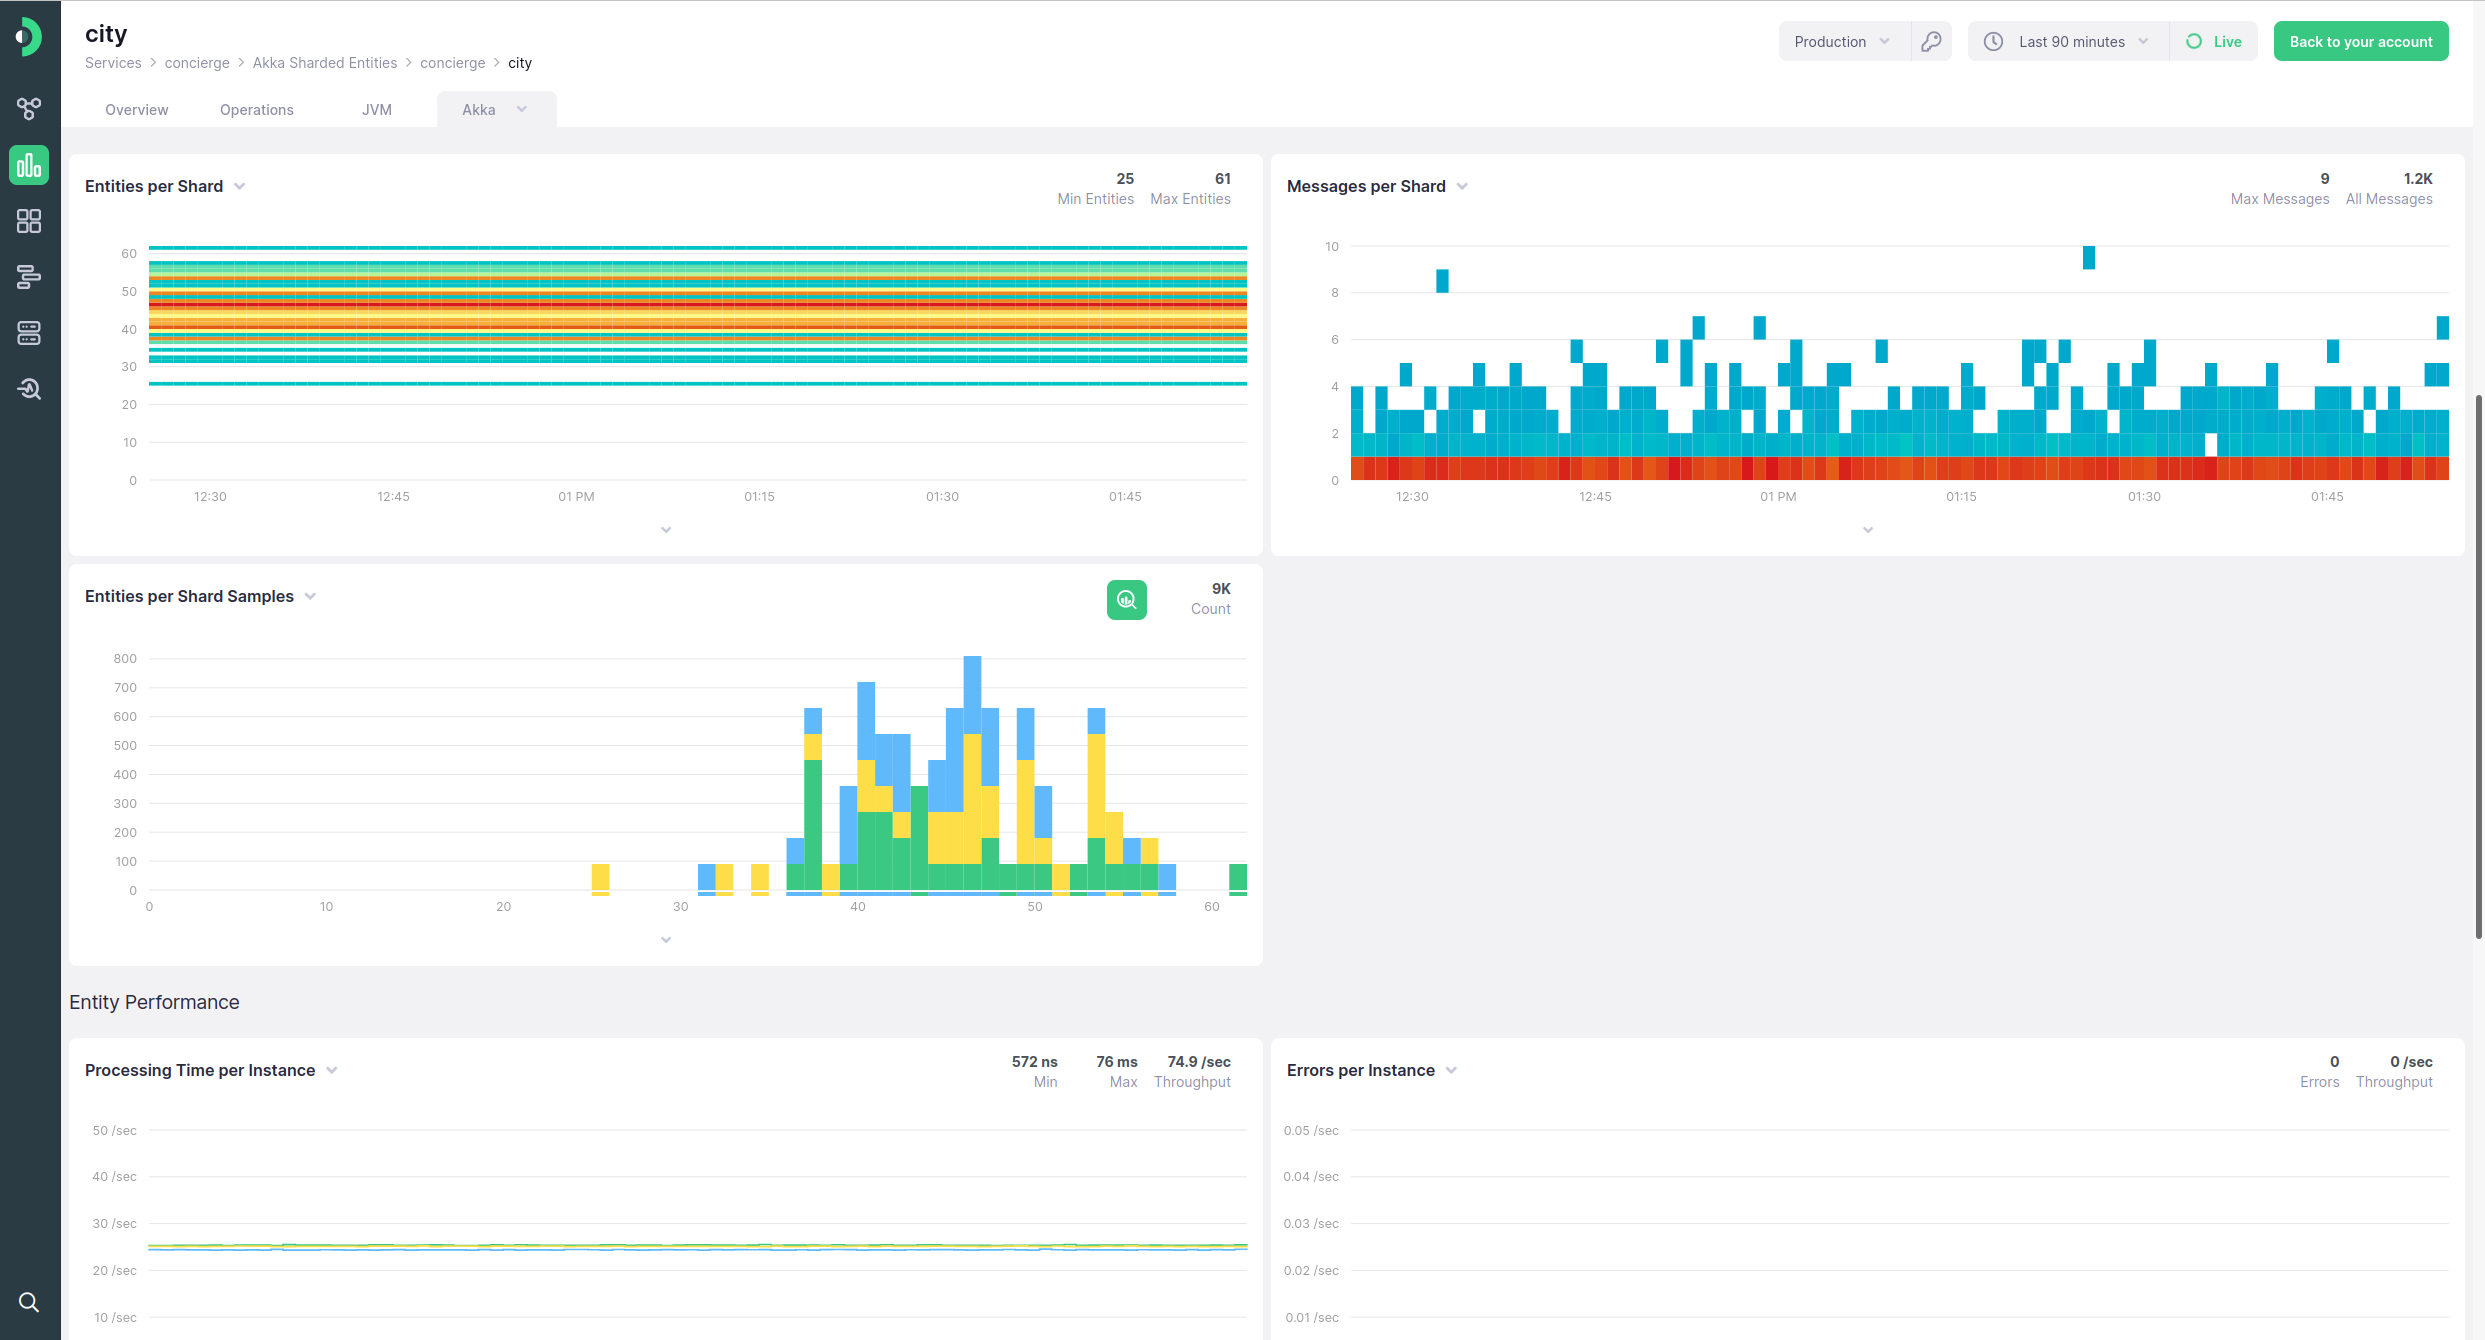
Clicking on any of the entries will bring up the Cluster Shard Details page, which is split up into a region overview section, a shard breakdown section, and an entity performance tracking section.
The region overview section will display the following metrics:
- Message throughput per region
- Histogram of shard counts per region
- Histogram of entity counts per region
The shards breakdown will display:
- Histogram of entities per shard
- Histogram of messages per shard
- Number of entities per shard, as a stacked bar chart
Finally, the entity performance section includes the following:
- Processing time throughput, per instance
- Error throughput per instance
- Processing time histogram
- Processing time percentiles chart
- Time in mailbox distribution
- Histogram of pending work counts
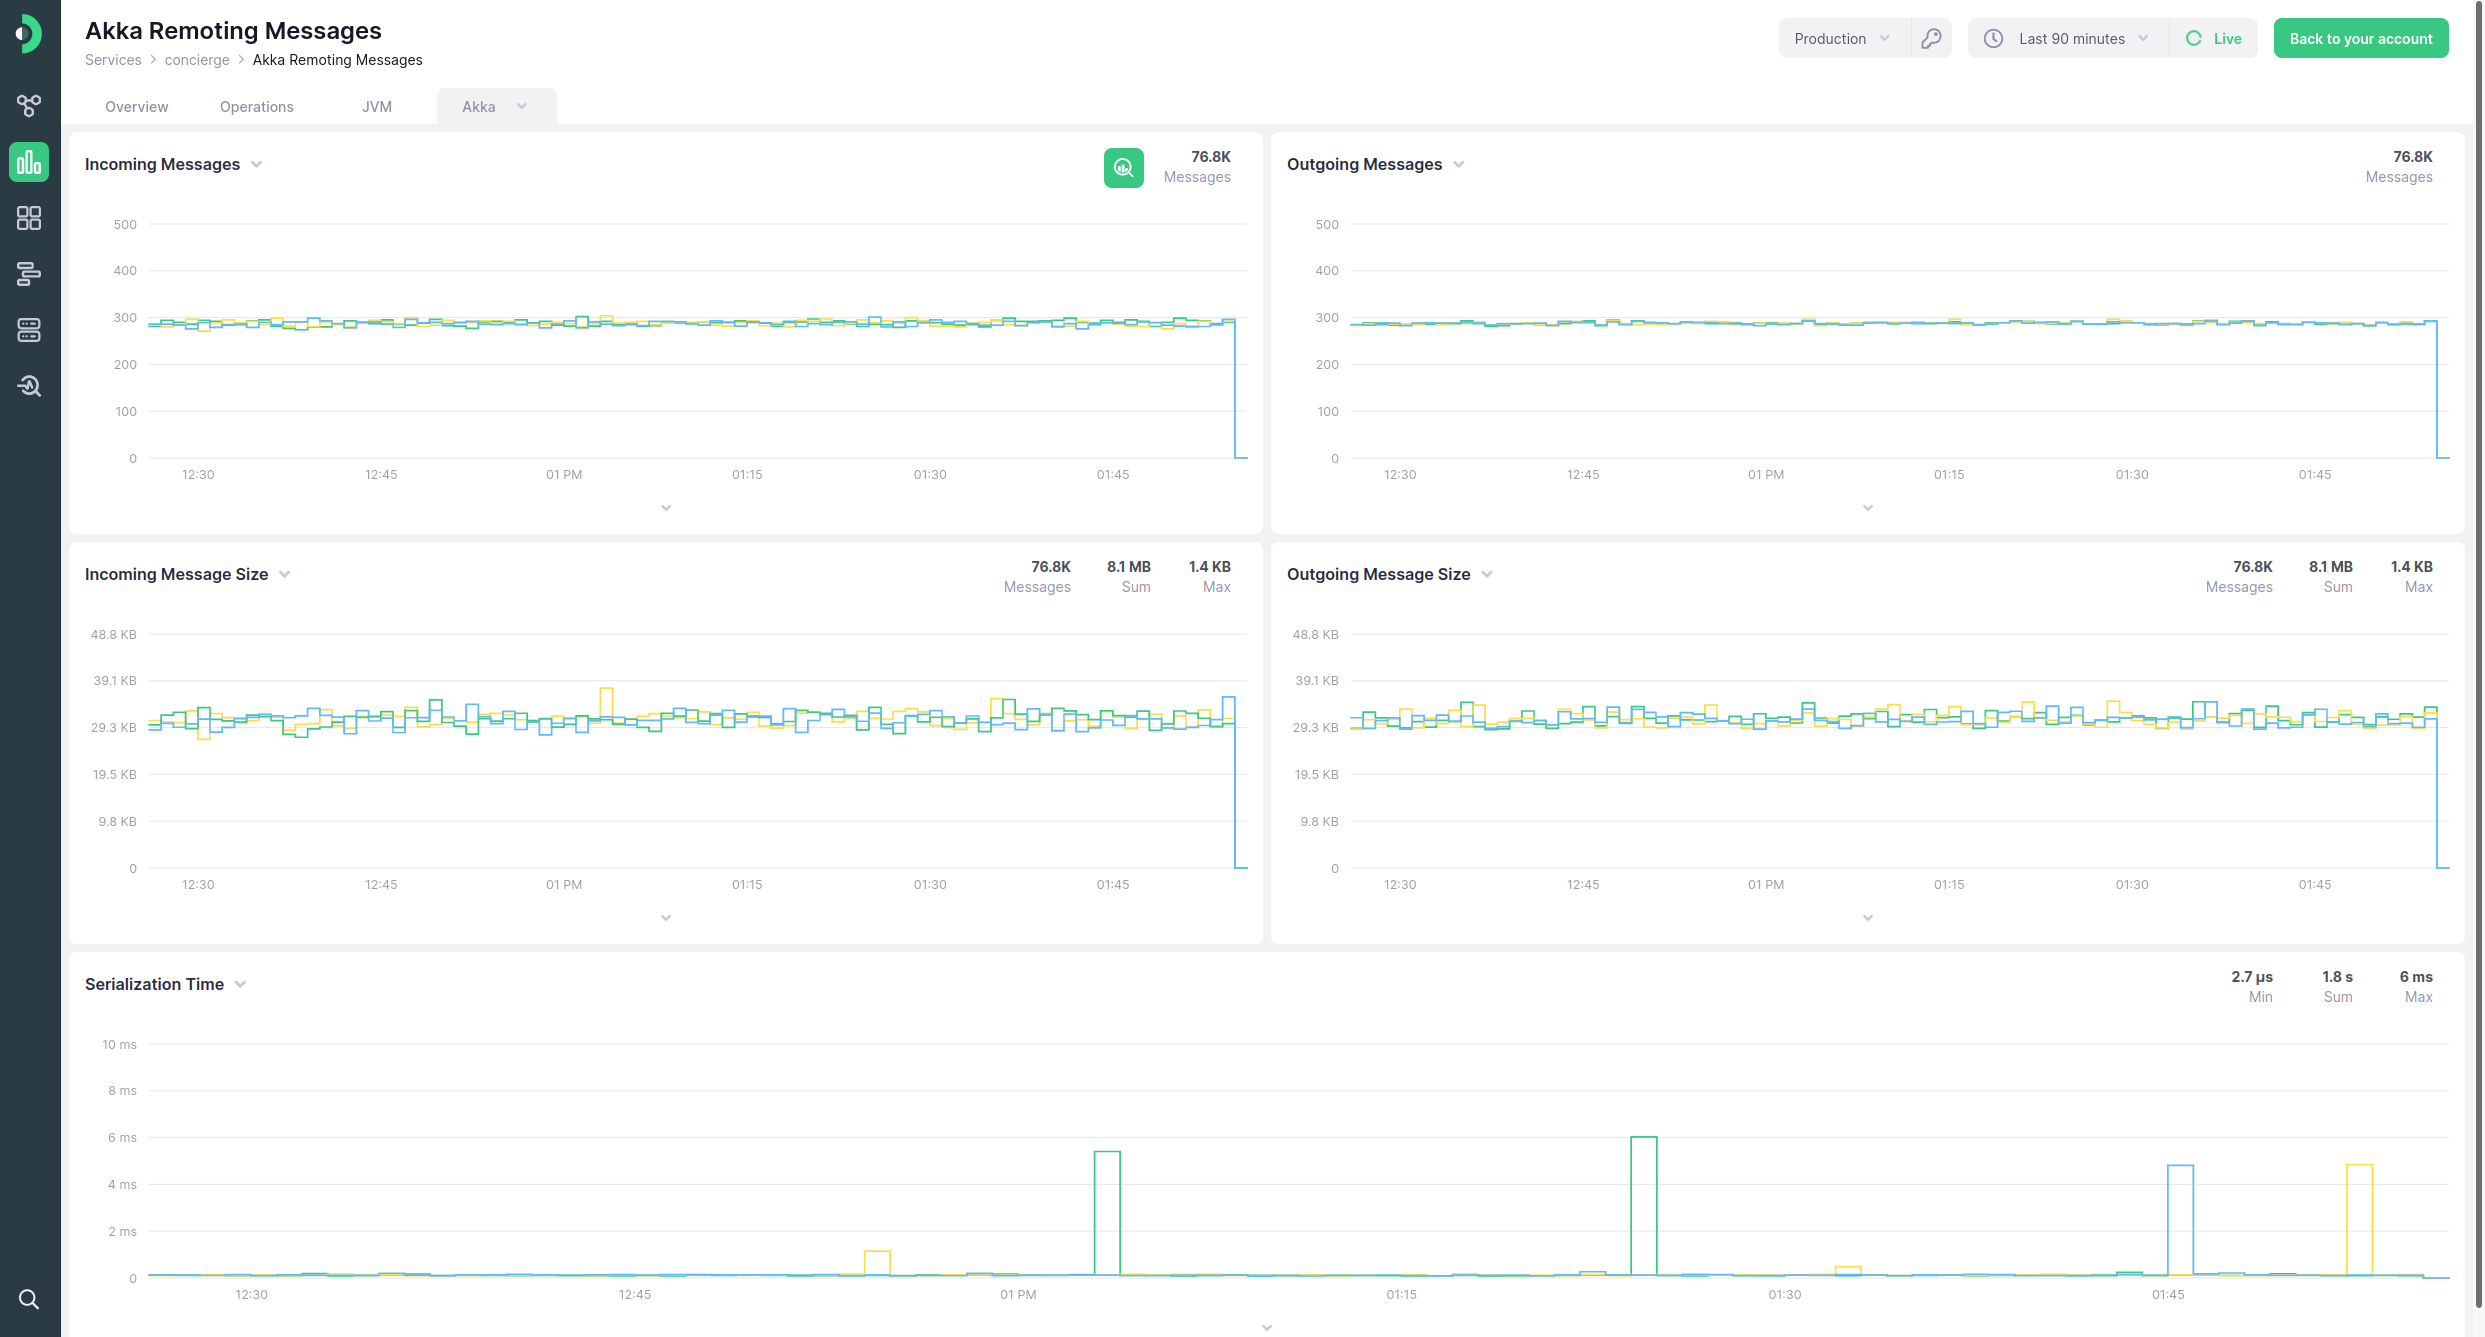
Akka Remote Messages Dashboard #
For JVM services making use of Akka remoting to communicate remotely across nodes, Kamon APM will show a pre-made dashboard with details about messages exchanged. Counts and sizes (in bytes) of incoming and outgoing messages will be shown, grouped by Akka system as well as instance. Additionally, maximum serialization times for each system and instance are shown, with the chart summary also indicating the minimum time and the summed up time spent on marshalling data overall.