 Monitoring Tools for Spring Boot
Add a few lines of code and get the full story for every request, from your controllers and all the way down to database and external API calls
Start with a FREE account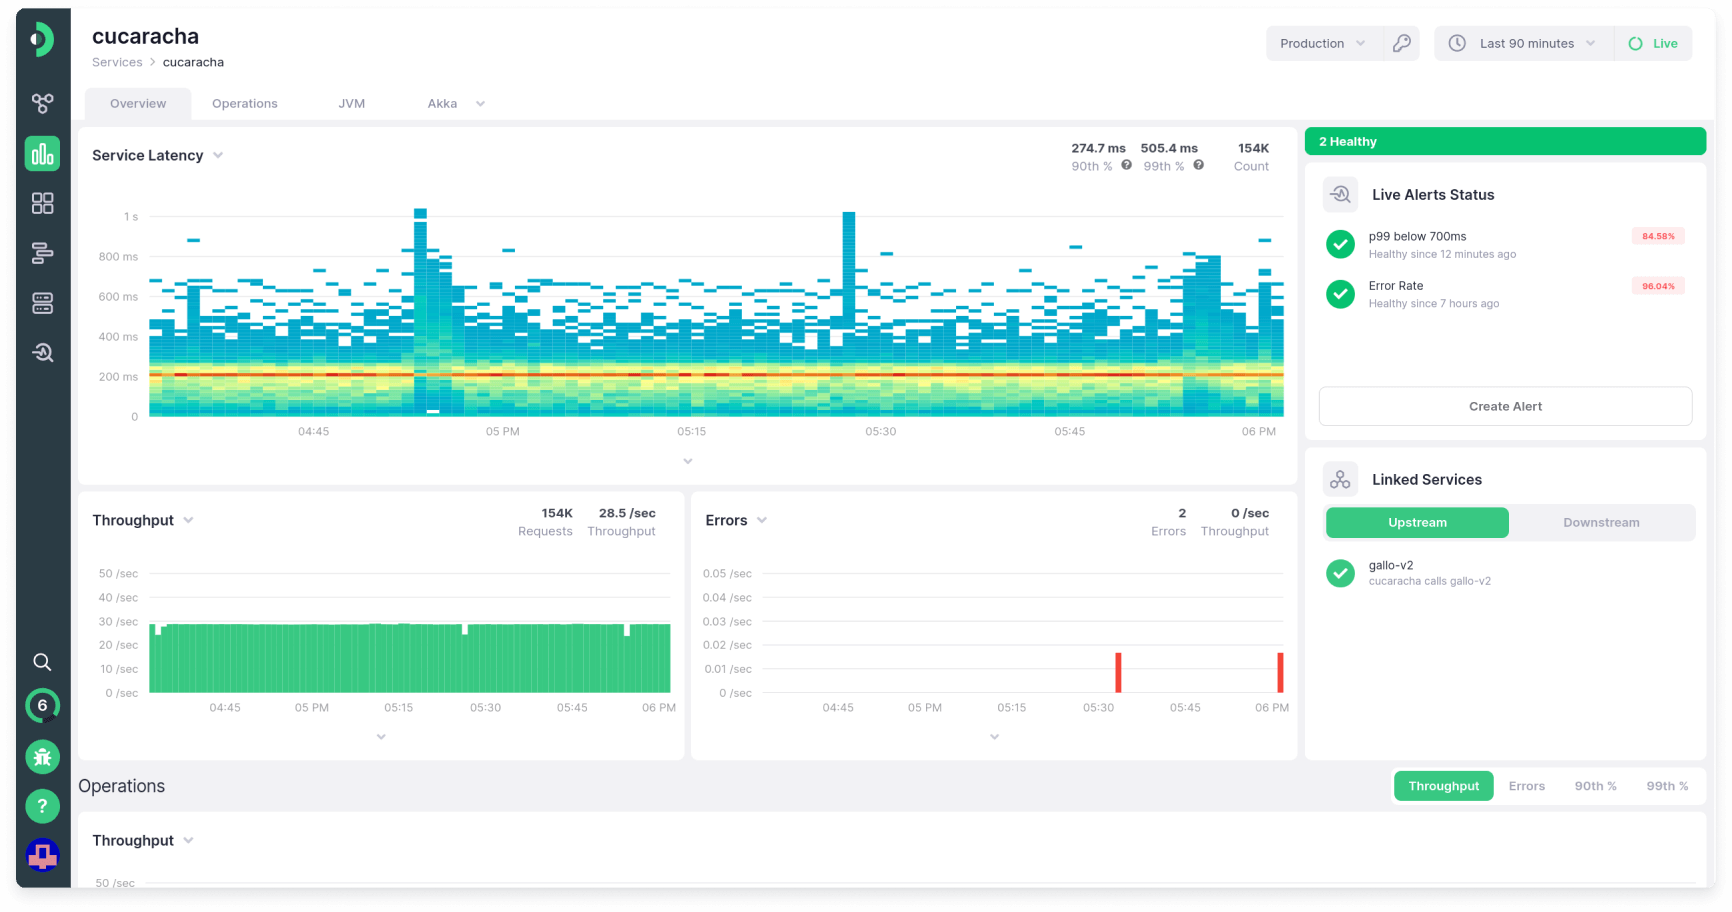
Get the full picture, from controllers to the database
High latency and errors are often related to slow database queries or external API calls. Instrument, visualize, and monitor all of those interactions automatically with Kamon
Follow requests across services and external calls
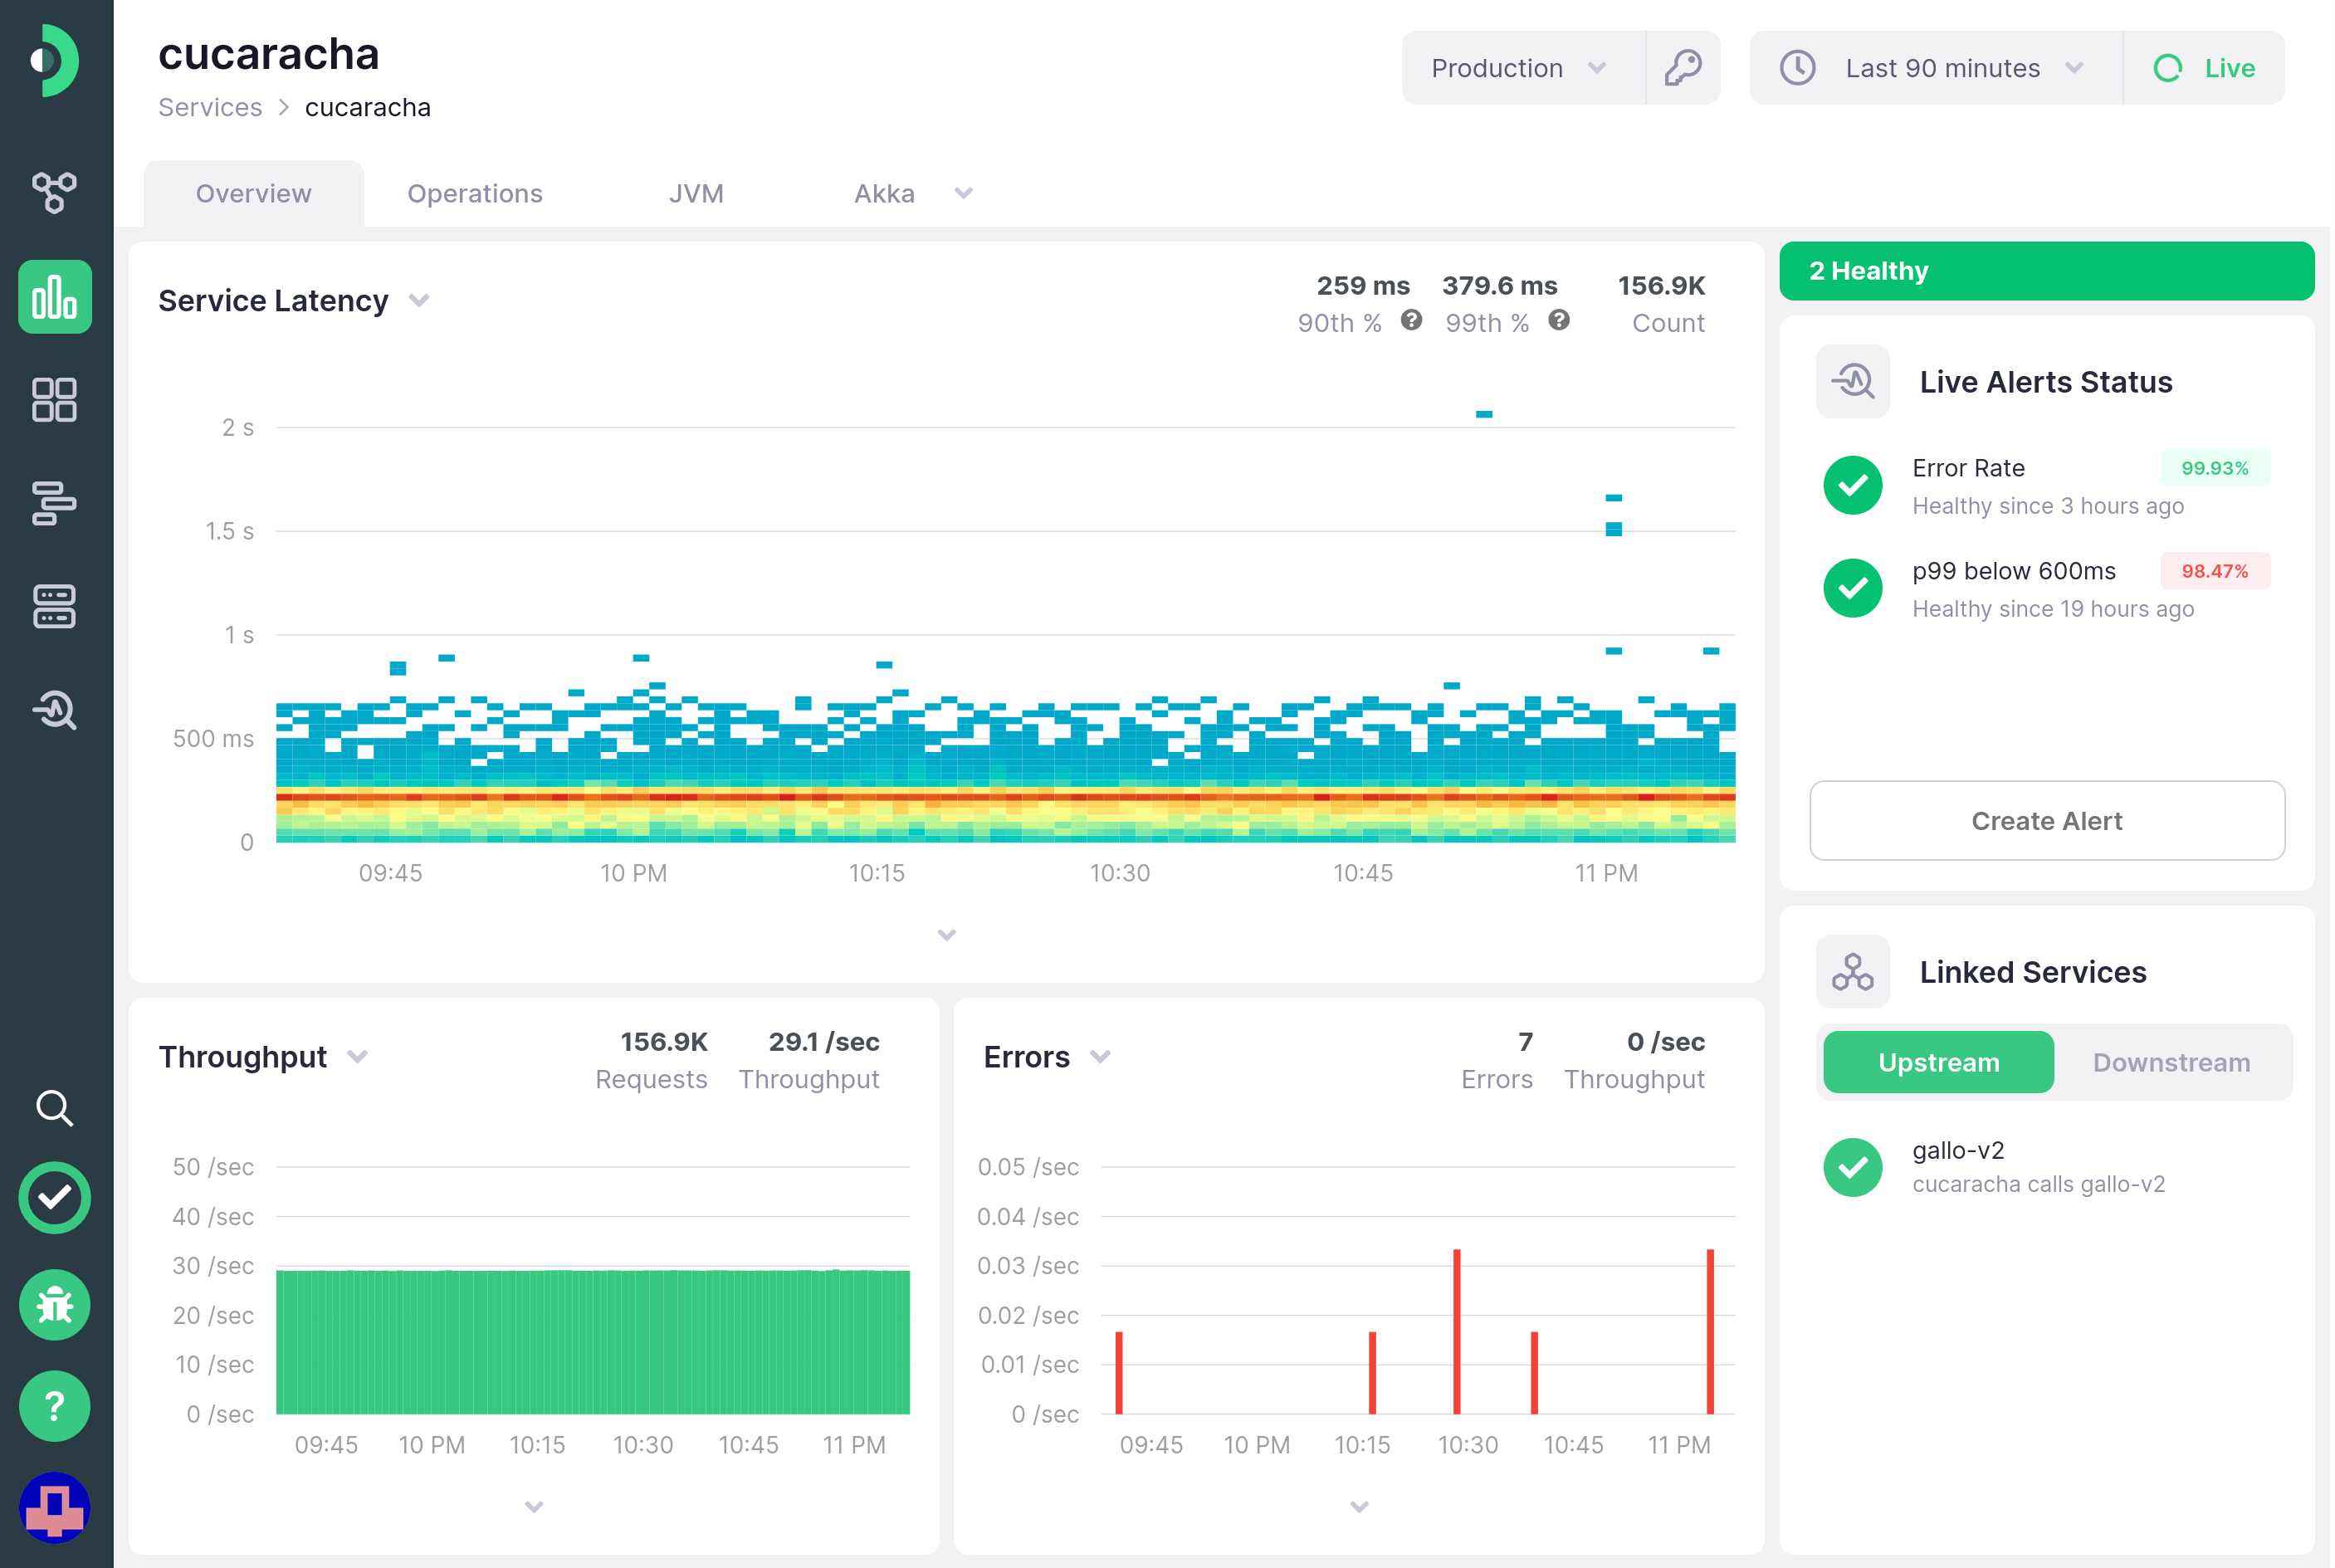
Monitor response time, throughput, and errors for every Spring Boot controller and external HTTP call
Get traces and dashboards for OkHttp, Spring WebClient, and other HTTP client calls automatically, right out of the box
Trace all interactions with your database
See how each database query contributes to a request's latency, along with HikariCP health metrics
And it is not just about JDBC: trace calls to Redis, Elasticsearch, Cassandra, and messages flowing from Kafka producers to consumers
Everything you need to monitor effectively
Solve your operational challenges with a single tool: monitor for latency spikes and errors, explore metrics and traces to find root causes, and follow up after deploying fixes and new features
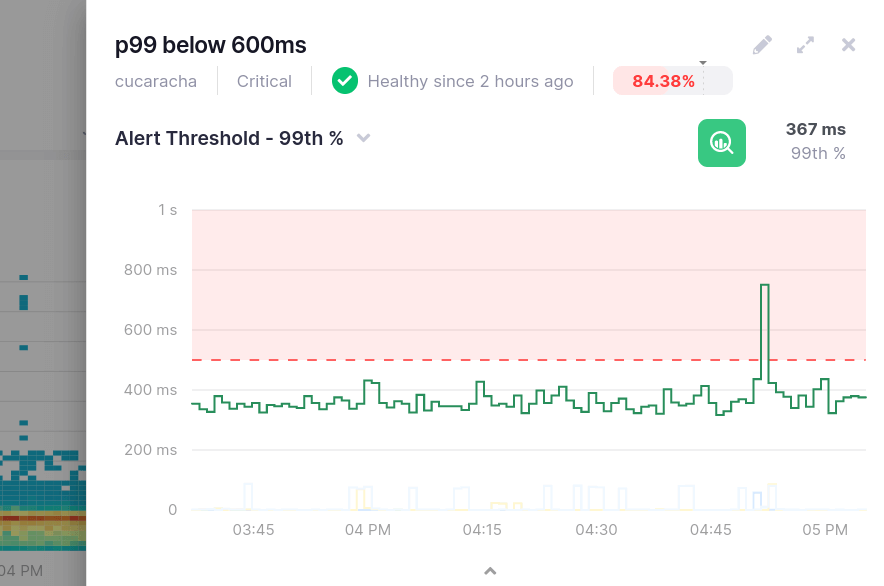
Be the first to know when something goes wrong
Get notified on Slack, PagerDuty, or email when your Spring Boot controllers slow down or start throwing errors
Forget about using percentile approximations or configuring buckets. Kamon comes with high-fidelity metrics and up to 1% error margin to guarantee you will not be chasing false signals
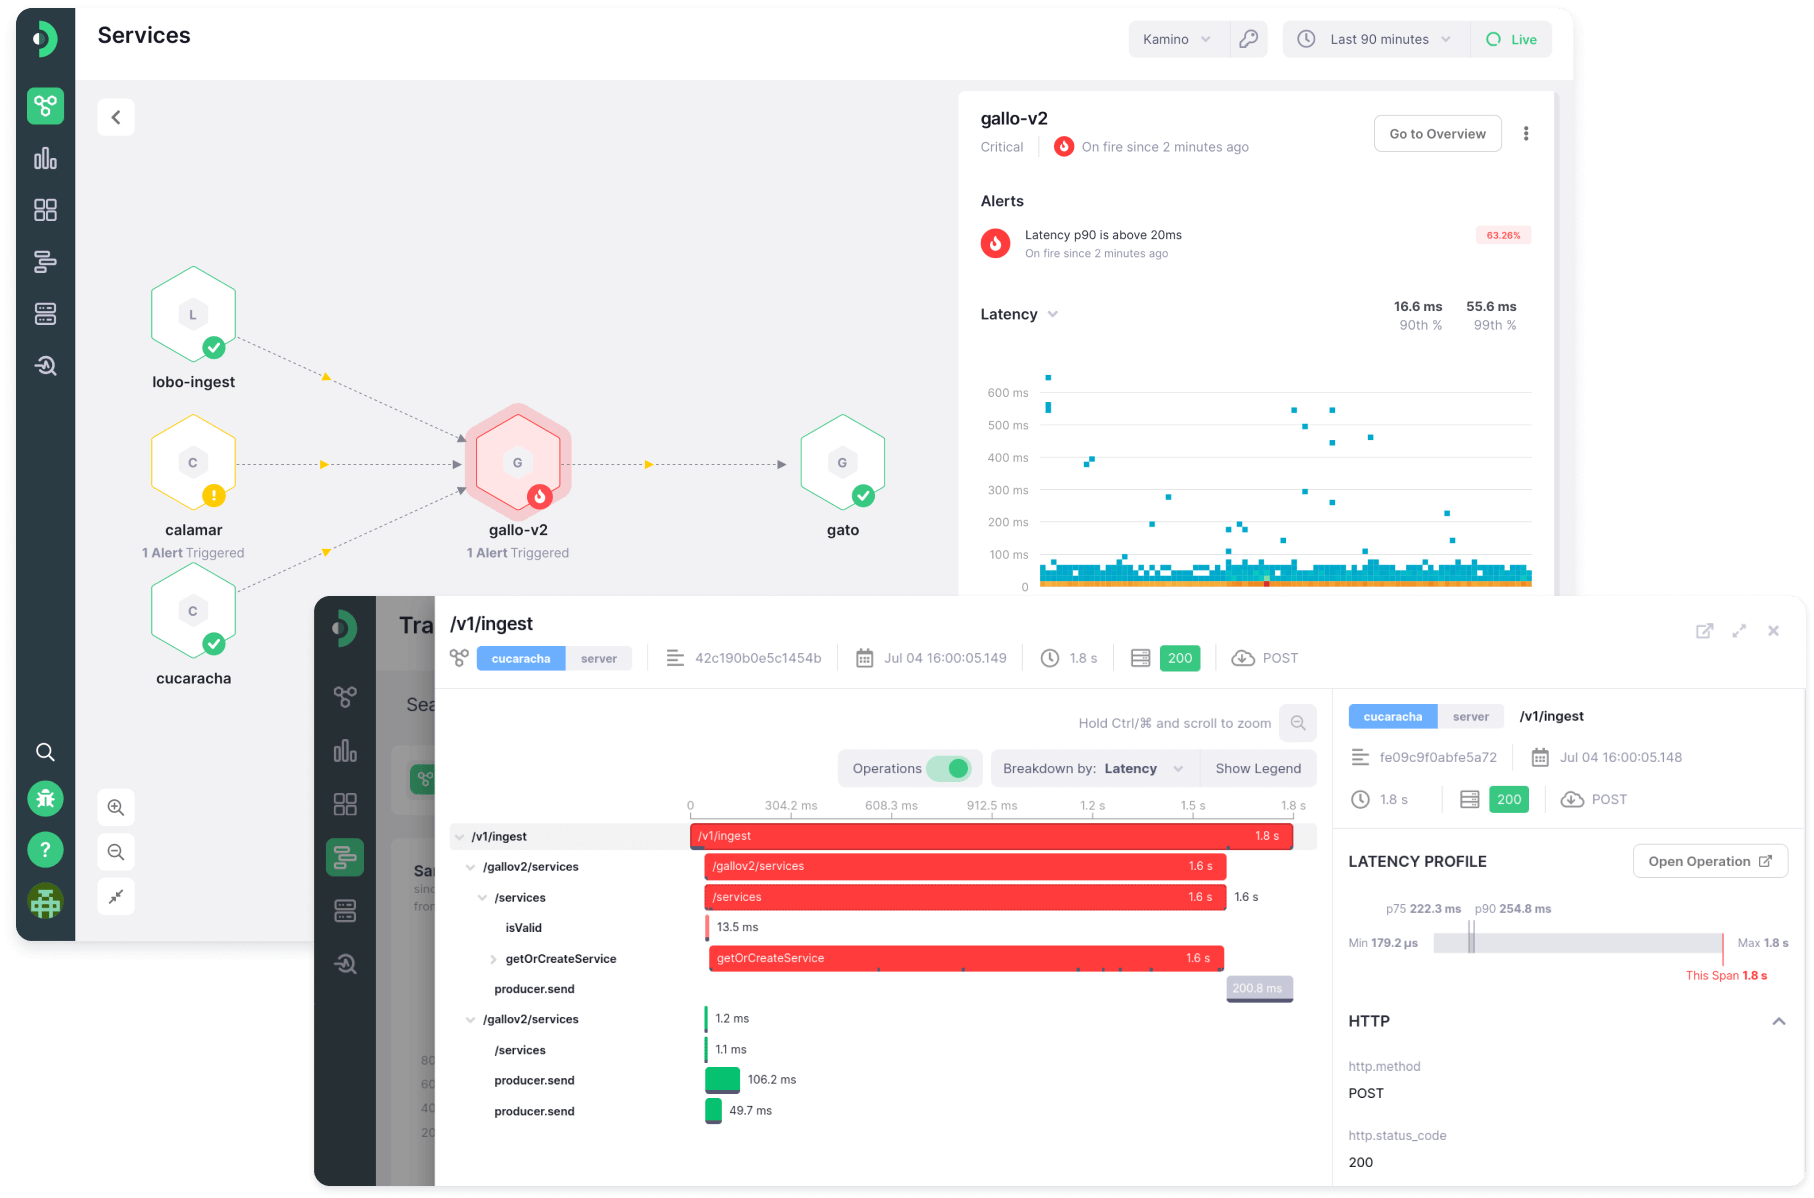
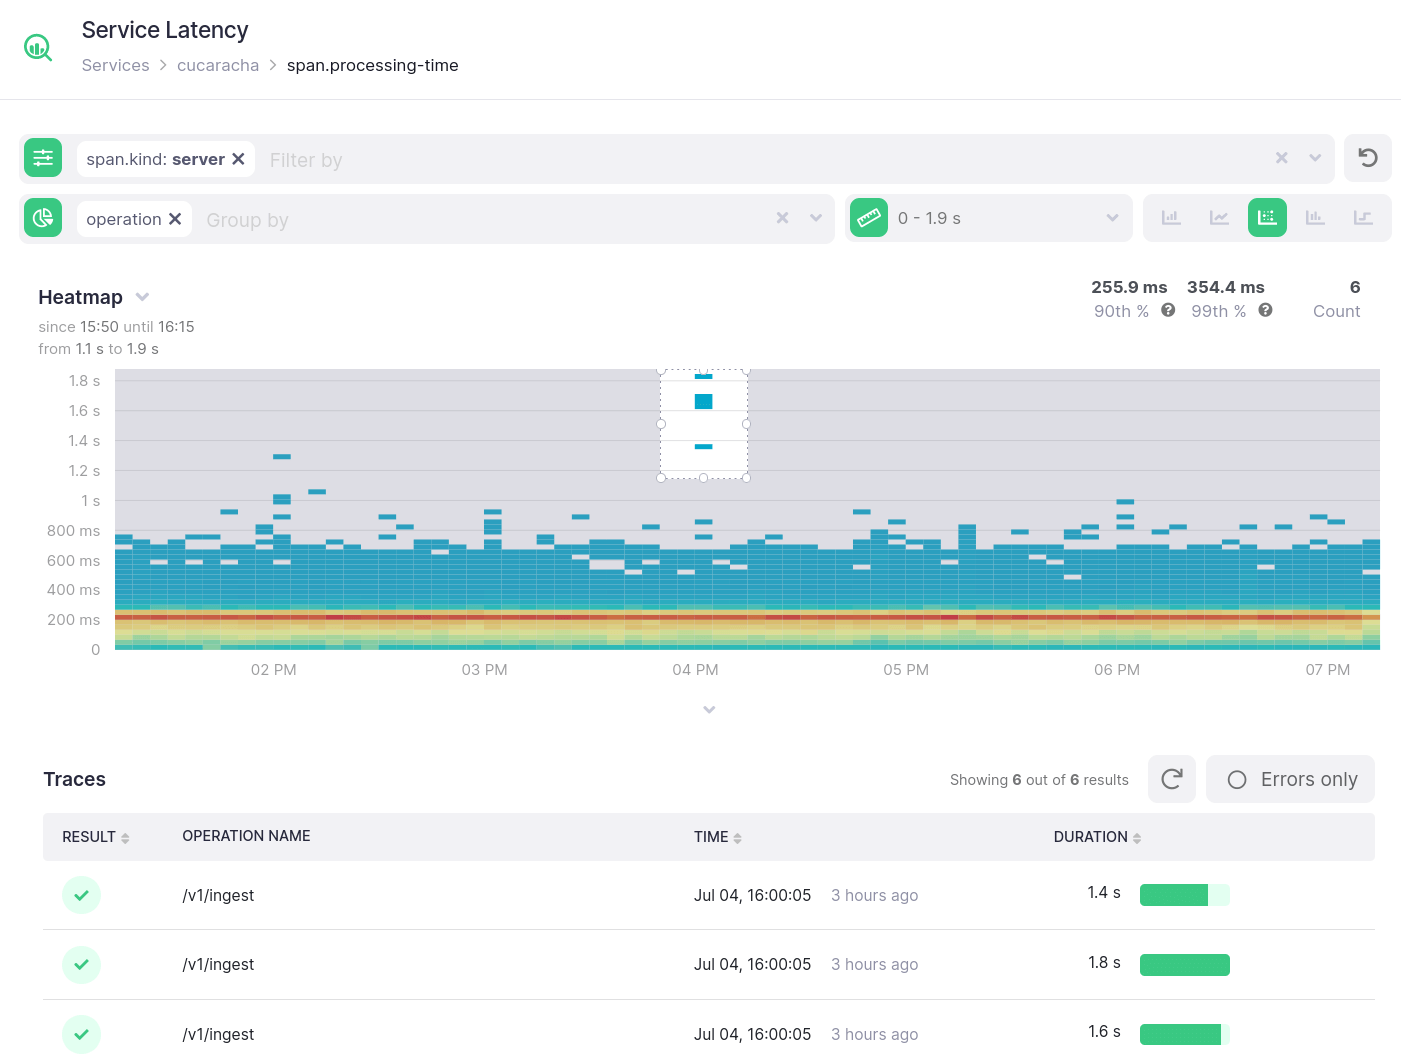
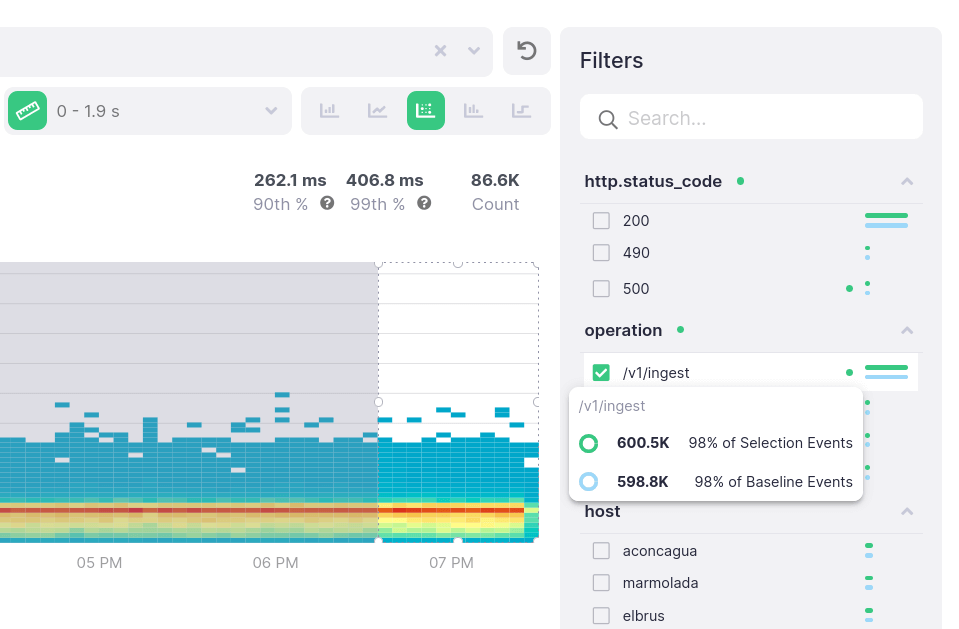
Find the traces connected to high response times and errors
Select any latency spike on your Spring Boot applications and get all the related traces
Use the full picture on every trace to find root causes. Every HTTP call across services, exceptions thrown in your code, and interactions with external systems will be there for you to investigate
Deploy new features and fixes with confidence
Ensure that response times stay healthy and errors are gone after deploying your fixes
Catch issues before deploying, with Free monitoring for your development and staging environments
Start monitoring Spring Boot apps in minutes
When your applications start getting serious traffic and latency gets out of control, you need to act fast. Forget about complicated configurations and infrastructure to start monitoring
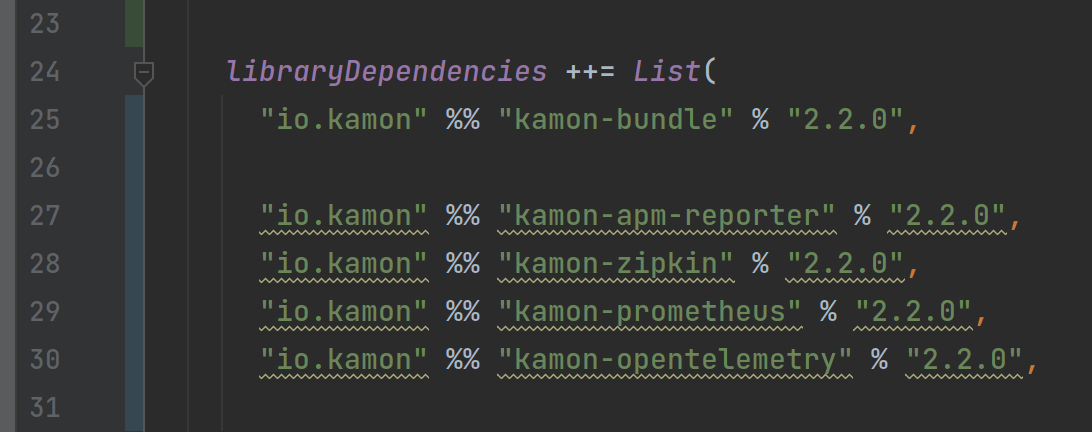
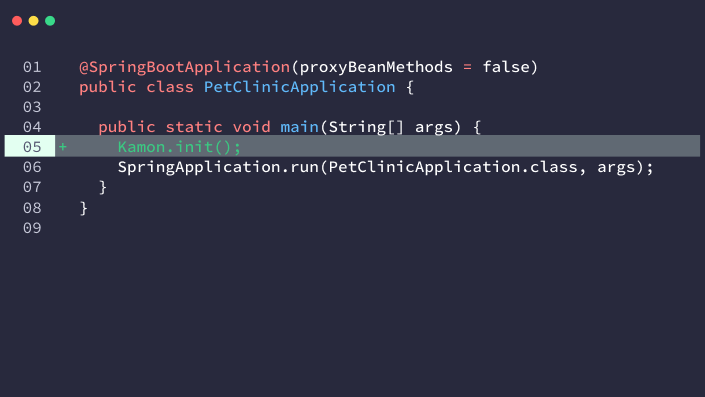
Start with a single line of code
Besides the library dependencies and configuring your API key, you only need one line of code to get started
Kamon Telemetry recognizes the libraries in your classpath and activates the required instrumentation automatically, so you can get metrics and traces without changing your code
Get all your metrics and traces organized and ready to explore
Don’t waste time setting up your own infrastructure from scratch or getting complicated configurations and agents running
Get all your services, hosts, and relationships between them organized automatically and ready for you to start discovering from your first minute in Kamon APM
Use any vendor without changing instrumentation
All Kamon instrumentation is independent from the components that send data to external systems
It will be a lot easier to monitor your Spring Boot apps with Kamon APM, but you can send your data to Prometheus, Zipkin, OpenTelemetry-compatible endpoints, and more without changing the instrumentation